

S&P 500, Nasdaq, TSLA, USD Talking Points:
- This week is loaded with drivers, with a litany of earnings reports coming from pretty much every sector of the market, along with tech heavyweights of Apple, Amazon, Google and Facebook.
- There’s a plethora of macro drivers, as well, with high-impact USD prints each day Tuesday-Friday along with an ECB rate decision on Thursday.
- The analysis contained in article relies on price action and chart formations. To learn more about price action or chart patterns, check out our DailyFX Education section.
Next week brings the Federal Reserve for the widely-awaited taper announcement, but this week carries some significance as there’s a number of drivers coming to the fray.
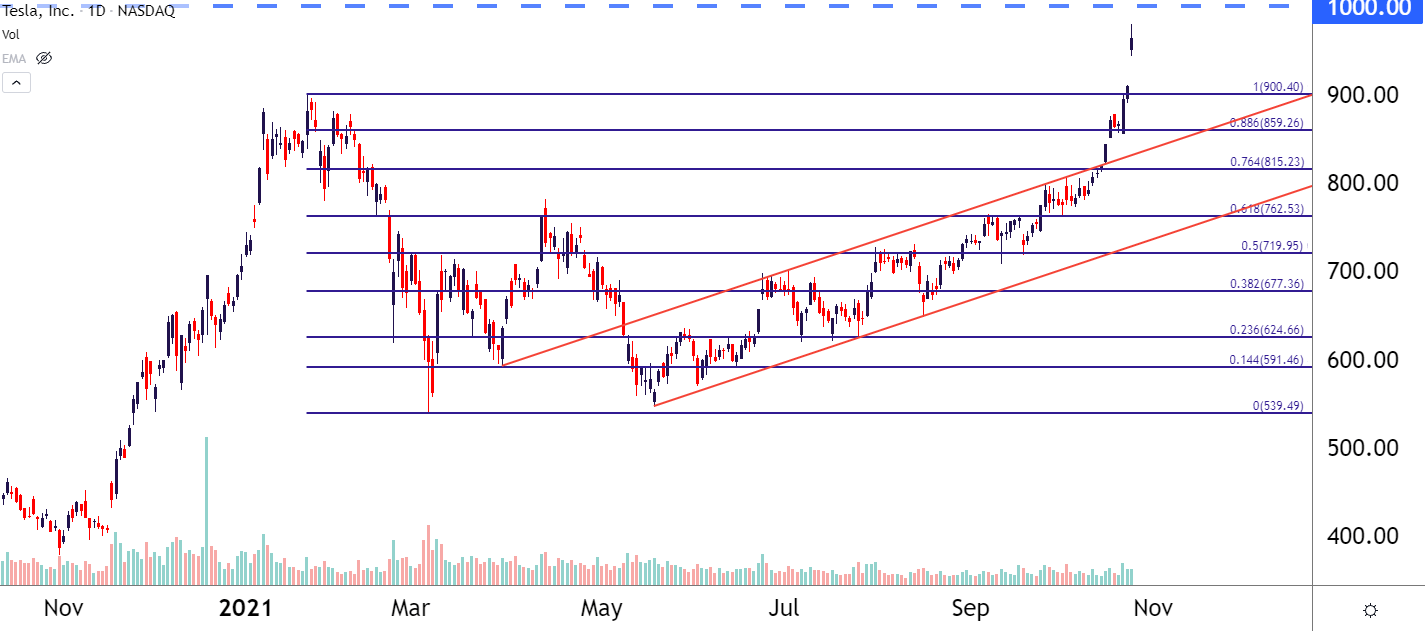
For stocks: We’re in earnings season and last week had a couple of noteworthy items. Tesla reported on Wednesday and beat estimates, but it was the news from this week that’s sent the stock soaring. A report this morning indicates that rental car company Hertz has ordered 100,000 electric vehicles from Tesla. This has sent the stock shooting up to another fresh all-time-high, and there’s been a surge in demand since the open, leading to even higher-highs. The $1,000 level is the next major on the chart, and if that can come into play we’re looking at a 1,326% return from last year’s low. Not bad for a stock that bottomed out around the 70-handle last year.
Tesla (TSLA) Daily Price Chart
Chart prepared by James Stanley; Tesla on Tradingview
S&P Fresh All-Time-High
The S&P 500 set a fresh all-time-high on Friday, running on some considerable exuberance from earnings reports earlier in the week. It wasn’t all rosy everywhere, however, as both Snapchat and Intel warned of supply constraints hitting business operations: For Snapchat, they warned that advertisers were beginning to pullback because of supply-chain issues, while Intel remains mired in the semiconductor shortage that’s been well-known for some time, and they didn’t sound optimistic about that ending anytime soon and both stocks gapped-down on Friday as results.
This led to a stall in the S&P 500 after that fresh all-time-high was hit last Friday: And considering that the index had jumped as much as 6.85% from the October 1st low, it stands to reason that the market was a bit stretched.
With that said, those looking for pullback may be better served elsewhere, such as the rates-vulnerable Nasdaq 100 looked at below.
S&P 500 Daily Price Chart
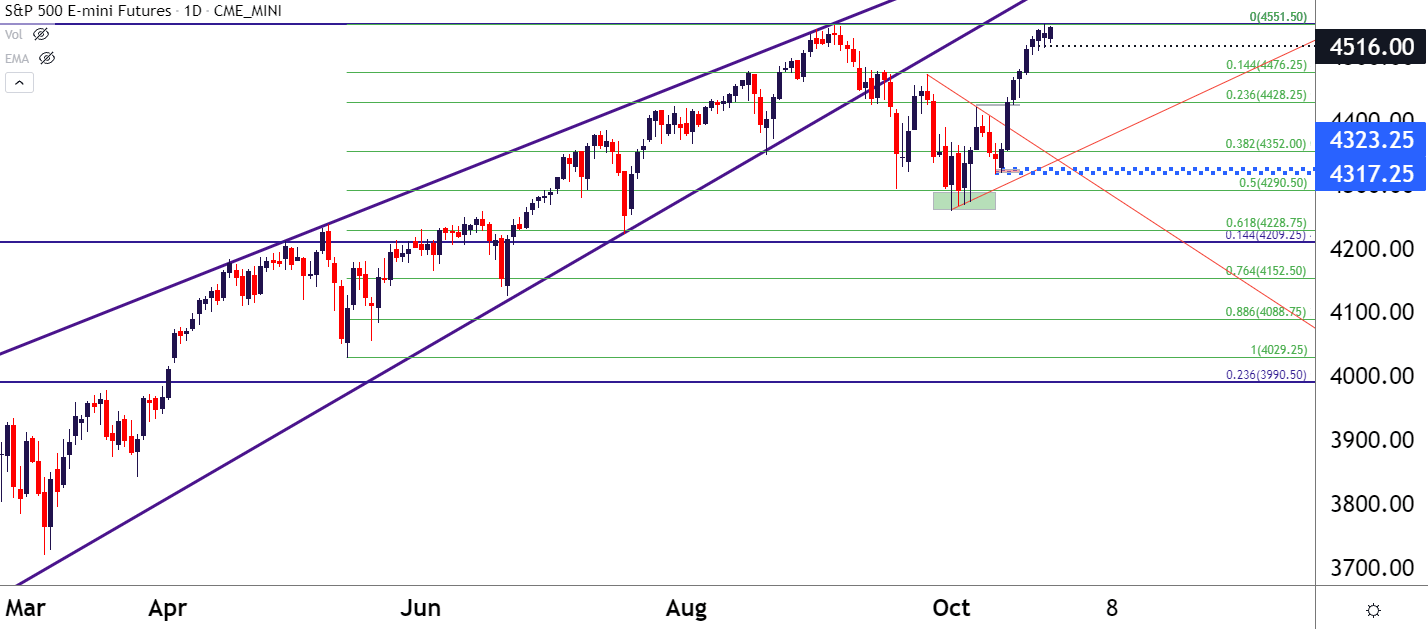
Chart prepared by James Stanley; S&P 500 on Tradingview
Intel, Snapchat Warn of Supply Chain Disruptions
After a really strong first few days in stocks last week, driven by earnings, a couple of announcements later in the week started to get some attention for the warnings that they were sending. Both Snapchat and Intel warned of supply chain disruptions hitting their bottom line. Perhaps for Intel that was somewhat expected, as semis have been constrained for some time now, but from Snapchat, we heard that it’s even starting to hit advertisers now, as advertisers don’t want to pay for ads when they don’t have the supply to support the potential demand.
There’s quite a few tech earnings on the docket for this week, including Google, Apple, Amazon and Facebook.
Last week wasn’t quite as strong in the tech heavy Nasdaq. While the S&P 500 set a fresh ATH, the Nasdaq 100 spent much of the week grinding in a range, which has continued so far through this week’s open. Today’s support is coming in at the 14.4% Fibonacci retracement of the May-September major move while resistance has been showing around the 78.6% marker of the September-October pullback.
To learn more about Fibonacci, check out DailyFX Education
Nasdaq 100 Daily Price Chart
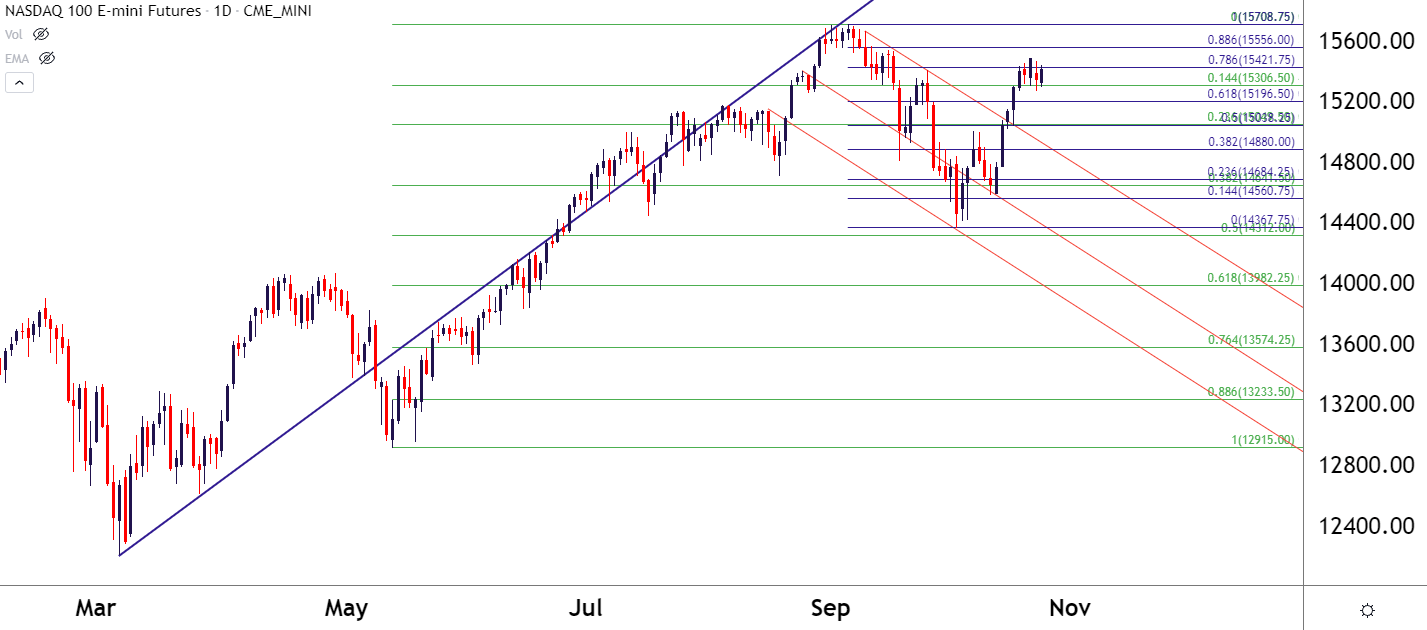
Chart prepared by James Stanley; Nasdaq 100 on Tradingview
A Huge Week for the USD
Not to get lost in the shuffle, it’s a big week for macro markets, as well. Starting tomorrow, there’s high-impact USD data to be released each day this week. The Friday release of PCE should be particularly interesting as this will be the last piece of inflation data that the Fed gets before the November rate decision, at which they’re highly expected to announce a tapering of bond purchases.
At this point, the US Dollar continues to oscillate within the support zone taken from prior resistance. The Greenback is actually negative for the month of October, owed to the sizable breakout that showed up after the Fed’s rate decision in late-September.
US Dollar Daily Price Chart
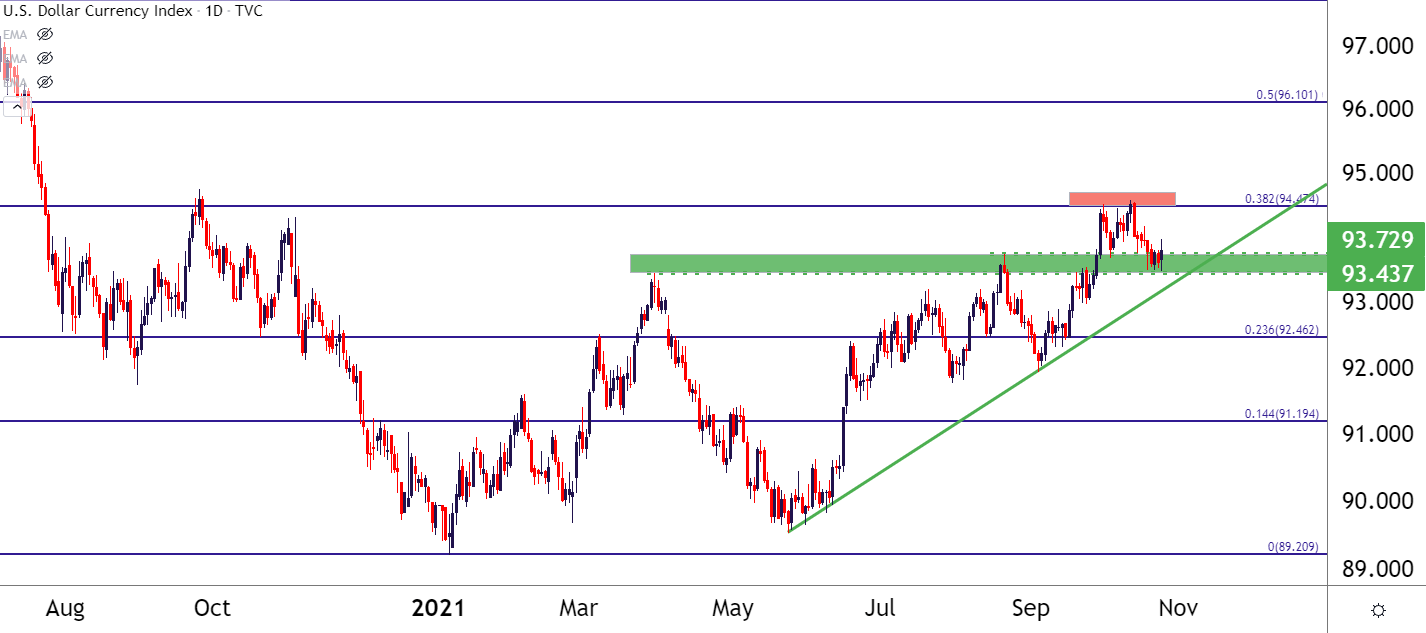
Chart prepared by James Stanley; USD, DXY on Tradingview
— Written by James Stanley, Senior Strategist for DailyFX.com
Contact and follow James on Twitter: @JStanleyFX
Be the first to comment