

JHVEPhoto
Investment thesis
Novo Nordisk (NVO) is an excellently positioned company to profit from a higher global surge in obesity and diabetes rates. In the past, Novo Nordisk had generated excellent results and, therefore, gained accordingly in share price. “Mr. Market” liked the stock so much in the recent past that it is now heavily overvalued compared to its own historical multiples. I maintain that the risk-to-reward ratio is unfavorable right now due to no upside potential according to analysts’ forecasts and a recession that bears multiple compression potentials.
Business
NVO generates most of its sales and profit with GLP-1 and Insulin, both used against diabetes. According to the Centers for Disease Control and Prevention, more than 37 million people in the US already have diabetes, and 96 million people have prediabetes. Diabetes is the 7th highest cause of death in the US. And all that is just in the US alone. NVO has a market share in global diabetes care of 31%, making it one of the market leaders. The sales and profits from diabetes care are destined to grow due to a rise in diabetes patients worldwide. Furthermore, NVO has products for obesity care and rare diseases. Since obesity is a big and further growing problem, as I have already explained in my article about Medifast (MED), NVO can take advantage of a big and growing market. NVO’s obesity care sales are relatively low yet fast-growing with a good amount of further growth potential.
To summarize this, it’s fair to say that NVO is well positioned with market leader share in a big and growing market. Additionally, the obesity care segment is growing fast to secure more diversification in future.
Financials
Since going public, NVO was able to grow its sales by 12.8% and earnings by 16.7% annually. Operating income and free cash flow both grew by 16.6% annually. But free cash flow has declined in the last few years.
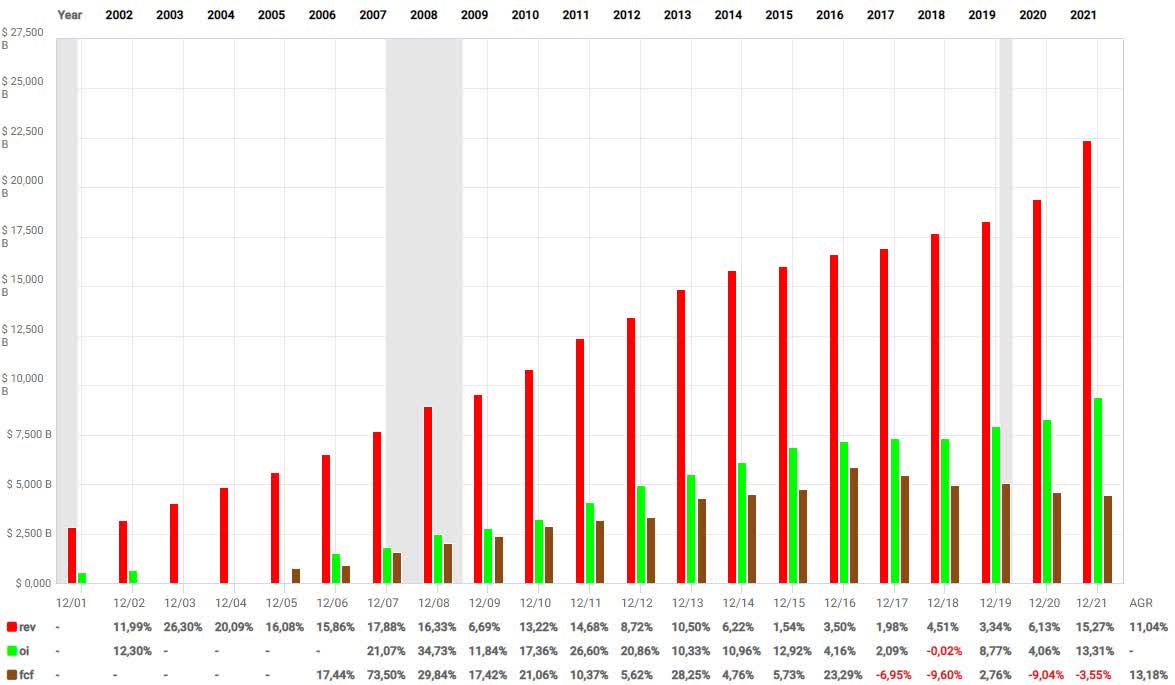
Revenue (red), Operating Income (green), free cash flow (brown) (fastgraphs.com – FUN graphs)
As you can see, free cash flow declined in 2017 for the first time since 2005. Since then, NVO has generated almost 25% less free cash flow. The free cash flow yield of 20% in 2021 is still impressive, so I don’t see a problem here as long as the decline doesn’t accelerate.
Looking at its balance sheet and cash flow statement, we can see that NVO funded all this growth primarily out of its cash flow without loading up big on debt. Novo Nordisk has very low debt compared to its equity and free cash flow.
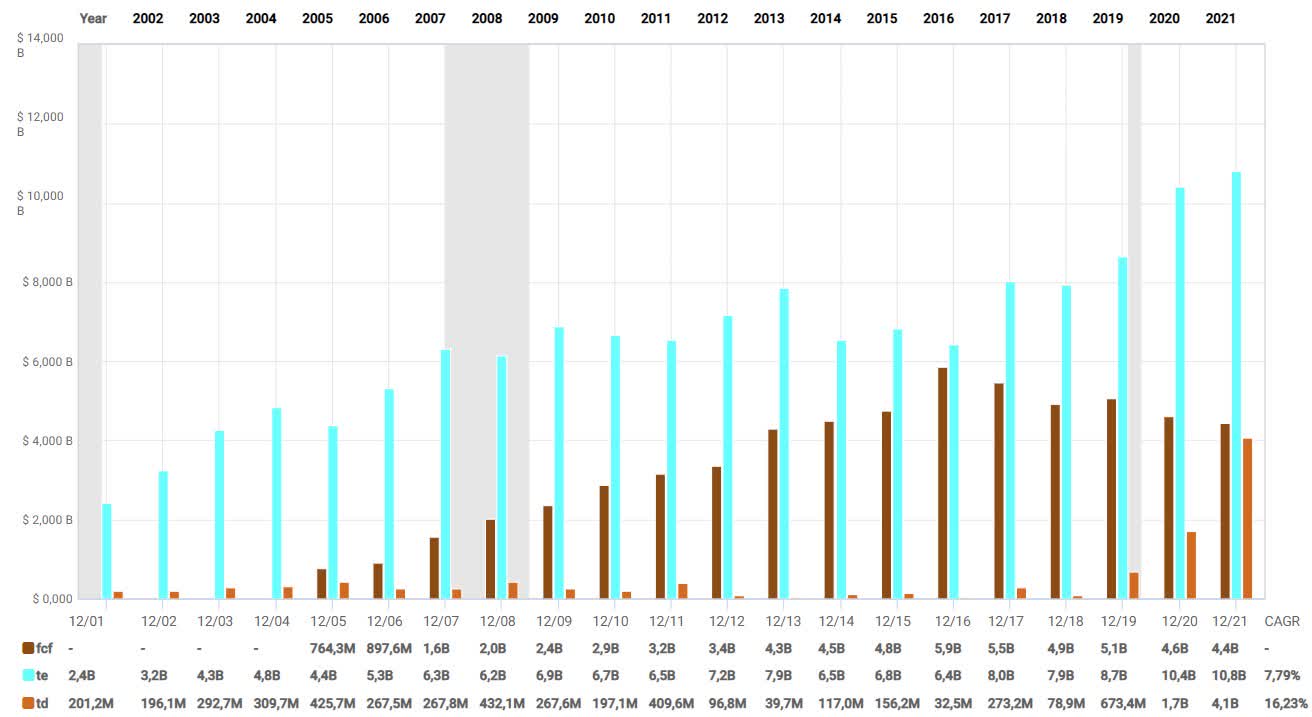
Debt in comparison to equity and fcf (fastgraphs.com – FUN Graphs)
Equity is in blue, free cash flow in dark brown and the total debt in light brown. As you can see, most of the time, NVO had just very little, sometimes no, debt. In the last three years, debt has risen enormously but is still very low, with just $4.07B at the end of 2021. Since Q4 2021, NVO has paid 12% of its debt, lowering it to $3.6B. Its debt-to-equity ratio is just 0.38. Due to NVO’s low debt, its LT debt/LT capital ratio is just 13.31% against an average of 30.57% for its sub-industry. Furthermore, debt is still entirely covered by free cash flow, even though free cash flow has declined since 2016 and debt has risen tremendously. But still, NVO could pay all its debt within one year out of its free cash flow. Short-term debt is covered by cash and cash equivalents, enabling NVO to use all its free cash flow to fund growth, pay back debt, buy back shares, or raise its dividend.
The profitability gives another reason to like NVO. Every profitability margins are above its sub-industry average and the ones of Sanofi (SNY). In the case of its peer Eli Lilly (LLY), NVO is just better in the case of operating and net margin. NVO, LLY and SNY are the three big players in the Insulin industry, so I chose these three to compare.
| NVO | SNY | LLY | |
| Operating Margin | 44.62% | 22.95% | 26.65% |
| Net Margin | 33.81% | 16.48% | 19.71% |
| Return on Invested Capital | 14.92% | 8.09% | 29.18% |
| Return on Employed Capital | 8.48% | 7.40% | 15.82% |
| Return on Assets | 6.19% | 5.32% | 11.7% |
| Return on Equity | 18.20% | 9.44% | 74.52% |
Data is from Seeking Alpha and fastgraphs.com.
The problem
In the introduction, I already talked about valuation. And that is the big problem I see in this stock that causes me to be bearish for the short term.
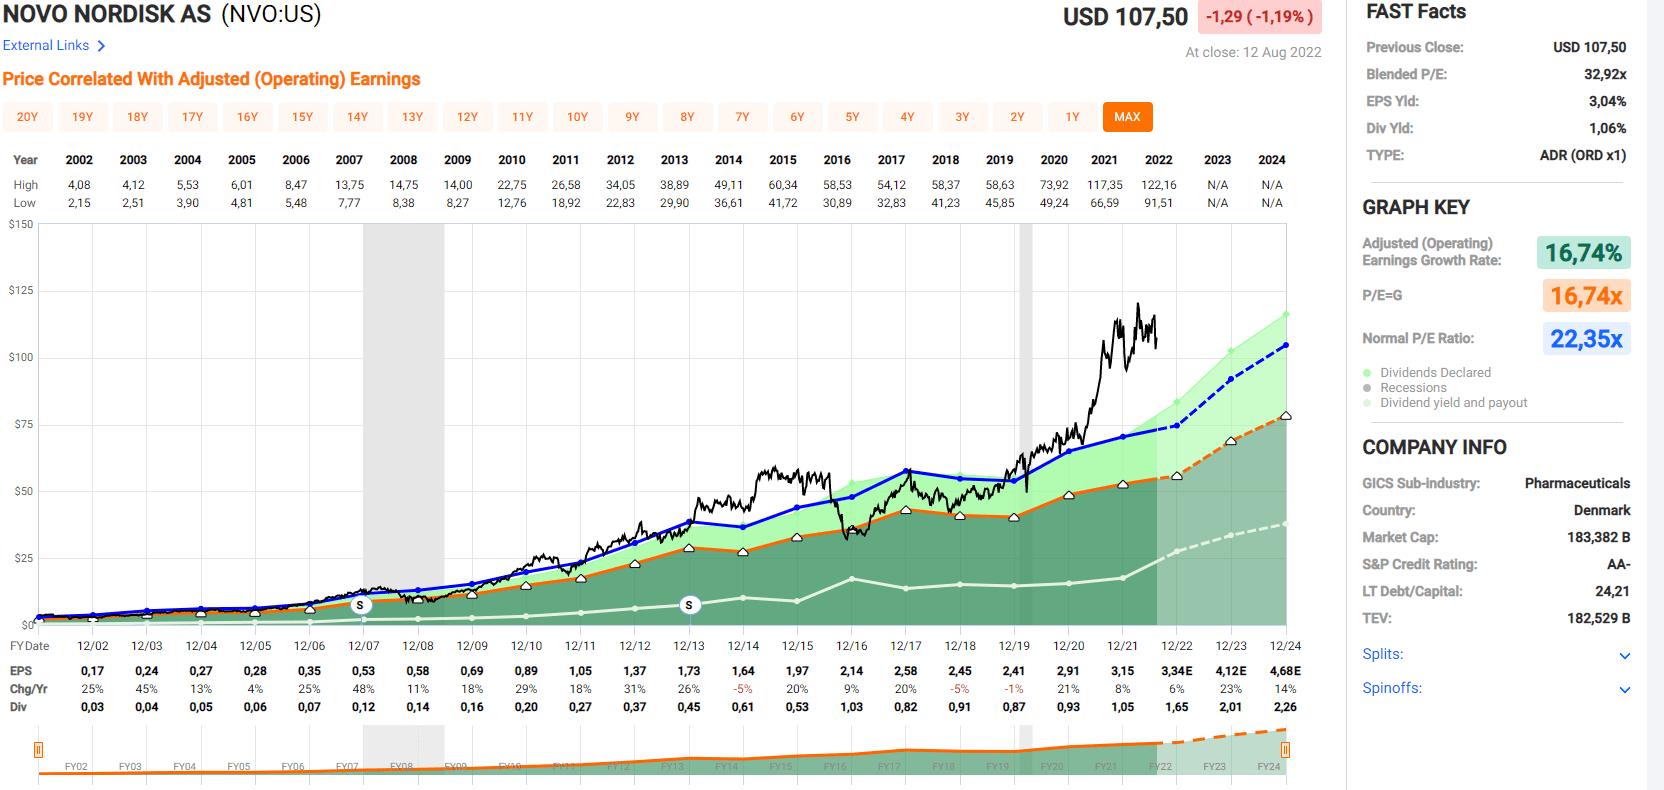
Price in correlation with adjusted earnings (fastgraphs.com)
In this chart, you can see the development of the share price and the adjusted earnings as much as the fair value (in orange) according to P/E=G (a formula by Peter Lynch, see here for an explanation) and the fair value according to its historical P/E ratio (blue). A simple look shows us that NVO is very much above the 16.74x P/E=G ratio and way above its own historical P/E ratio of 22.3. Stocks tend to reverse back to the mean. That is something we can see here when looking at the timeframe 2013-2016. The last time NVO traded for its own historical P/E was in the first half of 2020. Since then, the share price has gained almost 60%, while earnings have just gained around 15%, leading to a wide gap of 47% between fair value (according to earnings) and the share price.
Considering the favorable aspects of NVO’s business and financials, it would be naive to think that NVO should trade for around the P/E=G ratio, which equals its growth rate. The last time NVO traded for that ratio was in 2018. Since then, the insulin market has changed quite a bit, and an insulin franchise is worth even more since the FDA is making it very hard for new market participants to enter that insulin market. I would even say that companies like NVO, SNY, and LLY earn themselves a premium to their fair value just because of that circumstance. But in NVOs (and LLYs) case, the valuation is way beyond fair value, even when giving them a premium on top of that. That leads to more downside potential and fewer chances for shareholder returns in the coming years. As of the time of writing, the stock trades for $107.5, implementing a downside of 30% to its own historical P/E by the end of the year.
To assess if there is any potential for shareholder return in the future, I looked at the fastgraphs forecast chart:
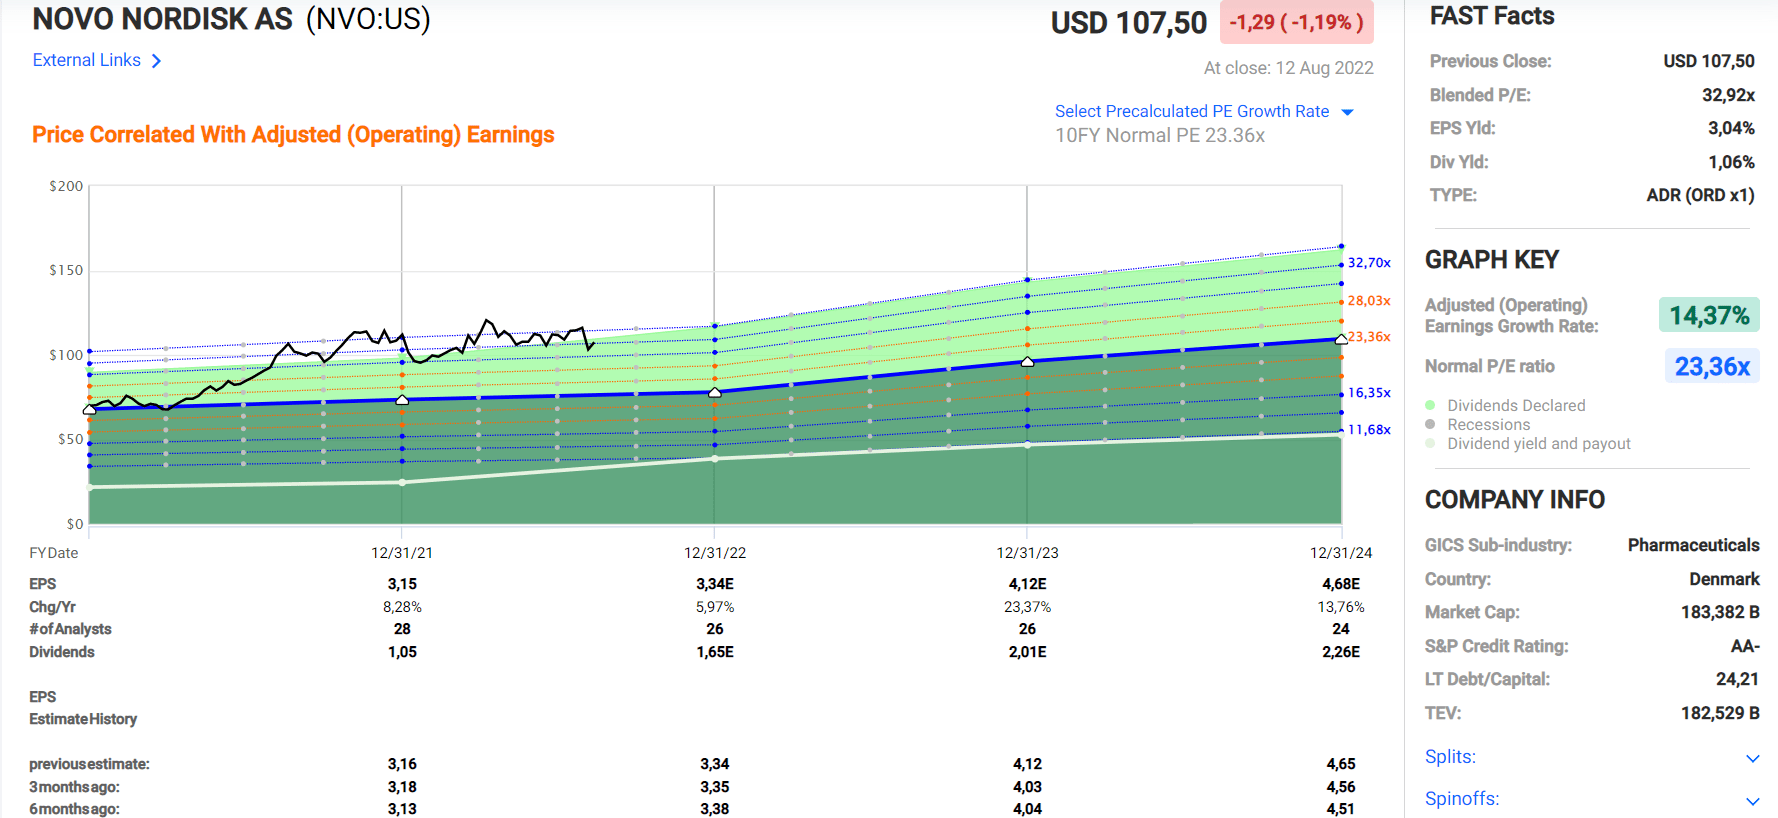
Forecast according to analysts visualized with NVOs historical P/E ratio (fastgraphs.com)
In this chart, you can see that between 24 and 28 analysts expect NVO to grow its earnings by 14.37% annually till the end of 2024. The blue line is NVO’s 10-year historical P/E ratio adapted to the forecasted earnings.
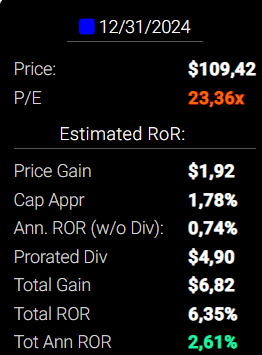
Total return for forecasted earnings growth and historical P/E (fastgraphs.com)
If we assume that NVO reverses back to its historical P/E ratio by the end of 2024, we will get a total return of 6.35% or 2.61% annually. Even though NVO’s dividend yields just 1.06% as of now, most of the 6.35% gain comes from the dividend.
If we take the historical P/E of the last five years, the total return shrinks to 0.2% annually.
While the potential return is relatively low for the next 2.5 years, the downside potential is rather high. Such highly valued stocks tend to be very sensitive to any kind of bad news, sentiment or lack in revenues/earnings, even when it is just minor. We saw this for NVO the day after they reported earnings. The stock fell over 12% due to a small hinge that NVO has production issues with Wegovy, its new obesity care product, which is meant to start in the US this year. So I want to say that several reasons can trigger the reverse back to its historical P/E. It can be due to a postponed start of Wegovy, less than expected growth, a decline in the healthcare sector, or a worsened sentiment in the healthcare sector. The latter is something I see coming in the next month. YTD healthcare stocks have outperformed the broader market due to being known as a safe haven in times of a recession and therefore attracting capital. But this recession-proofness does not mean that healthcare stocks don’t decline in a recession.
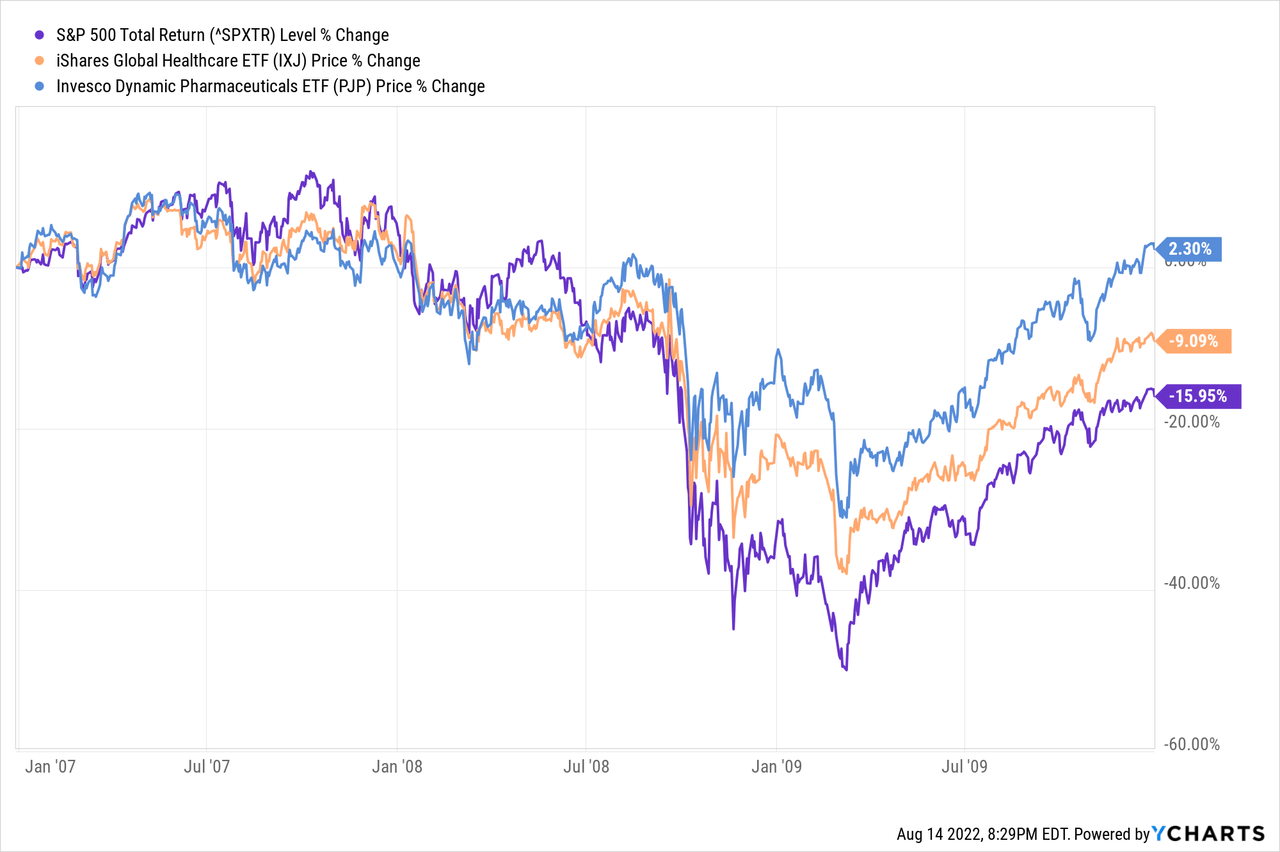
Here you can see the S&P 500 in the Great Recession between 2007 and 2009. Even though the healthcare and pharmaceutical sectors outperformed the broad market, they still declined in the meantime. That was no exception for NVO:
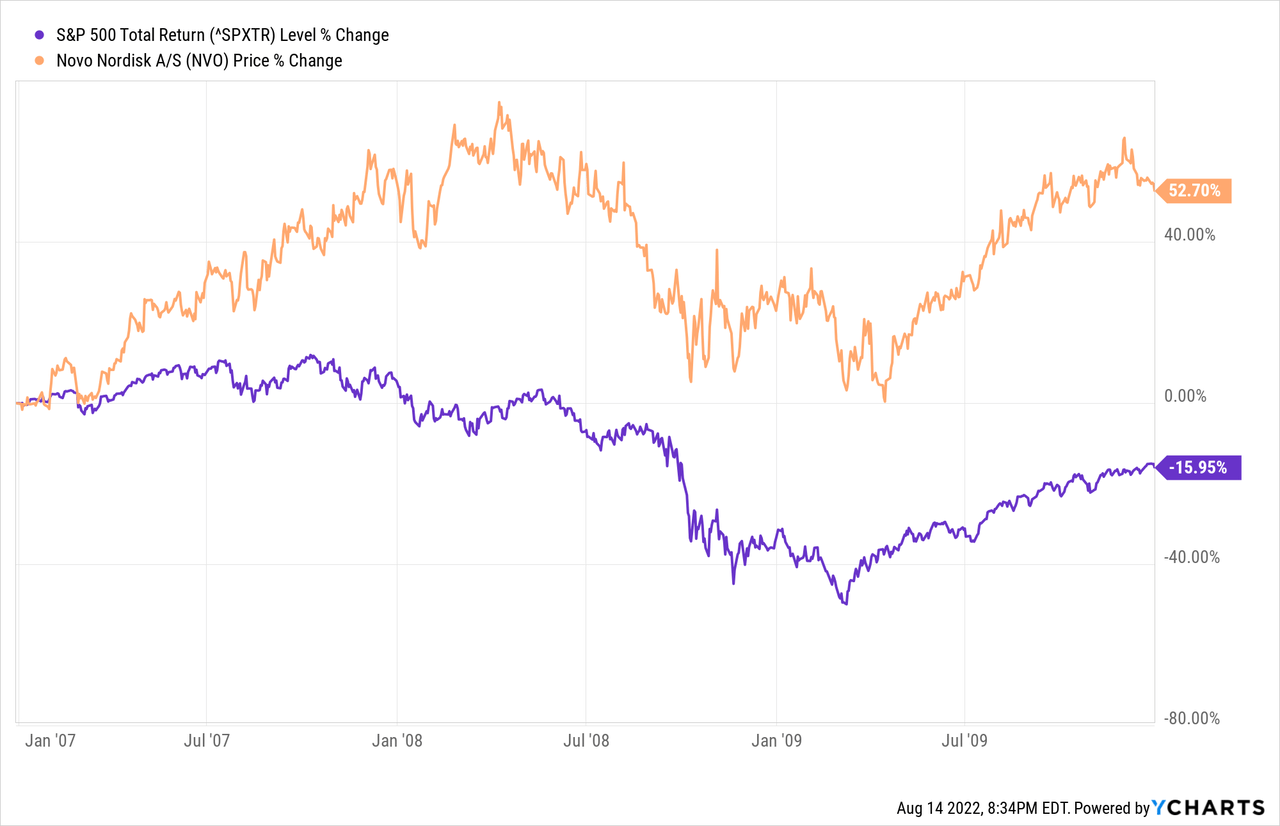
NVO rose about 75%, while the S&P 500 declined over 40%, just to lose all that gain in a 40% decline between 04/2008 and 04/2009. Other than today, NVO was only slightly overvalued according to the P/E=G formula of 22.7 and its historical P/E ratio of 20.28. Nevertheless, NVO dropped to a P/E ratio of 14.3 at the lowest point. Operating and net income declined, too, even though it was not worrying. This time it’s a bit different. NVO hasn’t performed well this year, with a total return of 0.29%, but is outperforming the S&P 500 by 10%. So there are differences, but I can see a decline coming due to overvaluation and a recession that gives reason to reverse back to its mean.
Conclusion
NVO is a well-managed company with exceptional growth, high free cash flow, and industry-beating margins while keeping its balance sheet clean with low debt covered by cash and free cash flow. The diabetes and obesity care market is a big and growing market that is very hard to get a foot in for new market participants, securing the existing players like NVO, LLY and SNY a good sales and earnings opportunity. While that sounds all good, I am still bearish on the short-term due to the overvaluation, which creates a downside of approximately 30% while keeping shareholder returns meager with just 2.61% until 2024.
So I maintain that investors should wait for the stock to decline at least 20% to 30% before investing in it to avoid losses and get a more favorable risk-to-reward ratio.
Editor’s Note: This article discusses one or more securities that do not trade on a major U.S. exchange. Please be aware of the risks associated with these stocks.
Be the first to comment