
andresr
Bear markets are painful in the short term but glorious for long-term investors.
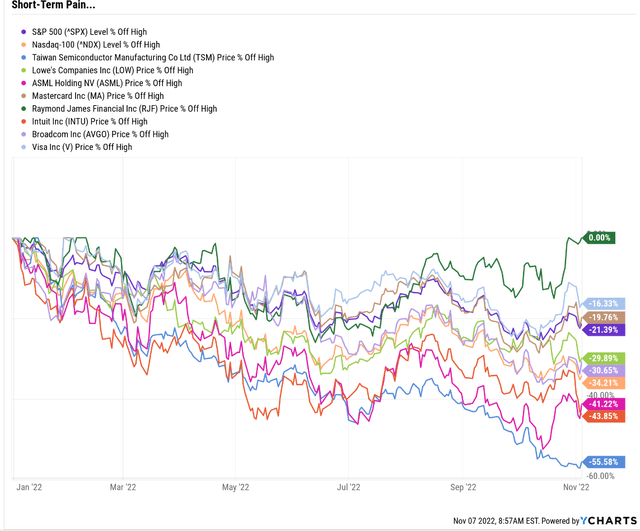
YCharts
While the S&P has only hit a peak decline of 28% so far in this bear market, plenty of world-beater blue chips are down a lot more, including 40% to 60% YTD declines.
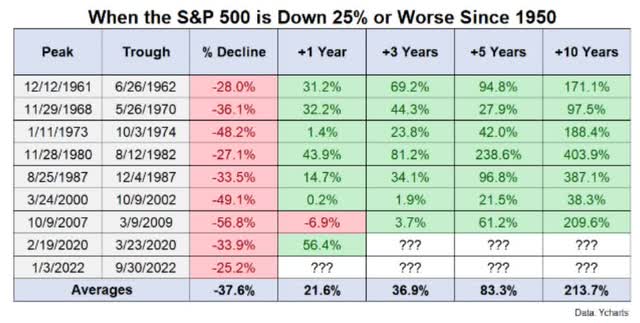
Ben Carlson
Whenever the S&P has fallen 25%, it’s been a wonderful chance for long-term investors to lock in superior long-term returns.
- over the following decade returns are 3% CAGR higher
- 13% annually vs the market’s historical 10% annually
- more than a 3X historically speaking
And this isn’t cherry picking from the market bottom, but merely buying the first time the S&P hits -25%. Usually stocks bottom about 10% to 15% lower, several months later, but the average one year gain is still a Buffett-like 22%.
In other words, market hell is always followed by market heaven as long as your time horizon is 3+ years.
Do you know the best thing about bear markets? They don’t just let you buy wonderful companies at fair prices, but wonderful dividend growth stocks at wonderful prices.
In a normal market you can always find some blue chips that can beat the market by a little over the long term.
But in a bear market you can find Buffett-style world-beaters that can crush the market with 20% or even higher long-term returns.
In other words, bear markets like this one, let you retire in safety and splendor with the world’s safest dividend blue chips.
Let me show you what I mean.
Buy Dividend Hyper-Growth Today For A Potentially Rich Retirement Tomorrow
Hyper-growth dividend stocks are growers, not showers. In exchange for market like yield today, you can compound your very safe and exponentially growing income at a ferocious pace.
- 15% annual dividend growth = 2X in 5 years and 4X in 10 years
- a 2% yield today becomes an 8% yield on cost in a decade
- and over 20 years 16X income growth = 32% yield on cost
- over 30 years 64X income growth = 128% yield on cost
Let me show you how to screen the Dividend Kings Zen Research Terminal, which runs of the DK 500 Master List, to easily find the best dividend aristocrats to buy ahead of the November 8th election.
The Dividend Kings 500 Master List includes some of the world’s best companies, including:
- every dividend champion (25+ year dividend growth streaks, including foreign aristocrats)
- every dividend aristocrat
- every dividend king (50+ year dividend growth streaks)
- every Ultra SWAN (as close to perfect quality companies as exist)
- the 20% highest quality REITs according to iREIT
- 40 of the world’s best growth blue-chips
How To Find The Best Dividend Hypergrowth Blue-Chips In 2 Minutes
| Step | Screening Criteria | Companies Remaining | % Of Master List |
| 1 | Reasonable Buy, Good Buy, Strong Buy, Very Strong Buy, Ultra Value Buy (Never Overpay For Stocks) | 371 | 74.20% |
| 2 | 10+ Quality (Blue-Chip Or Better) | 323 | 64.60% |
| 3 | 0.5+% yield (dividend blue-chips) | 288 | 57.60% |
| 4 | 15+% long-term total return potential | 71 | 14.20% |
| 5 | Add “Long-Term Total Return Potential” Column | 18 | 3.60% |
| 6 | Sort by long-term return potential | 18 | 3.60% |
| 7 | Select the highest total return dividend blue-chips | 8 | 1.60% |
| 8 | Use “Build Your Watchlist” Tool to select your top companies | 8 | 1.60% |
| Total Time | 2 minutes |
(Source: Dividend Kings Zen Research Terminal)
From 500 of the world’s best companies we end up with eight Buffett-style world-beater blue-chips that can deliver 20+% CAGR returns on average, over the long term.
8 Dividend Growth Blue-Chips With 20% Long-Term Return Potential
I’ve linked to articles exploring each company’s investment thesis, risk profile, and growth outlook.
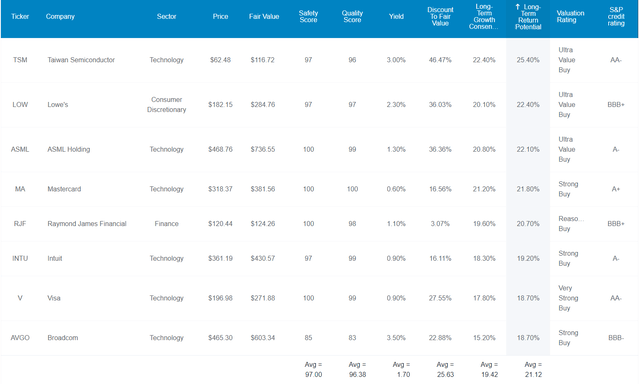
(Source: Dividend Kings Zen Research Terminal)
Here they are in order of highest to lowest long-term consensus total return potential.
Tax Implications
- TSM is a Taiwanese company
- 20% dividend tax withholding
- own in a taxable account to qualify for the tax credit to recoup the withholding
FAST Graphs Up Front
Taiwan Semi 2024 Consensus Total Return Potential
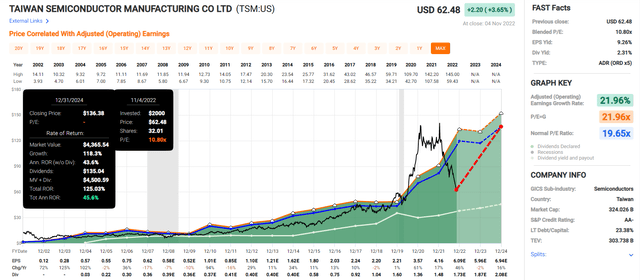
(Source: FAST Graphs, FactSet)
Lowe’s 2025 Consensus Total Return Potential
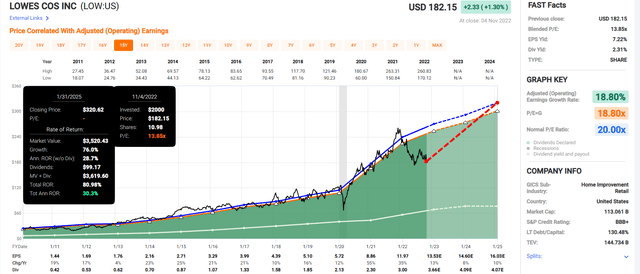
(Source: FAST Graphs, FactSet)
ASML 2024 Consensus Total Return Potential
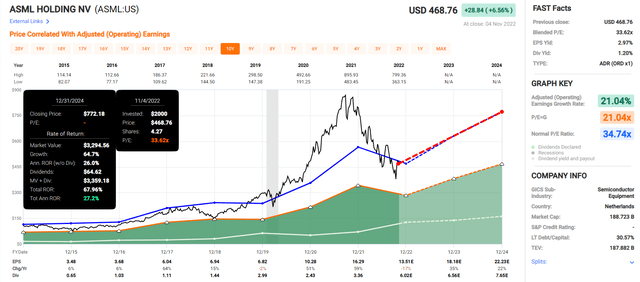
(Source: FAST Graphs, FactSet)
Mastercard 2024 Consensus Total Return Potential
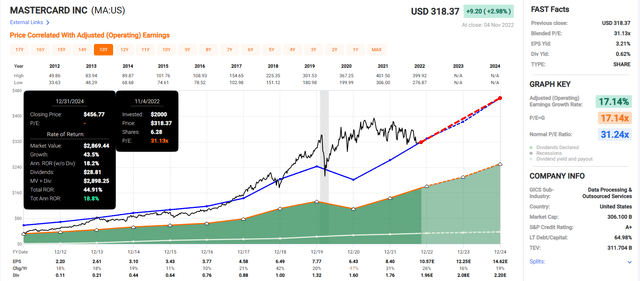
(Source: FAST Graphs, FactSet)
Raymond James 2024 Consensus Total Return Potential
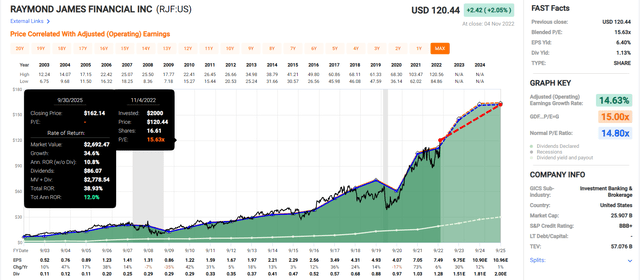
(Source: FAST Graphs, FactSet)
Intuit 2024 Consensus Total Return Potential
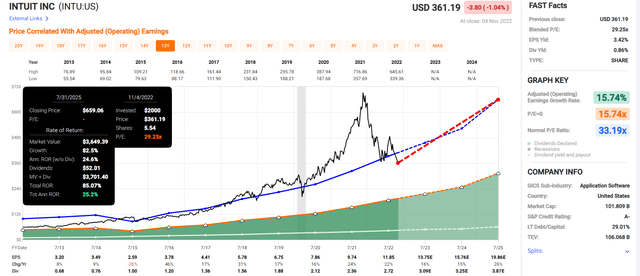
(Source: FAST Graphs, FactSet)
Visa 2024 Consensus Total Return Potential
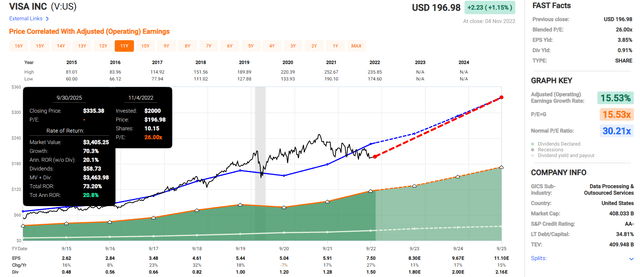
(Source: FAST Graphs, FactSet)
Broadcom 2024 Consensus Total Return Potential
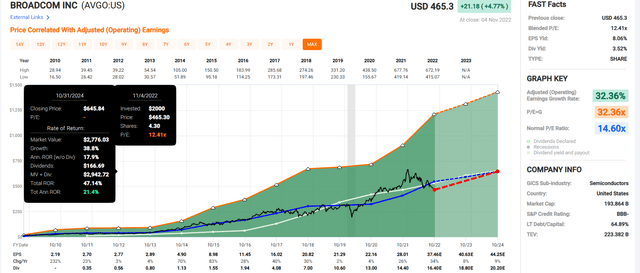
(Source: FAST Graphs, FactSet)
- average 2024 consensus total return potential: 58%
- average 2024 consensus annual total return potential: 25.1% CAGR
Now compare that to the S&P 500, which is 3% historically undervalued.
S&P 2024 Consensus Total Return Potential
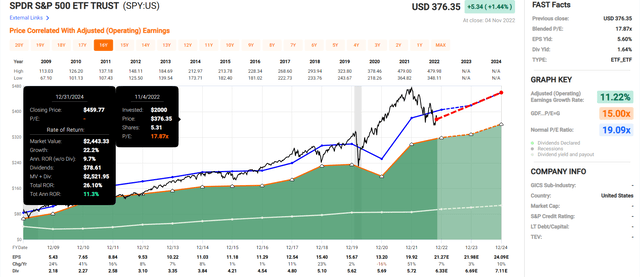
(Source: FAST Graphs, FactSet)
Analysts expect the S&P to deliver about 11% annual returns over the next two years, or 26% in total.
- these eight hyper-growth dividend blue-chips have about 2X the market’s consensus total return potential
But my goal isn’t to help you potentially make 60% over two years, but achieve life-changing long-term income and wealth.
Here’s how they can do that.
Some Of The Best Hyper-Dividend Growth Blue Chips On Earth
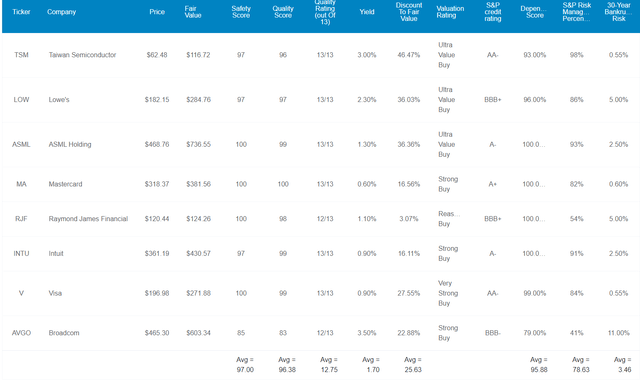
(Source: Dividend Kings Zen Research Terminal)
These aren’t just hyper-dividend growth blue chips they are 12.8/13 Ultra SWAN quality hyper-dividend growth blue chips, as close to perfect quality hyper-dividend compounders as exist on Wall Street. How can we tell? By comparing their fundamentals to the dividend aristocrats, the bluest of blue chips.
Fundamentals 63% Better Than The Dividend Aristocrats
| Metric | Dividend Aristocrats | 8 Hyper-Dividend Growth Blue-Chips |
Compared To Aristocrats |
| Quality | 87% | 96% | 110% |
| Safety | 90% | 97% | 108% |
| Average Recession Dividend Cut Risk | 0.5% | 0.5% | 100% |
| Severe Recession Dividend Cut Risk | 1.50% | 1.15% | 77% |
| Dependability | 84% | 96% | 114% |
| Dividend Growth Streak (Years) | 44.8 | 16.4 | 37% |
| Long-Term Risk Management Industry Percentile | 67% Above-Average, Low Risk | 79%, Good, Bordering On Very Good, Low Risk | 118% |
| Average Credit Rating | A- Stable | A- Stable | NA |
| Average Bankruptcy Risk | 3.04% | 3.46% | 114% |
| Average Return On Capital | 105% | 280% | 267% |
| Average ROC Industry Percentile | 83% | 79% | 95% |
| 13-Year Median ROC | 89% | 220% | 247% |
| Forward PE | 19.5 | 20.7 | 106% |
| Discount To Fair Value | 4% | 26% | 650% |
| DK Rating | Reasonable Buy | Very Strong Buy | NA |
| Yield | 2.6% | 1.7% | 65% |
| LT Growth Consensus | 8.4% | 19.4% | 231% |
| Total Return Potential | 11.0% | 21.1% | 192% |
| Risk-Adjusted Expected Return | 7.5% | 14.1% | 189% |
| Inflation & Risk-Adjusted Expected Return | 5.2% | 11.9% | 226% |
| Conservative Years To Double | 13.7 | 6.1 | 44% |
| Average | 163% |
(Source: Dividend Kings Zen Research Terminal)
These hyper-dividend growth Ultra SWANs (sleep well at night) blue-chips are 63% better than the dividend aristocrats.
Their average risk of a dividend cut in a historically average recession since WWII is 0.5% and their average severe recession risk (Pandemic or Great Recession level downturn) is approximately 1.15%.
- 1 in 200 during an average recession
- 1 in 87 during a severe recession
Their average dividend growth streak is 16.4 years, which while not up to the Ben Graham standard of excellence, is still statistically significant.
- in the Pandemic blue-chips with 12+ year streaks were far less likely to cut their dividends
These blue chips have shown strong commitments to annual dividend growth and if world-beaters like Mastercard and Visa don’t become dividend aristocrats in the future I’ll eat my hat.
Joel Greenblatt considers return on capital or ROC to be his gold standard proxy for quality and management.
- ROC = annual pre-tax profit/the cost of running the business
- S&P 500’s ROC in 2021 was 14.6%
The dividend aristocrats have 105% ROC, or 7X higher than the average S&P 500 company.
These hyper-dividend growth blue chips have 280% ROC or almost 3X higher than the dividend aristocrats and 19X higher than the S&P 500.
According to one of the greatest investors in history (40% CAGR total returns for 21 years) these hyper-dividend growth blue chips are 19X higher quality than the average S&P 500 company.
- S&P 500 is well above average quality by global standards
Their ROC is in the 79th industry percentile, indicating a wide moat.
Their 13-year median ROC is 220% indicating not just stable but potentially improving moats.
S&P estimates their average 30-year bankruptcy risk (the best proxy for Buffett’s fundamental risk) at 3.46%, an average A-stable credit rating.
- approximately 1-in-29 chance of losing all your money buying one of these eight companies
S&P’s average long-term risk management global percentile score is 79%.
DK uses S&P Global’s global long-term risk-management ratings for our risk rating.
- S&P has spent over 20 years perfecting their risk model
- which is based on over 30 major risk categories, over 130 sub categories, and 1,000 individual metrics
- 50% of metrics are industry specific
- this risk rating has been included in every credit rating for decades
The DK risk rating is based on the global percentile of how a company’s risk management compares to 8,000 S&P-rated companies covering 90% of the world’s market cap.
Long-Term Risk Management Is The 150th Best In The Master List (70 Percentile In The Master List)
| Classification | S&P LT Risk-Management Global Percentile |
Risk-Management Interpretation |
Risk-Management Rating |
| BTI, ILMN, SIEGY, SPGI, WM, CI, CSCO, WMB, SAP, CL | 100 | Exceptional (Top 80 companies in the world) | Very Low Risk |
| Strong ESG Stocks | 86 |
Very Good |
Very Low Risk |
| 8 Hyper-Dividend Growth Blue-Chips | 79 |
Good, Bordering On Very Good |
Low Risk, Bordering On Very Low Risk |
| Foreign Dividend Stocks | 77 |
Good, Bordering On Very Good |
Low Risk Bordering On Very Low Risk |
| Ultra SWANs | 74 | Good | Low Risk |
| Dividend Aristocrats | 67 | Above-Average | Low Risk |
| Low Volatility Stocks | 65 | Above-Average | Low Risk |
| Master List average | 61 | Above-Average | Low Risk |
| Dividend Kings | 60 | Above-Average | Low Risk |
| Hyper-Growth stocks | 59 | Average, Bordering On Above-Average | Medium Risk |
| Dividend Champions | 55 | Average | Medium Risk |
| Monthly Dividend Stocks | 41 | Average | Medium Risk |
(Source: DK Research Terminal)
Their risk-management consensus is in the top 30% of the world’s highest quality companies and similar to that of such other blue chips as
- Target (TGT): Ultra SWAN dividend king
- Johnson & Johnson (JNJ): Ultra SWAN dividend king
- Federal Realty Investment Trust (FRT): Ultra SWAN dividend king
- Novo Nordisk (NVO): Ultra SWAN global aristocrat
- Texas Instruments (TXN): Ultra SWAN
OK, so now that you know why these hyper-dividend growth blue chips are great long-term bear market blue-chip bargain buys let’s take a look at why you might want to buy them today.
Wonderful Companies At Wonderful Prices
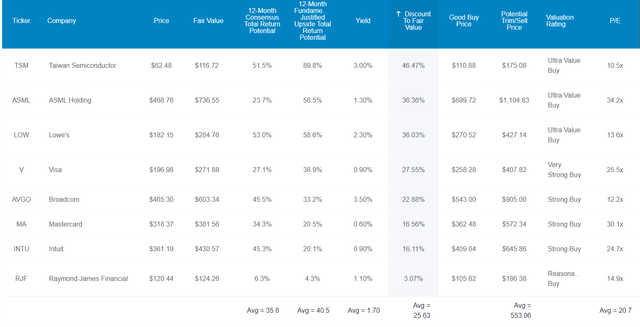
(Source: Dividend Kings Zen Research Terminal)
For context:
- S&P 500 trades at 16.7X forward earnings or a 3% historical discount
- dividend aristocrats trade at 19.5X forward earnings, a 4% historical discount
Remember that according to Joel Greenblatt’s favorite quality metric, ROC, these blue-chips are 19X higher quality than the S&P 500 and 3X higher quality than the dividend aristocrats.
They are also growing more than 2X as fast.
Their average PE is 20.7X, a 26% historical discount.
That’s a PEG ratio of 1.07, hyper-growth Ultra SWAN quality at a reasonable price.
- ROC/PEG is 193% vs 8% for the S&P 500
- 24X better ROC/PEG than the S&P 500
Analysts expect these hyper-dividend growth blue chips to deliver market smashing 36% total returns in just the next 12 months. Their fundamentally justified 12 month total return potential is 41%.
- if they all grow as expected and return to historical-midrange market-determined fair value in the next year, you’ll earn 41%
But my goal isn’t to help you potentially earn 36% or 41% in 12 months, or 60% in two years. I want to potentially help you earn Buffett-like 21% annual returns for decades to come.
- 21% returns for 20 years = 45X return potential
Hyper-Dividend Growth That Could Help You Retire In Safety And Splendor
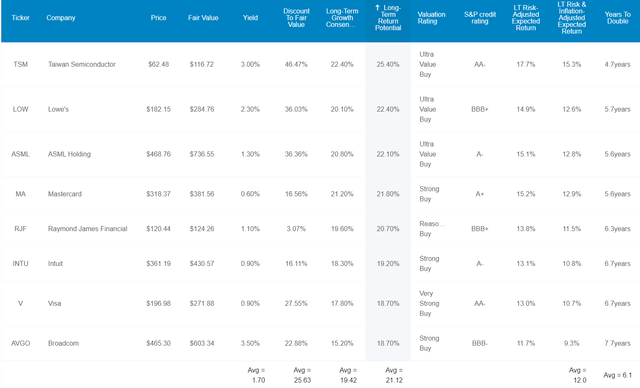
(Source: Dividend Kings Zen Research Terminal)
These hyper-dividend growth Ultra SWANs don’t yield much, 1.7%, basically matching the S&P 500 (but 2.5X more than the Nasdaq). But they’re growing at 19.4% and thus offer 21.1% CAGR long-term return potential.
- Buffett became the greatest long-term investor of all time with 20.5% annual returns over 55 years
How impressive is 21% long-term return potential?
| Investment Strategy | Yield | LT Consensus Growth | LT Consensus Total Return Potential | Long-Term Risk-Adjusted Expected Return | Long-Term Inflation And Risk-Adjusted Expected Returns | Years To Double Your Inflation & Risk-Adjusted Wealth |
10-Year Inflation And Risk-Adjusted Expected Return |
| 8 Hyper-Dividend Growth Ultra SWANs | 1.7% | 19.4% | 21.1% | 14.8% | 12.4% | 5.8 | 3.23 |
| Nasdaq | 0.8% | 11.8% | 12.6% | 8.8% | 6.5% | 11.0 | 1.88 |
| Schwab US Dividend Equity ETF | 3.6% | 8.5% | 12.1% | 8.4% | 6.1% | 11.8 | 1.81 |
| Dividend Aristocrats | 2.6% | 8.5% | 11.1% | 7.8% | 5.4% | 13.2 | 1.70 |
| S&P 500 | 1.8% | 8.5% | 10.3% | 7.2% | 4.9% | 14.8 | 1.61 |
(Sources: DK Research Terminal, FactSet, Morningstar, YCharts)
The Nasdaq is the best dividend growth ETF in history with 18% historical dividend growth and around 13% long-term total returns. That’s similar to what analysts expect in the future.
But these hyper-dividend growth Ultra SWANs are expected to nearly double the long-term returns of the Nasdaq and do even better compared to the S&P, dividend aristocrats, and SCHD, the gold standard of high-yield blue-chip ETFs.
Inflation-Adjusted Consensus Total Return Potential: $1,000 Initial Investment
| Time Frame (Years) | 8.0% CAGR Inflation-Adjusted S&P 500 Consensus | 8.8% Inflation-Adjusted Aristocrat Consensus | 18.8% CAGR Inflation-Adjusted 8 Hyper-Dividend Growth Ultra SWANs Consensus | Difference Between Inflation-Adjusted 8 Hyper-Dividend Growth Ultra SWANs Consensus And S&P Consensus |
| 5 | $1,468.65 | $1,526.66 | $2,363.38 | $894.73 |
| 10 | $2,156.93 | $2,330.70 | $5,585.57 | $3,428.64 |
| 15 | $3,167.77 | $3,558.19 | $13,200.83 | $10,033.07 |
| 20 | $4,652.33 | $5,432.16 | $31,198.60 | $26,546.27 |
| 25 | $6,832.64 | $8,293.08 | $73,734.19 | $66,901.55 |
| 30 | $10,034.74 | $12,660.73 | $174,262.00 | $164,227.26 |
(Source: DK Research Terminal, FactSet)
Ignoring valuation entirely, if these hyper-dividend growth Ultra SWANs grow as expected for just the next decade that’s almost 6X inflation-adjusted returns.
If they can grow as expected for 20 years, that’s a 31X real return (45X not adjusted for inflation).
Over the long-term hyper-dividend growth like this can produce life-changing returns that young people only associate with crypto.
- you don’t need crypto to earn 100X long-term returns you can do it with hyper-dividend growth world-beater blue-chips
| Time Frame (Years) | Ratio Inflation-Adjusted 8 Hyper-Dividend Growth Ultra SWANs Consensus/Aristocrat Consensus | Ratio Inflation-Adjusted 8 Hyper-Dividend Growth Ultra SWANs Consensus vs. S&P consensus |
| 5 | 1.55 | 1.61 |
| 10 | 2.40 | 2.59 |
| 15 | 3.71 | 4.17 |
| 20 | 5.74 | 6.71 |
| 25 | 8.89 | 10.79 |
| 30 | 13.76 | 17.37 |
Source: DK Research Terminal, FactSet)
Over a decade you could potentially nearly 3X the S&P, and that’s ignoring the superior valuations these blue chips offer.
OK, this all sounds amazing but what evidence is there that these hyper-dividend growth blue-chips can actually deliver Buffett-like 20% annual returns as well as the kind of rich retirement income long-term investors crave?
Historical Returns Since 1997 (Annual Rebalancing)
The future doesn’t repeat, but it often rhymes. – Mark Twain
Remember, “past performance is no guarantee of future results.”
But studies show that blue chips with relatively stable fundamentals offer predictable returns based on yield, growth, and valuation mean reversion over time.
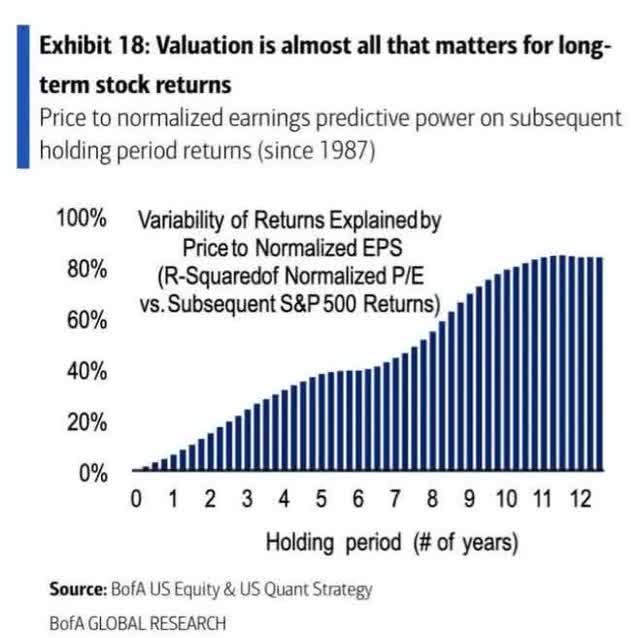
Bank of America
Twenty-five years is a time frame in which 93% of total returns are due to fundamentals, not luck.

(Source: Portfolio Visualizer Premium)
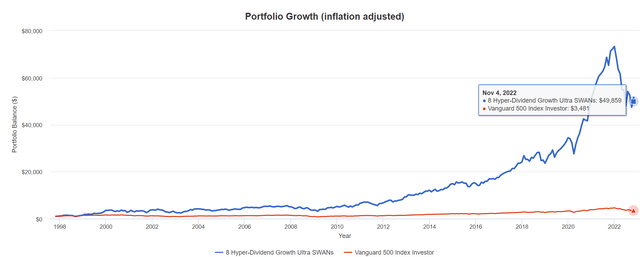
Over the last quarter century these hyper-dividend growth blue-chips have delivered Buffett-like 20% annual returns, and 2X better negative-volatility-adjusted returns than the S&P 500 (Sortino ratio).

(Source: Portfolio Visualizer Premium)
Their average rolling one year return was 23.6% and the average 10 and 15 year return was 17% CAGR.
- Vs. 14.1% CAGR risk-adjusted expected returns in the future
They delivered 50X inflation-adjusted returns even after a major growth stock crash (the reason they are 26% undervalued today).
(Source: Portfolio Visualizer Premium)
- vs 74X inflation-adjusted consensus potential in the future over the next 25 years
- 14X better than the S&P 500 vs 11X consensus in the future
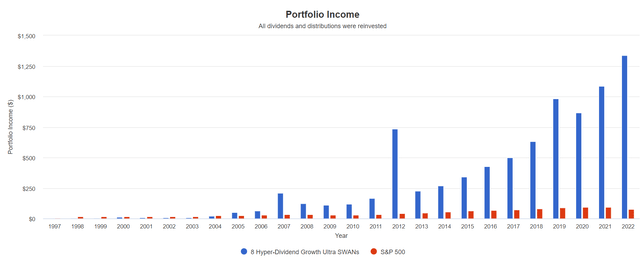
And here’s why income investors should love these hyper-dividend growth blue chips.
Hyper-Dividend Growth That’s The Stuff Rich Retirement Dreams Are Made Of
(Source: Portfolio Visualizer Premium)
The total portfolio income might be somewhat volatile due to the annual rebalancings, but just take a look at that income growth!
Cumulative Dividends Since 1998: $1,000 Initial Investment
| Metric | S&P 500 | 8 Hyper-Dividend Growth Ultra SWANs |
| Total Dividends | $1,157 | $8,777 |
| Total Inflation-Adjusted Dividends | $628.80 | $4,770.11 |
| Annualized Income Growth Rate | 8.0% | 27.8% |
| Total Income/Initial Investment % | 1.16 | 8.78 |
| Inflation-Adjusted Income/Initial Investment % | 0.63 | 4.77 |
| More Inflation-Adjusted Income Than S&P | NA | 7.59 |
| Starting Yield | 1.6% | 0.5% |
| Today’s Annual Dividend Return On Your Starting Investment (Yield On Cost) | 10.1% | 178.7% |
| 2022 Inflation-Adjusted Annual Dividend Return On Your Starting Investment (Inflation-Adjusted Yield On Cost) | 5.5% | 97.1% |
(Source: Portfolio Visualizer Premium)
These hyper-dividend growth Ultra SWANs have grown their income by 28% annually for a quarter century, starting at a 0.5% yield and now achieving a 97% inflation-adjusted yield on cost.
They’ve paid 9X your initial investment in dividends, almost 5X in inflation-adjusted dividends and delivered 8X more income than the S&P 500.
$1 invested into these blue-chips in 1998 (at less than 1/3rd the very safe yield) is now paying almost $1 in annual inflation-adjusted income.
- the power of hyper-dividend growth over the long-term
How To Turn These 8 Hyper-Dividend Growth Blue-Chips Into A Complete Retirement Portfolio
These eight hyper-dividend growth blue-chips are amazing, but even if you have decades left until retirement, buying only eight companies isn’t right for most people.

(Source: Portfolio Visualizer Premium)
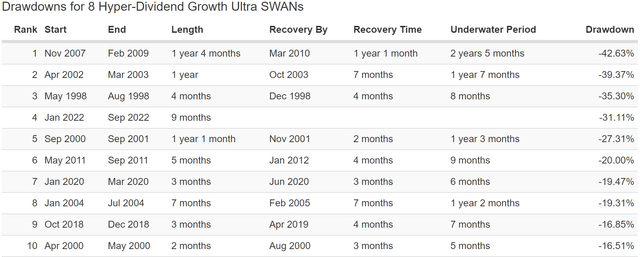
Their volatility can be far too extreme for many investors to handle.
Fortunes are made by buying right and holding on.” – Tom Phelps
If you become a forced seller for emotional or financial reasons then you won’t benefit from the incredible hyper-dividend growth compounding these Ultra SWANs offer.
(Source: Portfolio Visualizer Premium)
While they are down 4% less than the Nasdaq in 2022’s bear market, they have experienced six bear markets and one crash over the last 25 years.
And of course, while 1.7% yield is as good as the S&P 500’s, for many income investors, including retirees, it’s not close to enough.
But look what happens if we turn this into a ZEUS portfolio.
- ZEUS = Zen Extraordinary Ultra SWAN (sleep well at night) portfolio strategy
Here’s how we do that.
- 33% SCHD or VYM (gold standard high-yield blue-chip ETF)
- 16.7% EDV or TLT (long duration US treasury ETF)
- 16.7% DBMF, GIFMX, PQTAX, or AMFAX (managed futures)
- 33% into these eight hyper-dividend growth Ultra SWANs (4.2% each)
What kind of portfolio is this?
| Metric | 60/40 | ZEUS Hyper-Dividend Growth | X Better Than 60/40 |
| Yield | 2.25% | 4.0% | 1.78 |
| Growth Consensus | 5.1% | 9.3% | 1.82 |
| LT Consensus Total Return Potential | 7.4% | 13.3% | 1.81 |
| Risk-Adjusted Expected Return | 5.1% | 9.3% | 1.81 |
| Safe Withdrawal Rate (Risk And Inflation-Adjusted Expected Returns) | 2.9% | 7.0% | 2.45 |
| Conservative Time To Double (Years) | 25.0 | 10.2 | 2.45 |
(Source: Portfolio Visualizer Premium)
It’s a balanced portfolio just like a 60/40. Except with almost 2X higher safe yield and almost 2X the consensus long-term return potential resulting in 2.5X higher safe withdrawal rates.
In fact, 13.3% CAGR is higher long-term return potential than the S&P, dividend aristocrats, SCHD, and even the Nasdaq.
- higher return potential than the Nasdaq but with 5X the yield
- and 2/3rd less volatility
Historical Returns Since December 2007

(Source: Portfolio Visualizer Premium)
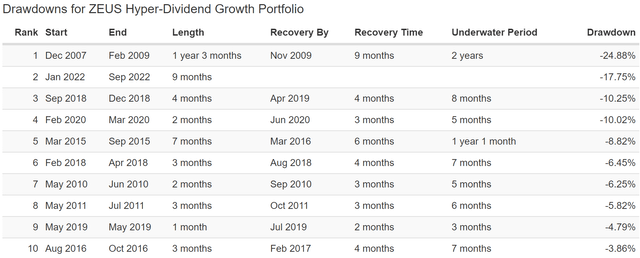
Fourteen years of 11.2% CAGR returns that’s 2.5X more than a 60/40 but with less annual volatility than a 60/40 and with a peak decline of just 25% during the Great Recession.
- 2X the negative-volatility-adjusted returns of the 60/40 and 2X more than the S&P 500
- ZEUS outperformed the S&P 500 just as it’s expected to in the future
- but with much higher yield and 40% less annual volatility
- and a 50% smaller peak decline during the 2nd worst market crash in US history

(Source: Portfolio Visualizer Premium)
A 10% peak decline during the Pandemic crash, 50% less than the S&P 500 and 25% less than a 60/40.
(Source: Portfolio Visualizer Premium)
An 18% peak decline in the 2022 stagflation bear market compared to:
- Nasdaq -35%
- 8 Hyper-Dividend Growth Ultra SWANs: -31%
- S&P -28%
- 60/40 -21%
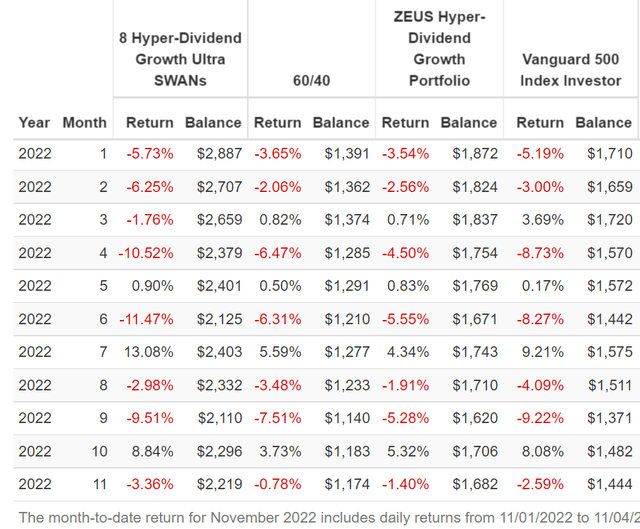
ZEUS During The 2022 Stagflation Bear Market
(Source: Portfolio Visualizer Premium)
In the 2022 stagflation bear market we’ve seen three monthly crashes of 8+%.
ZEUS’s largest monthly decline is 5.6%, and it fell 5.3% in September when the hyper-dividend growth blue chips fell 10% and the S&P 9.2% and a 60/40 7.5%.
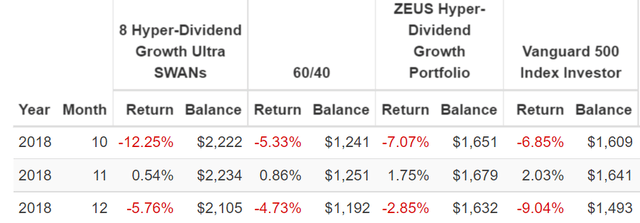
ZEUS During The 2018 Bear Market
(Source: Portfolio Visualizer Premium)
On Dec. 24, 2018 the S&P hit -21% intraday including a 17% plunge in the final three weeks. During December it fell 9% while ZEUS fell just 3%.
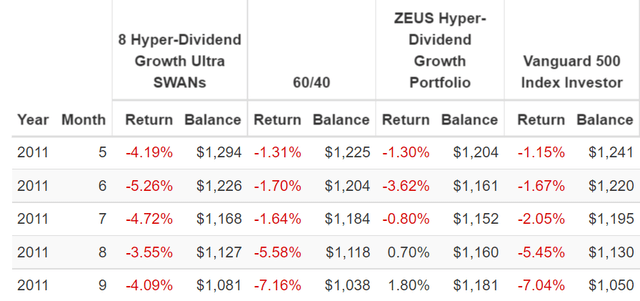
ZEUS During The 2011 Bear Market
(Source: Portfolio Visualizer Premium)
During the 2011 bear market the S&P hit an intraday low of -22%, including a 7% decline in September.
ZEUS fell just 3.2% in this bear market including rising 2.5% in August and September when the market fell 12%.
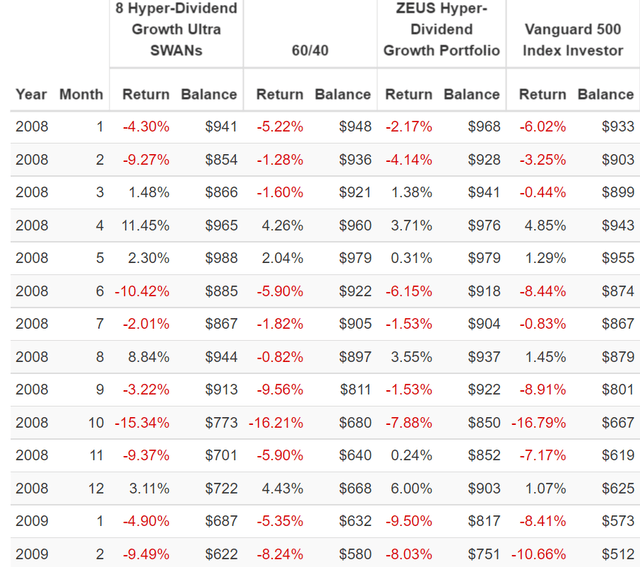
ZEUS During The Great Recession
(Source: Portfolio Visualizer Premium)
In the Great Recession when the 60/40 fell just 20% less than the S&P 500 ZEUS fell 50% less.
And in October 2008, when the market fell 17% a 60/40 fell 16%, and the hyper-dividend growth blue-chips fell 15%.
- no place to hide... except in ZEUS, which fell 8%, or half as much as the S&P 500
Higher yield, better returns, less volatility, and half the peak declines of the market and about 33% less than a 60/40.
That’s the power of a diversified and prudently risk-managed long-term recession optimized portfolio.
That’s the power of ZEUS, the king of sleep well at night portfolio.
- like riding over the market’s largest potholes in a Rolls Royce
Bottom Line: Buy These 8 Hyper-Dividend Growth Blue-Chips Today For A Potentially Rich Retirement Tomorrow
Let me be clear: I’m NOT calling the bottom in these blue chips (I’m not a market timer).
Sleep Well At Night doesn’t mean “can’t fall hard in a bear market.”
Fundamentals are all that determine safety and quality, and my recommendations.
- over 30+ years, 97% of stock returns are a function of pure fundamentals, not luck
- in the short term; luck is 25X as powerful as fundamentals
- in the long term, fundamentals are 33X as powerful as luck
While I can’t predict the market in the short term, here’s what I can tell you about TSM, LOW, ASML, MA, RJF, INTU, AVGO, and V.
- 1.7% very safe yield growing at over 20% per year
- A- stable average credit rating
- 19X higher quality (return on capital) than the S&P 500
- 19.4% CAGR long-term growth consensus
- 21.1% CAGR long-term return potential (similar to the last 25 years)
- 28% annual income growth over the last 25 years (8X more income than the S&P 500)
- 100% inflation-adjusted yield on cost after 25 years of hyper-dividend compounding
If you’re looking for Buffett-like returns from the world’s best blue-chips consider these hyper-dividend growth Ultra SWANs.
If you’re looking to turbocharge your retirement portfolio so you can sleep well at night in even the most extreme market crashes and enjoy superior quality and dividend growth, consider adding these hyper-dividend growth Ultra SWANs to your balanced portfolio.
- 2X the yield of a 60/40
- better returns than the S&P 500
- half the peak declines of the S&P during even the most extreme market crashes
- 40% less volatility than the S&P 500
If you’re looking to profit from some of the best blue-chip buying opportunities on the world’s best dividend growth stocks, these eight might be just what you’re after.
If you are tired of praying for luck on Wall Street and want to make your own luck, these are the kinds of dividend growth powerhouses you should be buying in this bear market.


Be the first to comment