

Liudmila Chernetska/iStock via Getty Images
Stock crashes in a bear market are something to be expected.
That’s especially true this year.
It’s the 2nd worst start to the year in US market history, with the S&P 500 down 21%, the Nasdaq down 29%.
The worst bond bear market in history, by a wide margin, means the 60/40 retirement portfolio is down 18%.
And according to Lipper Financial, 11% of US stocks are down 80+%.
What does this mean for short-term paper wealth?
- $10 trillion in US market cap gone
- vs $8.5 trillion in the entire Great Recession, the 2nd worst market crash in history
Well, guess what? One of my favorite ultra-high-yielding blue-chips just went on sale.
Ycharts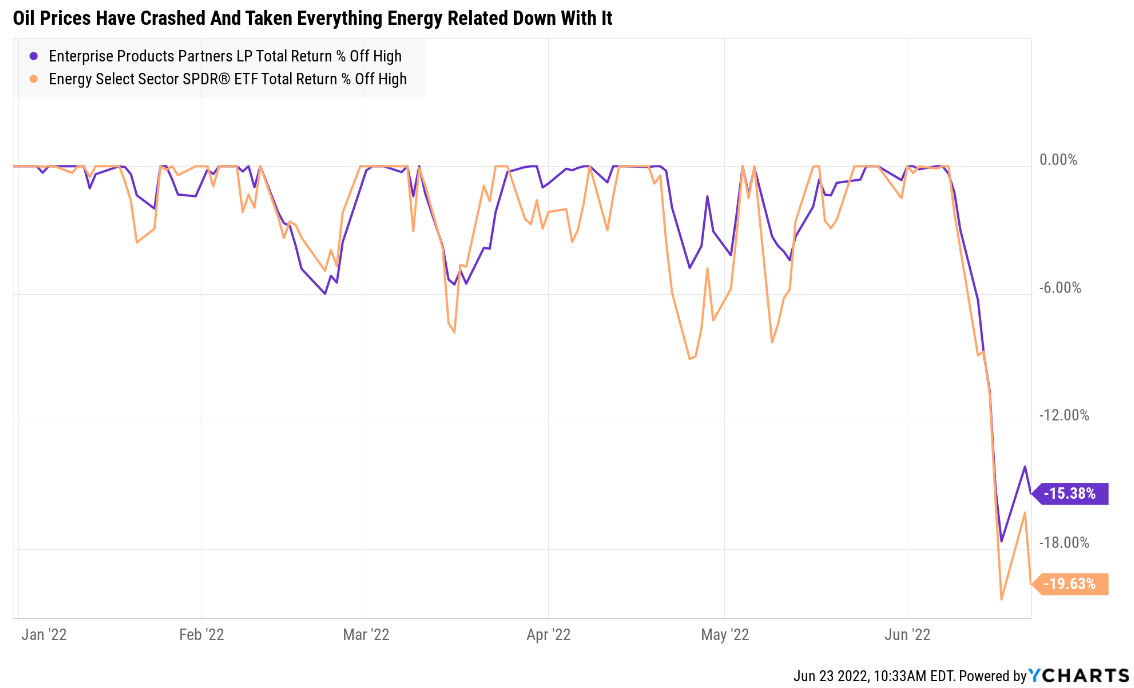
I actually just warned about this kind of thing happening.
While Goldman Sachs thinks oil will be $130 a year from now, and several other economists think it could stay above $100 for several years longer, over the long-term the oil futures market thinks oil is going to average $65.
Oil producers have no protection against major price collapses if crude gets cut in half.
Midstream blue-chips on the other hand? Well, their cash flow is far more stable.
- 84% of EPD’s cash flow has zero impact from crude prices
- confirmed in the pandemic when oil hit -$38
- 75% of the sensitive cash flow is hedged
So let me show you the four reasons why Enterprise Products (NYSE:EPD)’s 15% one-week crash is absolutely not justified by its fundamentals.
In fact, 8.1% yielding EPD represents a rich retirement dream stock with one of the safest ultra-high yields on Wall Street.
Do you want to retire in safety and splendor? Here’s how Enterprise can help.
Reason One: Enterprise Is The Complete Rich Retirement Package
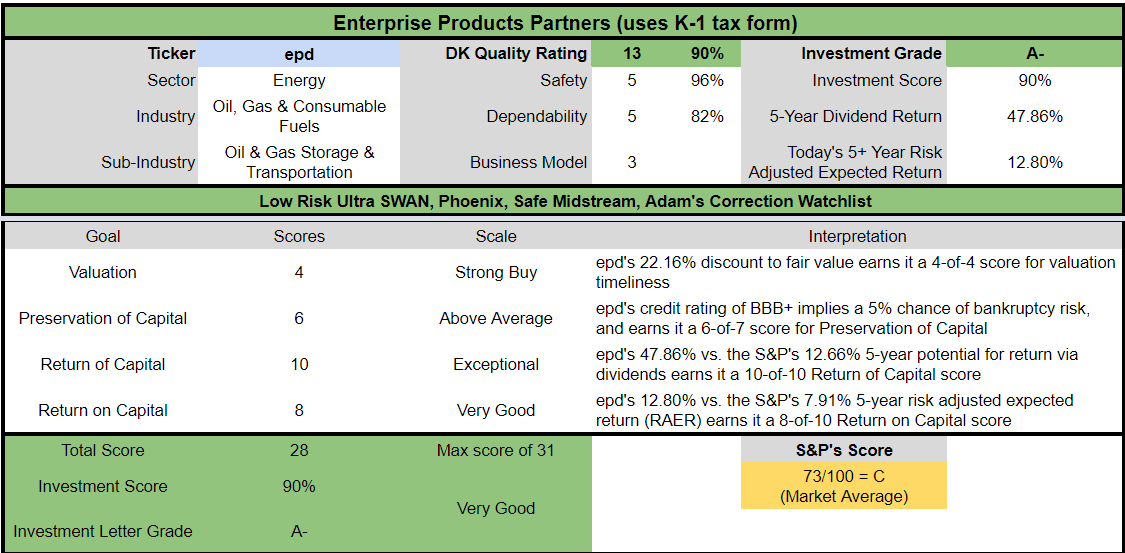
Here is the bottom line up front on EPD.
A deep dive into the tax complexity of MLPs.
- some tax proposals call for taxing LPs as corporations
- analysts think these have a small chance of actually passing
- and if they did high depreciation for MLPs would likely result in very modest tax bills that would not threaten the safety of very well-covered blue-chip distributions
- Foreign withholding tax rate of 37% and whether or not you can recoup it via tax credits depends on your country’s tax treaty with the U.S.
Reasons To Potentially Buy EPD Today
- 90% quality low-risk 13/13 Ultra SWAN midstream
- highest quality midstream
- 96% dividend safety score
- 23-year dividend growth streak
- 7.9% very safe yield
- 0.5% average recession dividend cut risk
- 1.2% severe recession dividend cut risk
- 24% conservatively undervalued (potential strong buy)
- Fair Value: $30.88 (8.65)
- 6.6X forward cash flow vs 10X to 12X historical
- BBB+ stable outlook credit rating = 5% 30-year bankruptcy risk
- 67th industry percentile risk management consensus = Above-Average
- 2% to 13% CAGR margin-of-error growth consensus range
- 4.4% CAGR median growth consensus
- 5-year consensus total return potential: 15% to 21% CAGR
- base-case 5-year consensus return potential: 18% CAGR (2.5X S&P consensus)
- consensus 12-month total return forecast: 40% (highly reasonable, 8.6X cash flow)
- Fundamentally Justified 12-Month Returns: 40% CAGR
Ycharts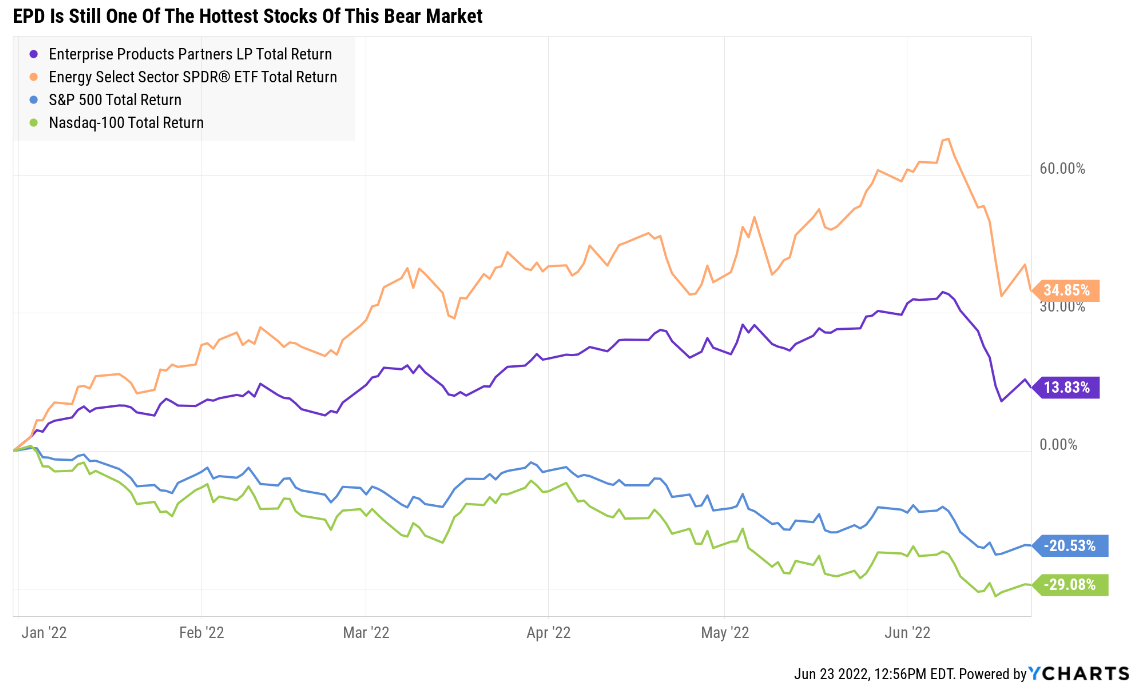
Last week, energy stocks fell 18% and EPD also fell significantly, but for no good reason.
- oil fell as much as 7% in a single day last week
- rising recession fears
- Profit From Soaring Oil Prices With These 6+% Yielding Blue-Chips
- this article explains why long-term oil prices are expected to be $65 and midstream is the best way to protect yourself from the inevitable crash coming from energy stocks when oil prices crash next
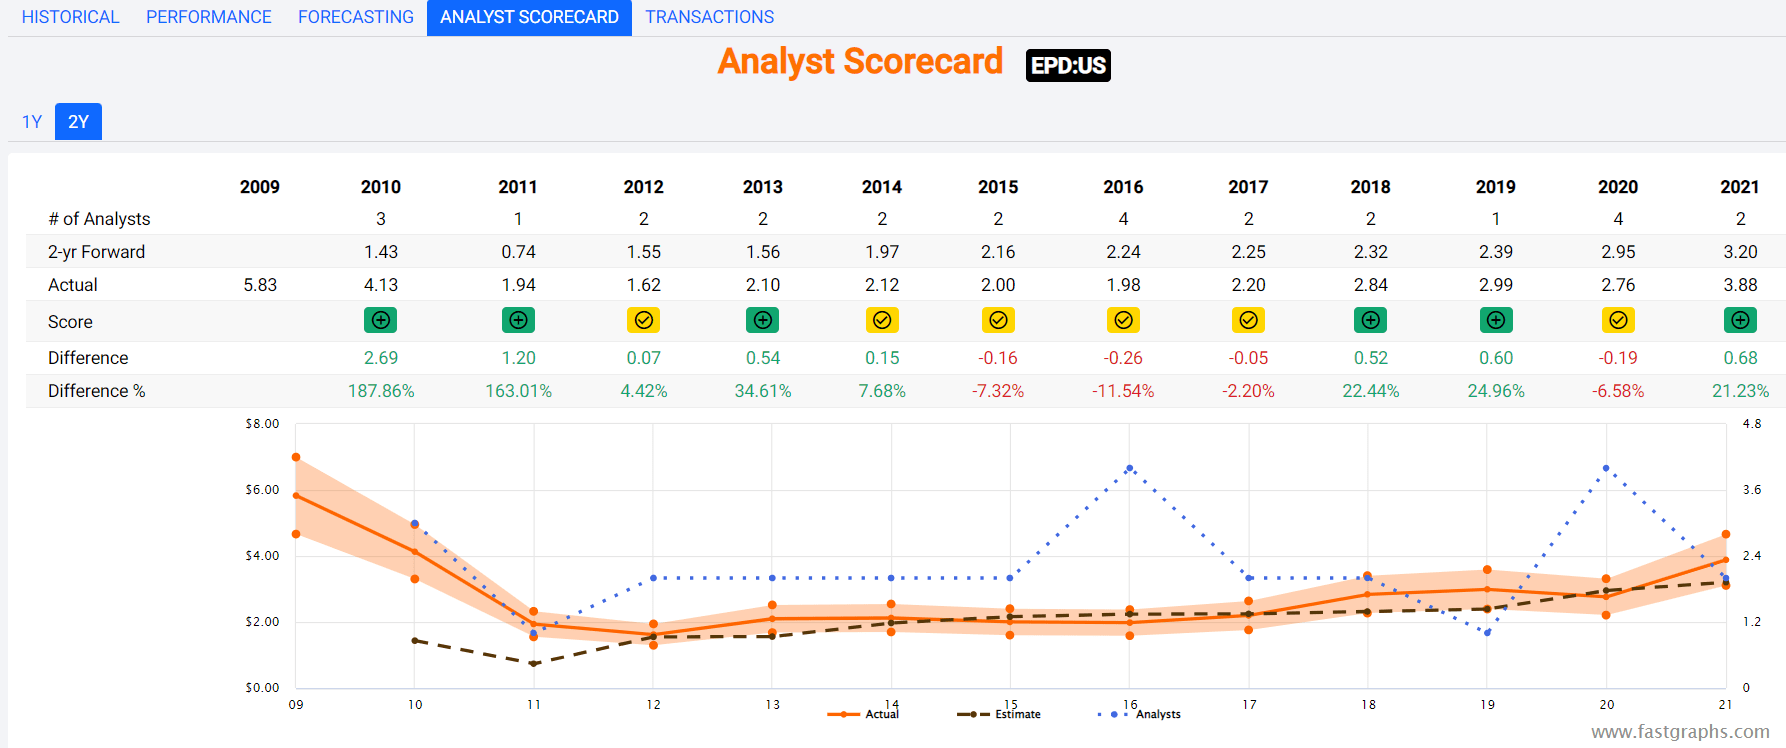
EPD Long-Term Growth Outlook Is Intact
| Metric | 2021 Growth Consensus | 2022 Growth Consensus | 2023 Growth Consensus | 2024 Growth Consensus | 2025 Growth Consensus | 2026 Growth Consensus |
2027 Growth Consensus |
| Sales | 56% | 17% | 1% | -1% | NA | NA | NA |
| Distribution | 2% | 3% | 4% | 3% | 3% | 3% | 3% |
| Operating Cash Flow | 41% | -8% | 0% | 5% | NA | NA | NA |
| Distributable Cash Flow | 3% | 10% | 4% | 4% | 3% | 7% | 6% |
| EBITDA | 19% | 7% | 2% | 2% | NA | NA | NA |
| EBIT (operating income) | 31% | 5% | 2% | 2% | NA | NA | NA |
(Source: FAST Graphs, FactSet)
EPD’s energy utility growth prospects remain fairly intact.
- 2022 estimates have increased in recent weeks
Rolling Returns Since August 1998
(Source: Portfolio Visualizer Premium)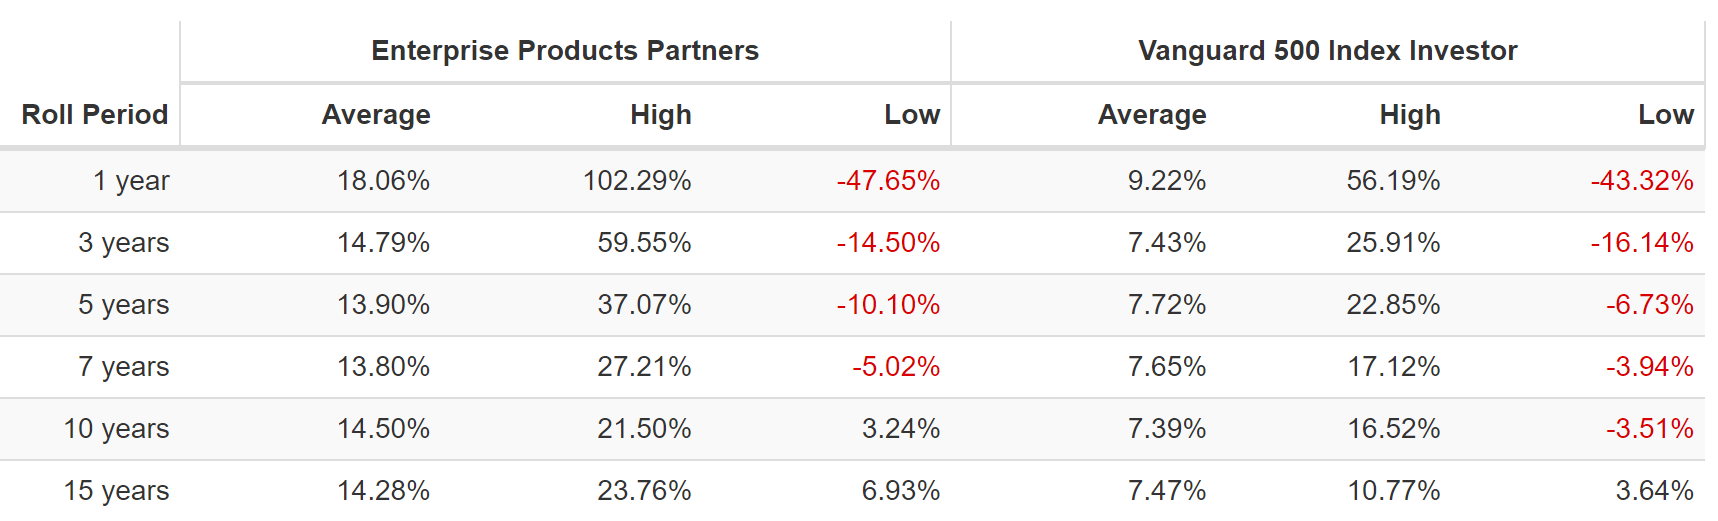
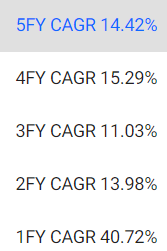
EPD is a consistent market beater over the last 24 years but from bear market lows it’s capable of returns as strong as 24% per year for the next 15 years.
EPD 2024 Consensus Total Return Potential
(Source: FAST Graphs, FactSet) (Source: FAST Graphs, FactSet)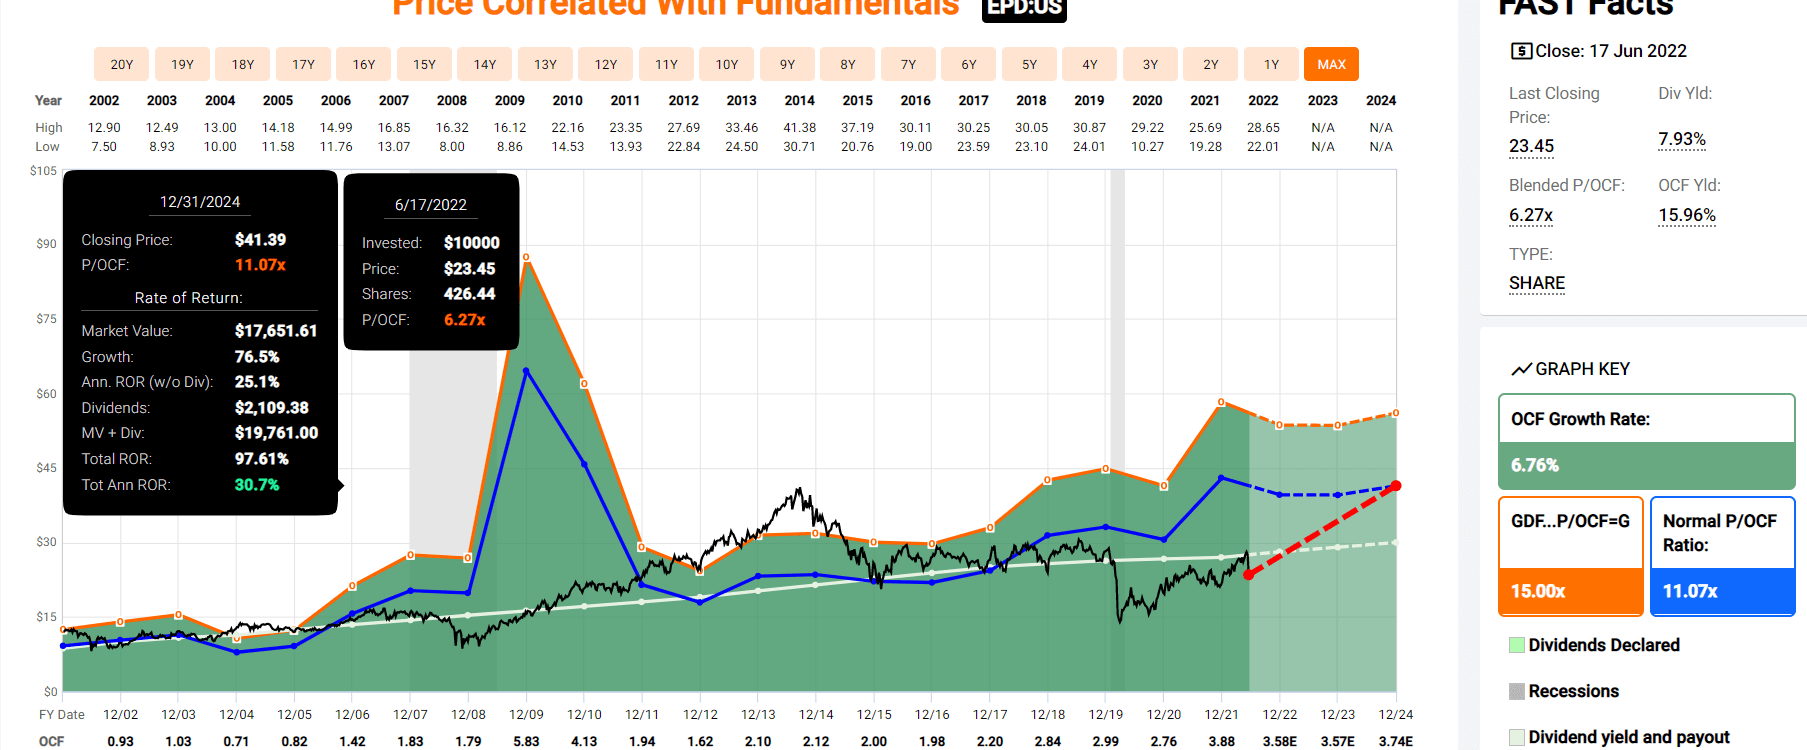
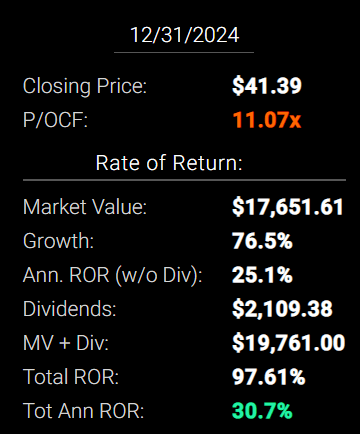
If EPD grows as analysts expect by 2024 and returns to historical mid-range fair value it could deliver 98% total returns or 31% annually.
- Buffett-like returns from an anti-bubble blue-chip bargain hiding in plain sight
EPD 2027 Consensus Total Return Potential
(Source: FAST Graphs, FactSet) (Source: FAST Graphs, FactSet)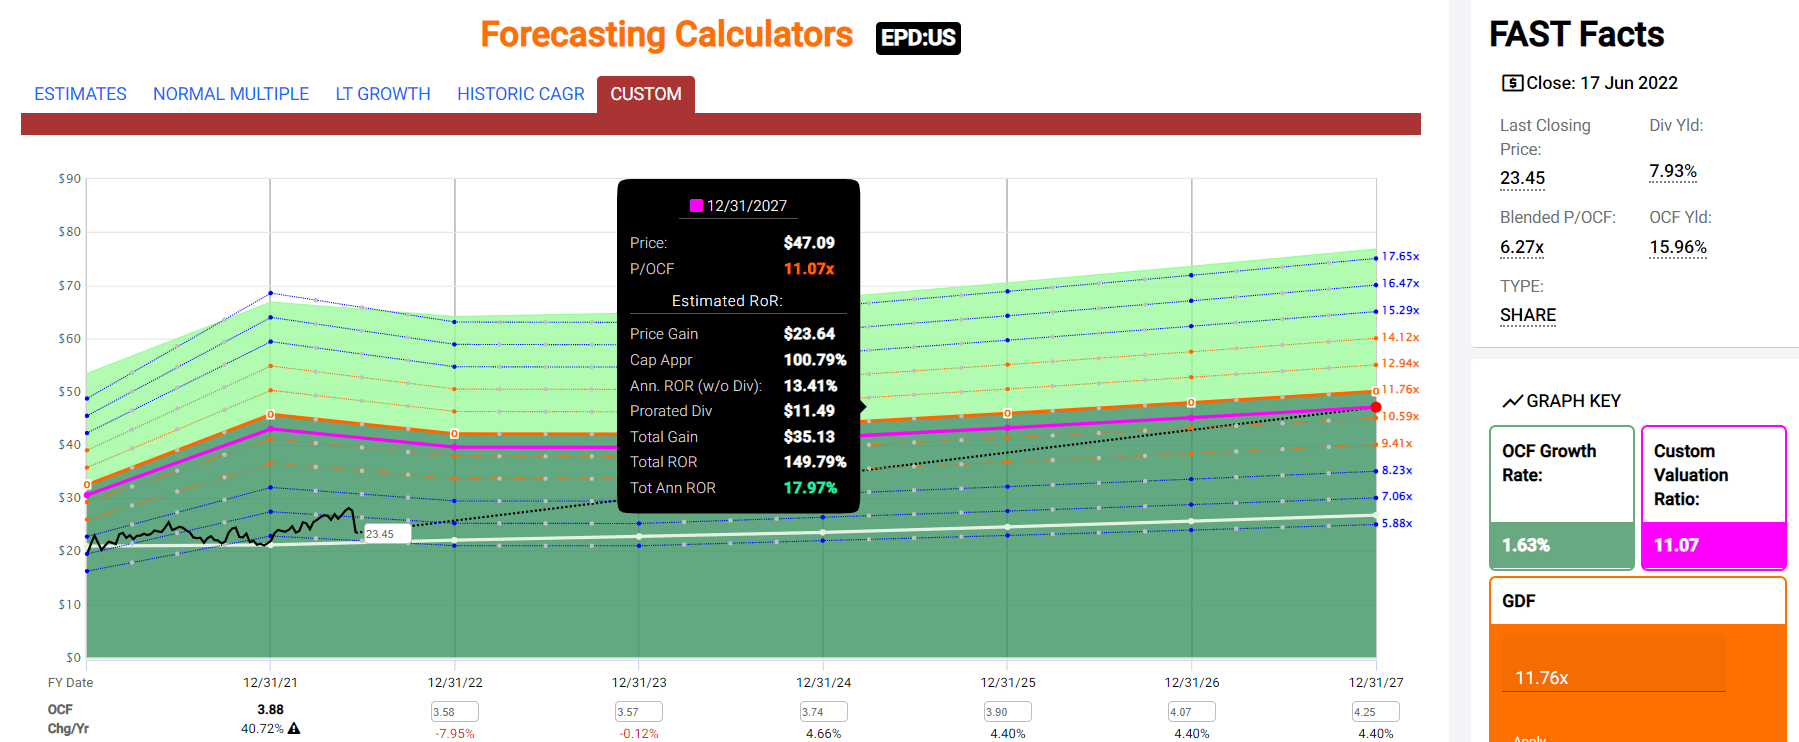
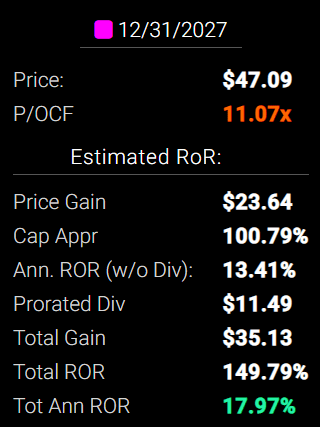
By 2027 if EPD grows as expected and returns to historical mid-range fair value, it could deliver 150% total returns or 18% annually.
- about 2.5X the S&P 500 consensus
- Buffett-like return potential
EPD Long-Term Consensus Total Return Potential
| Investment Strategy | Yield | LT Consensus Growth | LT Consensus Total Return Potential | Long-Term Risk-Adjusted Expected Return | Long-Term Inflation And Risk-Adjusted Expected Returns | Years To Double Your Inflation & Risk-Adjusted Wealth |
10-Year Inflation And Risk-Adjusted Expected Return |
| Enterprise Products Partners | 7.9% | 4.4% | 12.3% | 8.6% | 6.1% | 11.7 | 1.81 |
| Safe Midstream | 6.3% | 6.4% | 12.7% | 8.9% | 6.4% | 11.2 | 1.86 |
| 10-Year US Treasury | 3.3% | 0.0% | 3.3% | 3.3% | 0.8% | 88.9 | 1.08 |
| High-Yield | 3.1% | 12.7% | 15.8% | 11.1% | 8.6% | 8.4 | 2.28 |
| REITs | 2.8% | 6.5% | 9.3% | 6.5% | 4.0% | 17.8 | 1.49 |
| Dividend Aristocrats | 2.4% | 8.5% | 10.9% | 7.6% | 5.2% | 14.0 | 1.65 |
| S&P 500 | 1.8% | 8.5% | 10.3% | 7.2% | 4.7% | 15.2 | 1.59 |
(Sources: Morningstar, FactSet, Ycharts)
- Analysts expect EPD to significantly outperform almost every high-yield investment strategy as well as the dividend aristocrats and S&P 500 over the long-term.
- nothing offers the safety of EPD’s 8% yield with market and aristocrat beating return potential
EPD Total Returns Since August 1998
(Source: Portfolio Visualizer Premium) (Source: Portfolio Visualizer Premium)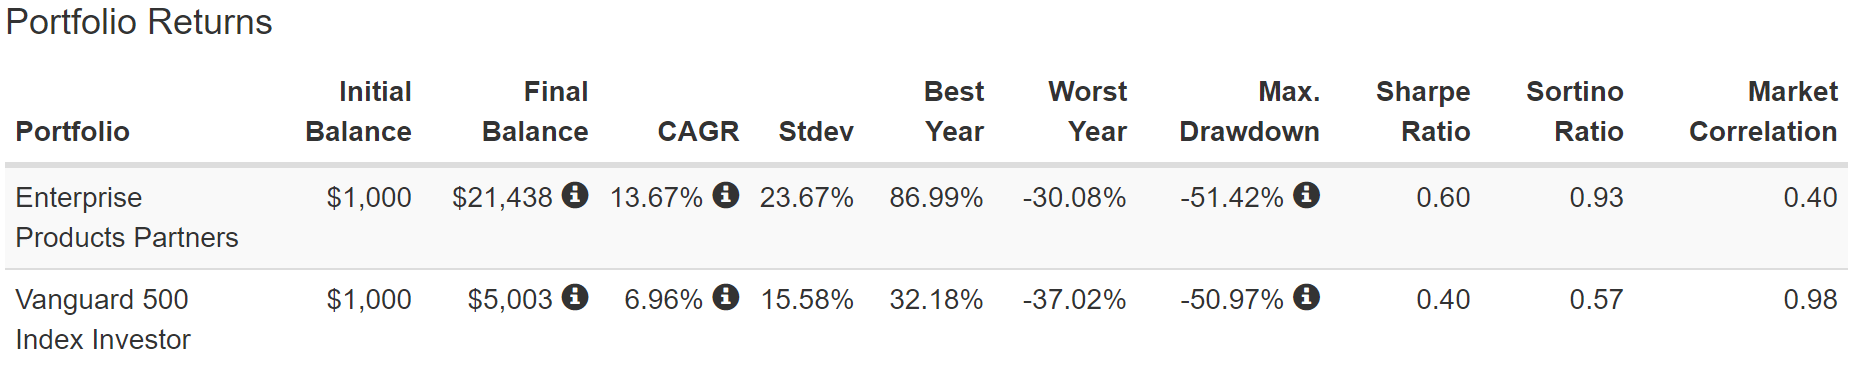
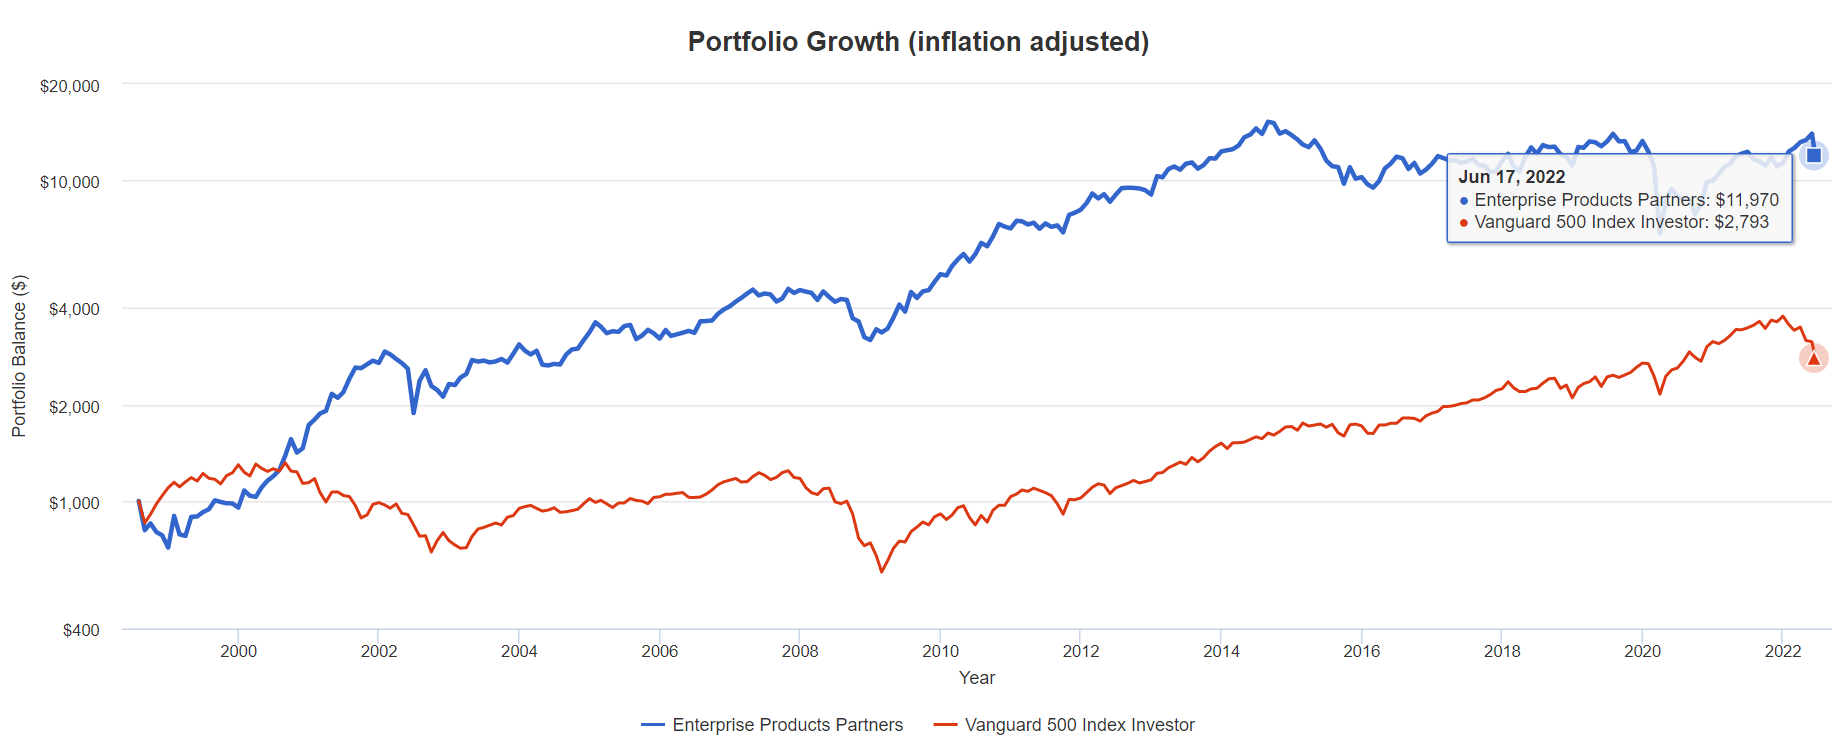
EPD has a great long-term track record of outperforming the market over time.
- 12X inflation-adjusted returns since IPO
- 4X more than the S&P 500
An Income Growth Power House
(Source: Portfolio Visualizer Premium)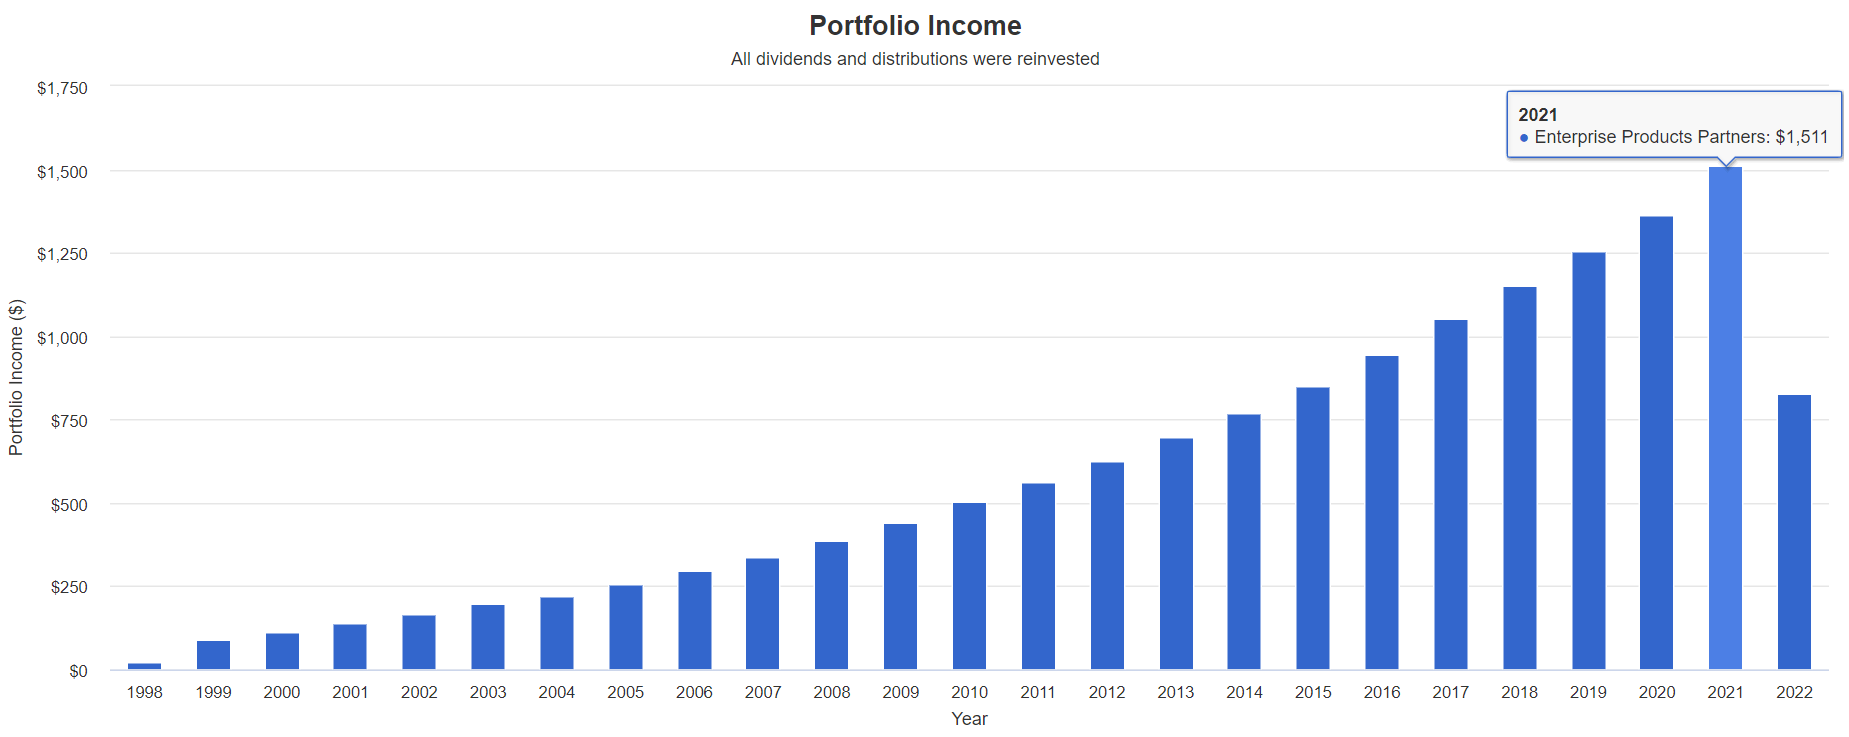
| Portfolio | 1999 Income Per $1,000 Investment | 2022 Income Per $1,000 Investment | Annual Income Growth | Starting Yield | 2021 Yield On Cost |
| EPD | $90 | $1,654 | 13.49% | 9.0% | 165.4% |
(Source: Portfolio Visualizer Premium)
EPD has delivered 13.5% annual income growth for investors for 23 years, turning a 9.0% yield in 1999 into a 165% yield on cost.
What about the future?
| Analyst Consensus Income Growth Forecast | Risk-Adjusted Expected Income Growth | Risk And Tax-Adjusted Expected Income Growth |
Risk, Inflation, And Tax Adjusted Income Growth Consensus |
| 12.1% | 8.5% | 7.2% | 4.7% |
(Source: DK Research Terminal, FactSet)
Analysts expect 12% income growth from VFC in the future, which adjusted for the risk of it not growing as expected, inflation, and taxes is about 5% real expected income growth.
Now compare that to what they expect from the S&P 500.
| Time Frame | S&P Inflation-Adjusted Dividend Growth | S&P Inflation-Adjusted Earnings Growth |
| 1871-2021 | 1.6% | 2.1% |
| 1945-2021 | 2.4% | 3.5% |
| 1981-2021 (Modern Falling Rate Era) | 2.8% | 3.8% |
| 2008-2021 (Modern Low Rate Era) | 3.5% | 6.2% |
| FactSet Future Consensus | 2.0% | 5.2% |
(Sources: S&P, FactSet, Multipl.com)
What about a 60/40 retirement portfolio?
- 0.5% consensus inflation, risk, and tax-adjusted income growth.
In other words, EPD is expected to generate 3X faster real income growth than the S&P 500 and 9X faster income growth than a 60/40.
- while offering almost 5X the income on day one
- and a much safer income at that
What inflation-adjusted returns do analysts expect in the future?
Inflation-Adjusted Consensus Return Potential: $1,000 Initial Investment
| Time Frame (Years) | 7.6% CAGR Inflation-Adjusted S&P Consensus | 8.4% Inflation-Adjusted Aristocrats Consensus | 9.8% CAGR Inflation-Adjusted EPD Consensus | Difference Between Inflation-Adjusted EPD Consensus Consensus Vs S&P Consensus |
| 5 | $1,445.67 | $1,493.29 | $1,598.10 | $152.43 |
| 10 | $2,089.97 | $2,229.92 | $2,553.93 | $463.96 |
| 15 | $3,021.42 | $3,329.92 | $4,081.45 | $1,060.04 |
| 20 | $4,367.98 | $4,972.54 | $6,522.58 | $2,154.60 |
| 25 | $6,314.67 | $7,425.45 | $10,423.76 | $4,109.09 |
| 30 | $9,128.95 | $11,088.36 | $16,658.26 | $7,529.30 |
(Source: DK Research Terminal, FactSet)
Analysts believe that over the next 30 years EPD could deliver almost 17X inflation-adjusted returns.
| Time Frame (Years) | Ratio Aristocrats/S&P Consensus | Ratio Inflation–Adjusted EPD Consensus |
| 5 | 1.03 | 1.11 |
| 10 | 1.07 | 1.22 |
| 15 | 1.10 | 1.35 |
| 20 | 1.14 | 1.49 |
| 25 | 1.18 | 1.65 |
| 30 | 1.21 | 1.82 |
(Source: DK Research Terminal, FactSet)
Which is almost 2X more than the S&P 500 and 60% more than the dividend aristocrats
- while you enjoy a very safe yield that’s nearly 5X higher.
EPD Investment Decision Score
DK (Source: DK Automated Investment Decision Tool)
For anyone comfortable with its risk profile, EPD is one of the most reasonable and prudent ultra-high-yielding blue-chips you can buy.
- 24% discount vs 8% market discount = 16% better valuation
- 7.9% yield vs 1.8% yield (and a much safer yield at that) almost 5X the market’s yield
- potentially 30% higher long-term return potential than S&P 500 overtime
- about 1.5X better risk-adjusted expected return over the next five years
- 48% of your investment repaid in the first five years in consensus tax-deferred distributions (4X more than the S&P 500)
Reason Two: One Of The Safest High-Yield Blue-Chips On Earth
There are many ways to measure safety and quality and I factor in pretty much all of them.
The Dividend Kings’ overall quality scores are based on a 253-point model that includes:
-
Dividend safety
-
Balance sheet strength
-
Credit ratings
-
Credit default swap medium-term bankruptcy risk data
-
Short and long-term bankruptcy risk
-
Accounting and corporate fraud risk
-
Profitability and business model
-
Growth consensus estimates
-
Management growth guidance
-
Historical earnings growth rates
-
Historical cash flow growth rates
-
Historical dividend growth rates
-
Historical sales growth rates
-
Cost of capital
-
GF Scores
-
Long-term risk-management scores from MSCI, Morningstar, FactSet, S&P, Reuters’/Refinitiv, and Just Capital
-
Management quality
-
Dividend-friendly corporate culture/income dependability
-
Long-term total returns (a Ben Graham sign of quality)
-
Analyst consensus long-term return potential
In fact, it includes over 1,000 fundamental metrics including the 12 rating agencies we use to assess fundamental risk.
-
credit and risk management ratings make up 41% of the DK safety and quality model
-
dividend/balance sheet/risk ratings make up 82% of the DK safety and quality model
How do we know that our safety and quality model works well?
During the two worst recessions in 75 years, our safety model 87% of blue-chip dividend cuts, the ultimate baptism by fire for any dividend safety model.
How does EPD score on our comprehensive safety and quality models?
EPD Distribution Safety
| Rating | Dividend Kings Safety Score (162 Point Safety Model) | Approximate Dividend Cut Risk (Average Recession) |
Approximate Dividend Cut Risk In Pandemic Level Recession |
| 1 – unsafe | 0% to 20% | over 4% | 16+% |
| 2- below average | 21% to 40% | over 2% | 8% to 16% |
| 3 – average | 41% to 60% | 2% | 4% to 8% |
| 4 – safe | 61% to 80% | 1% | 2% to 4% |
| 5- very safe | 81% to 100% | 0.5% | 1% to 2% |
| EPD | 96% | 0.5% | 1.20% |
| Risk Rating | Low-Risk (67th industry percentile risk-management consensus) | BBB+ stable outlook credit rating 5% 30-year bankruptcy risk | 20% OR LESS Max Risk Cap Recommendation |
Long-Term Dependability
| Company | DK Long-Term Dependability Score | Interpretation | Points |
| Non-Dependable Companies | 21% or below | Poor Dependability | 1 |
| Low Dependability Companies | 22% to 60% | Below-Average Dependability | 2 |
| S&P 500/Industry Average | 61% (61% to 70% range) | Average Dependability | 3 |
| Above-Average | 71% to 80% | Very Dependable | 4 |
| Very Good | 81% or higher | Exceptional Dependability | 5 |
| EPD | 82% | Exceptional Dependability | 5 |
Overall Quality
| EPD | Final Score | Rating |
| Safety | 96% | 5/5 very safe |
| Business Model | 80% | 3/3 wide and stable moat |
| Dependability | 82% | 5/5 exceptional |
| Total | 90% | 13/13 Ultra SWAN |
| Risk Rating | 3/3 Low-Risk | |
| 20% OR LESS Max Risk Cap Rec |
5% Margin of Safety For A Potentially Good Buy |
How high quality is EPD? It’s the 69th highest quality company on the DK 500 Master List, meaning 86th percentile among the world’s most elite companies.
- among every dividend champion
- among every dividend aristocrat
- among every dividend king
- among every global aristocrat
- among 40 of the world’s best growth stocks
Even among the world’s highest quality, blue-chips EPD is higher quality than 86% of them.
Why I Trust Enterprise And So Can You
-
Deep Dive On Why The Energy Transition Will Take Decades
- watch section 3 to see why EPD’s business model won’t likely be disrupted anytime soon
- the bond market is confident EPD will still be around to pay off its 2078 bonds
But here’s the summary.
(Source: investor presentation)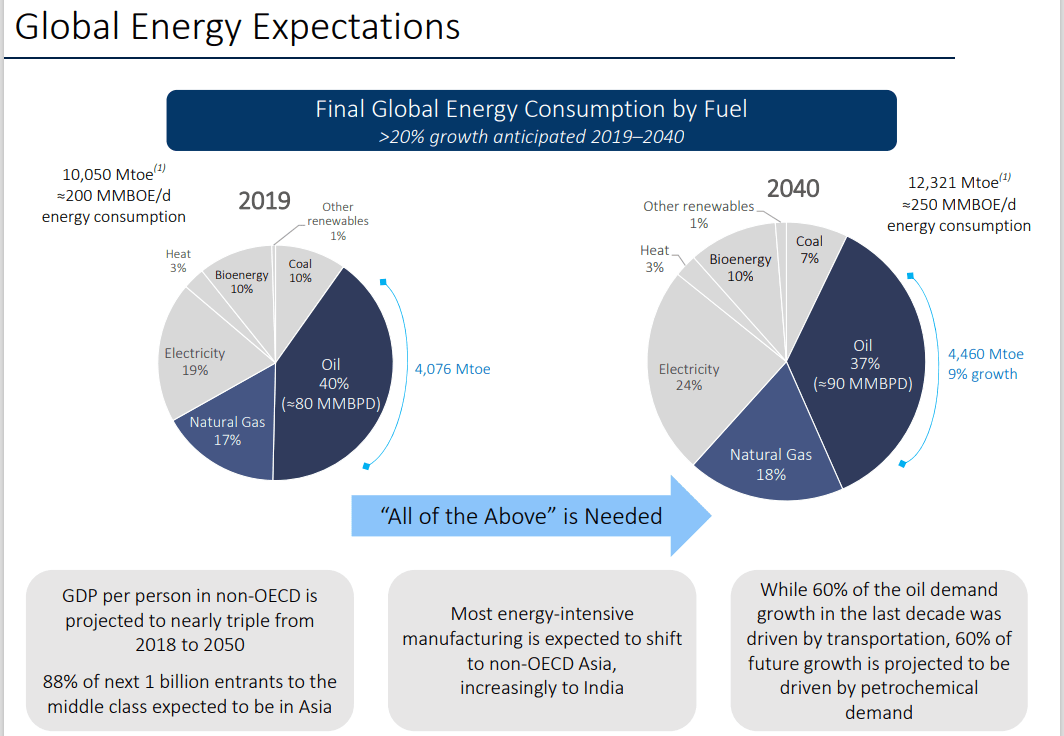
The energy transition, no matter what any politician tells you, will not happen quickly.
(Source: investor presentation)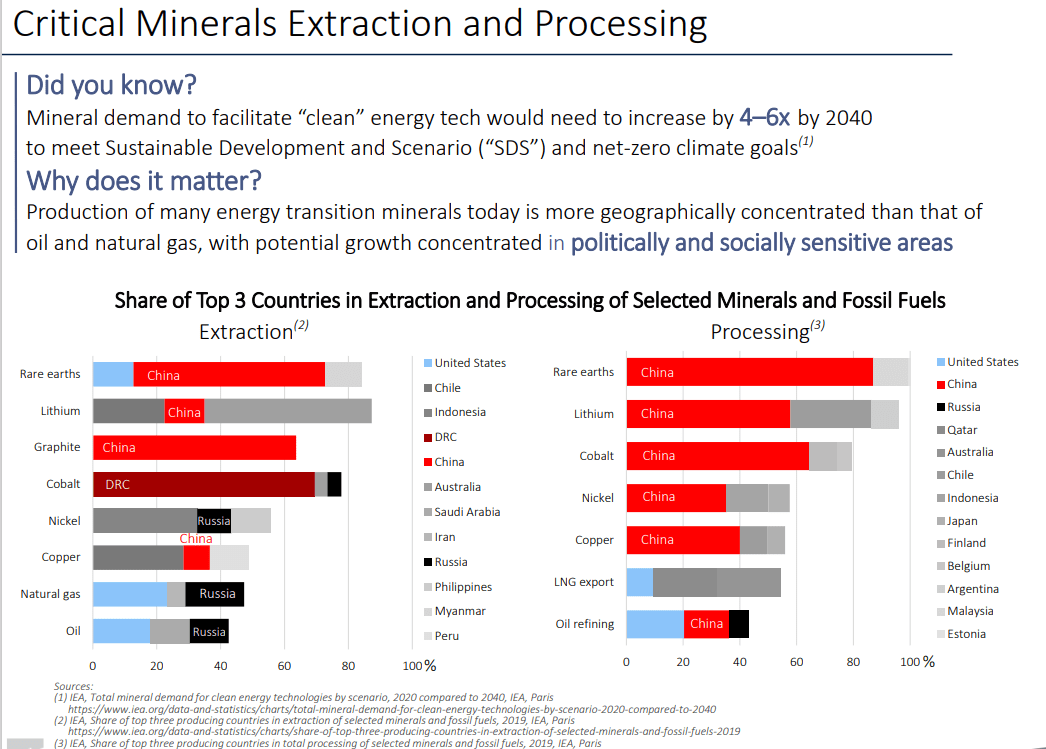
The minerals needed for the green energy transition are dominated by China.
Russia is currently a critical player in traditional oil & gas.
- also needed for the energy transition
The world can either rely on these autocratic regimes or invest in production in democratic countries.
(Source: investor presentation)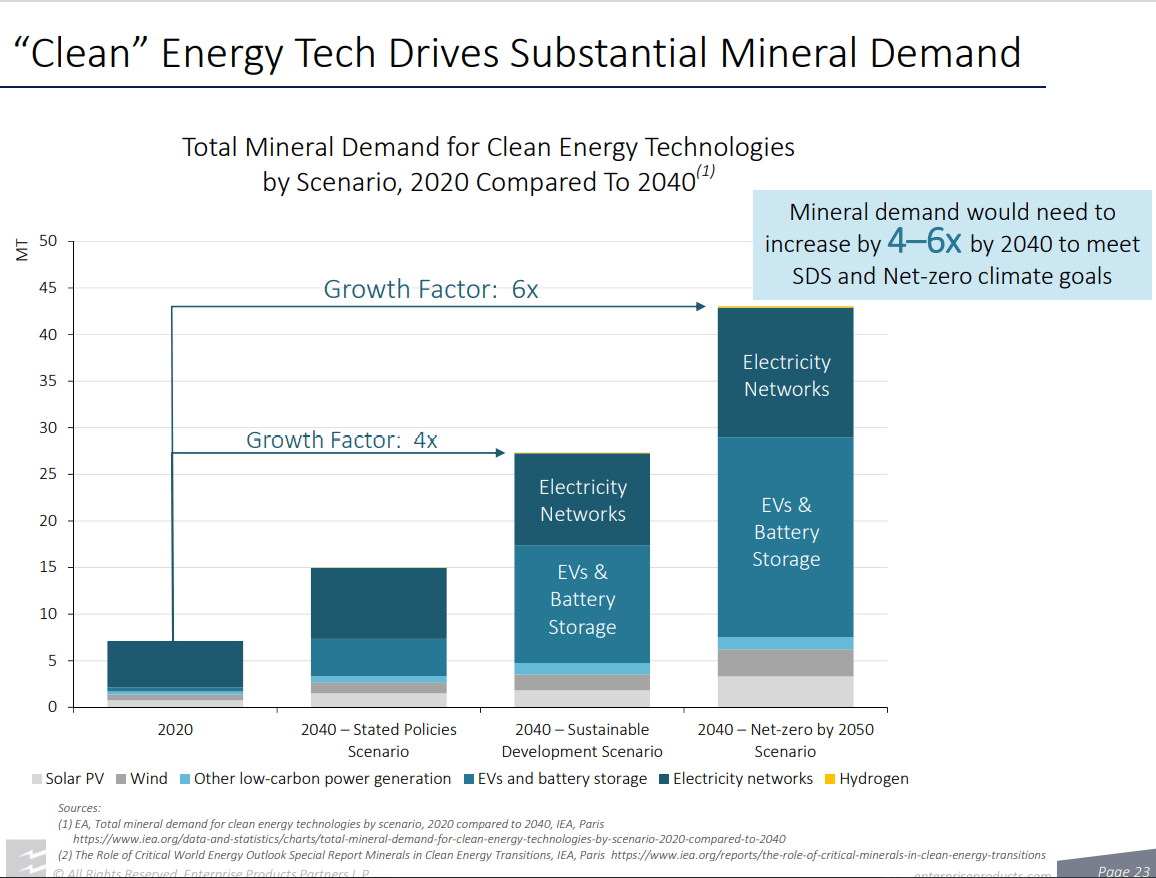
We need 6X of the current mineral production to make the green energy transition by 2050.
(Source: investor presentation)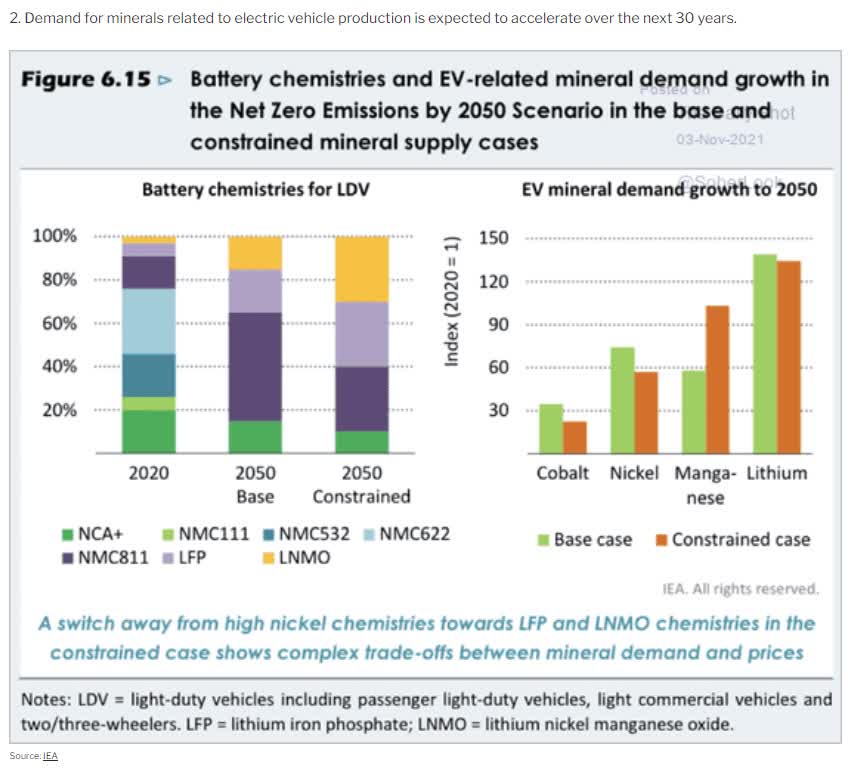
On average, it takes over 16 years to get a new lithium mine into production, thanks to the very regulations and lawsuits that environmentalists keep advocating for.
We need 135X as much lithium production as we have now.
- currently, a 100% transition would leave China in the same position Russia has over the EU
- at their mercy
10 to 20 years to go 100% green? Simply not possible. Not opinion, objective fact.
- 30 to 50 years is what experts actually expect the energy transition to take
Founded in 1998 in Houston, Enterprise is one of the widest moat midstreams in America.
(Source: investor presentation)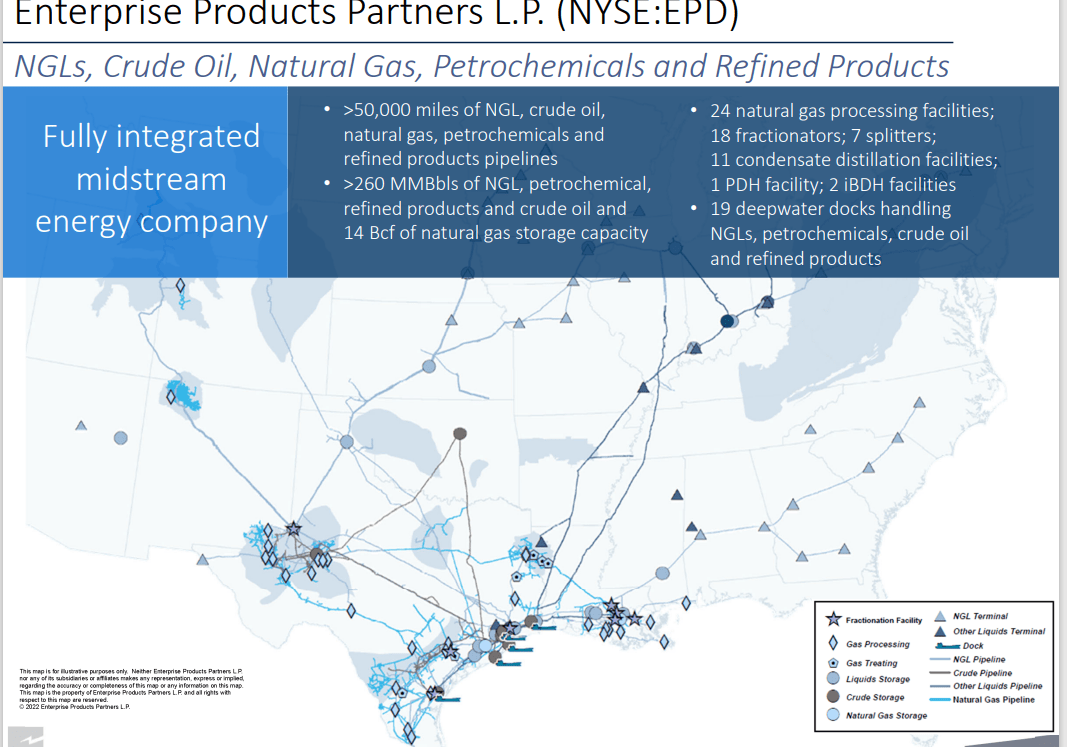
- EPD’s assets are irreplaceable
- without EPD life as we know it ends
(Source: investor presentation)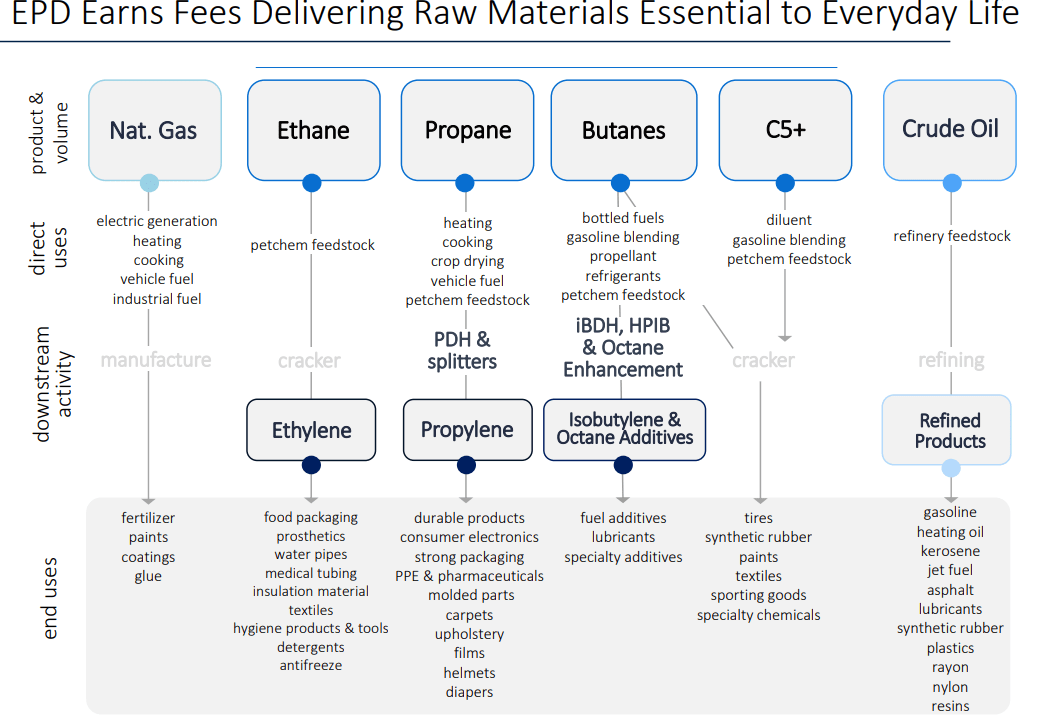
Almost every part of your life and the economy runs through EPD’s transportation and processing network.
- the supply chain for the entire US economy
(Source: investor presentation)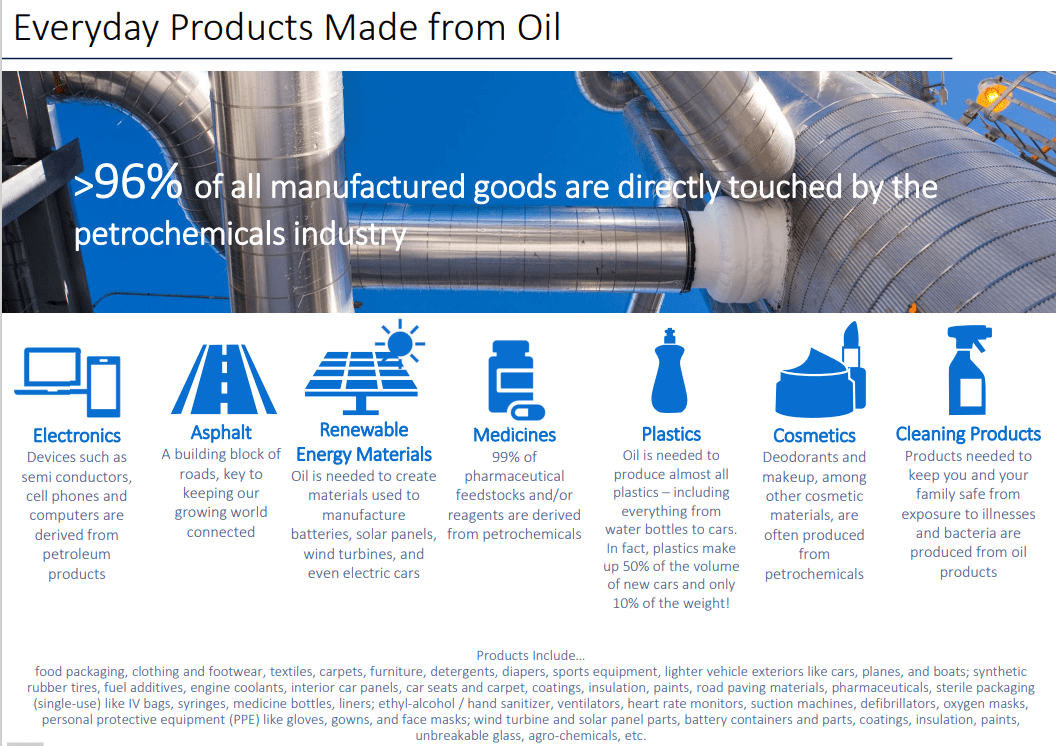
- 96% of all products include oil & gas inputs
- including 99% of medicine
- and batteries, solar panels, wind turbines, and EVs
- renewable energy transition can’t happen without oil
- the green energy transition can’t happen without Enterprise Products Partners
(Source: investor presentation)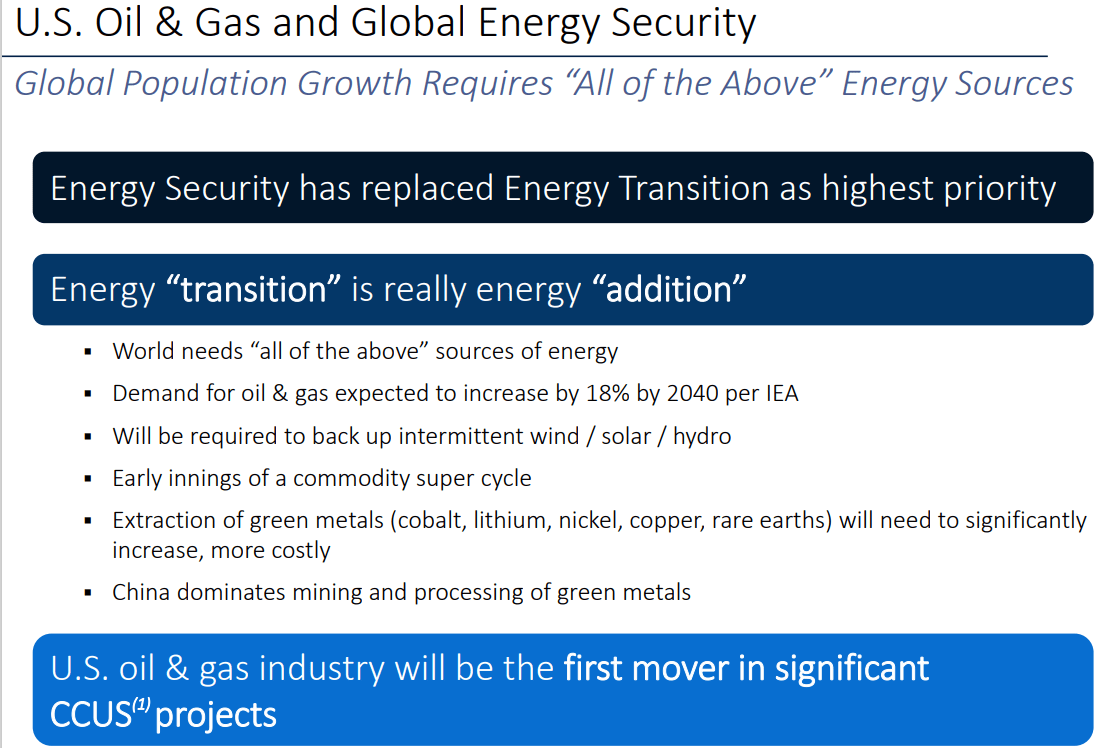
The International Energy Agency thinks global oil and gas demand (mostly gas) will actually increase by 18% by 2040.
- even factoring in climate change initiatives
(Source: investor presentation)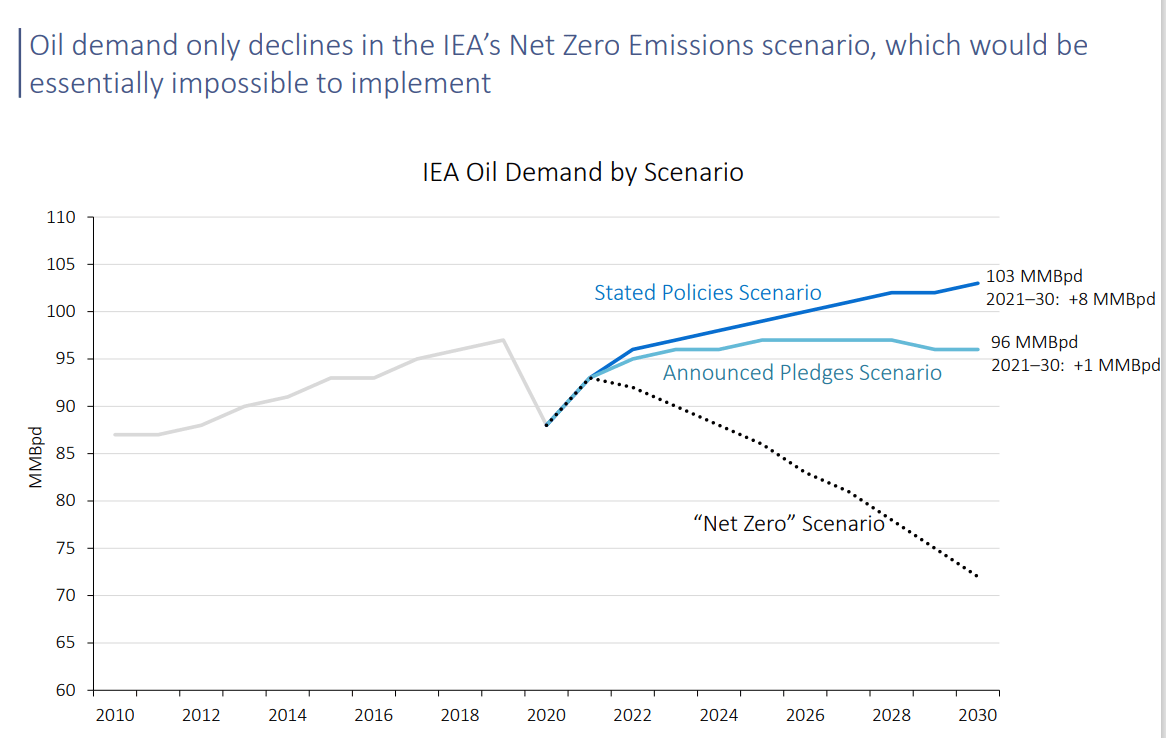
The world pledges to cut emissions fast and then ignores those pledges.
- soaring energy prices in Europe and war are taking precedent
- as always happens in a democracy
- people refuse to freeze or live in recession for high-minded ideals
Under the Paris accords the world promised to actually increase oil demand by 1 million bpd.
- not even close to the 2050 net-zero goal
And we’re actually on track to add 8 million bpd in global daily demand by 2030.
(Source: investor presentation)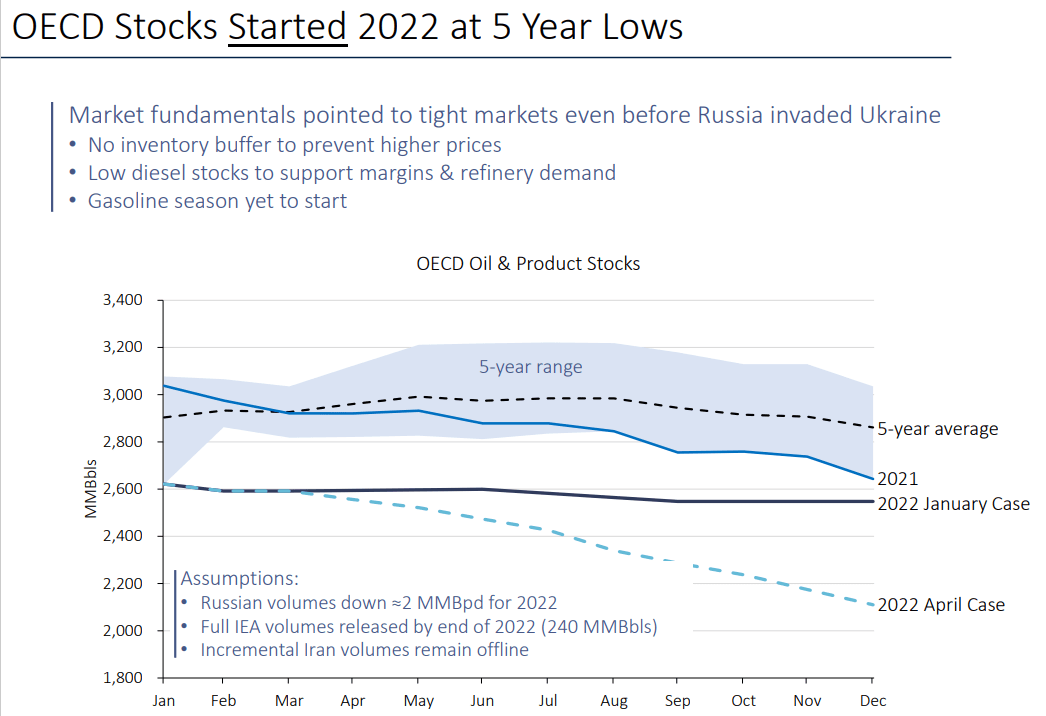
The world began 2022 (before the invasion) at multi-year lows in oil and refined product supply.
And then Russia’s invasion and western sections took an estimated 2 million bpd off the world market.
- Russia is steadily decreasing gas supplies to Europe
- sending gas prices soaring as much as 24% in a single day
- electricity prices have more than doubled in the last year in many EU countries
(Source: investor presentation)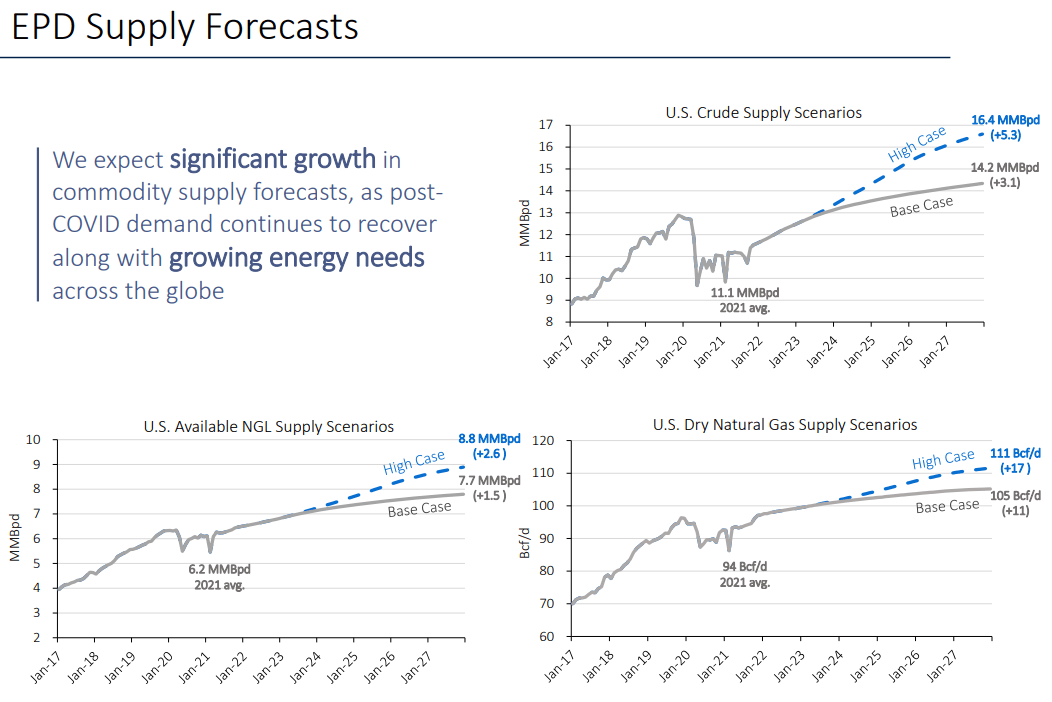
The US is once more the #1 global supplier of oil & gas to the world and our production is expected to rise steadily through 2028 at least.
- possibly by nearly 100%
- a major tailwind to all of midstream
(Source: investor presentation)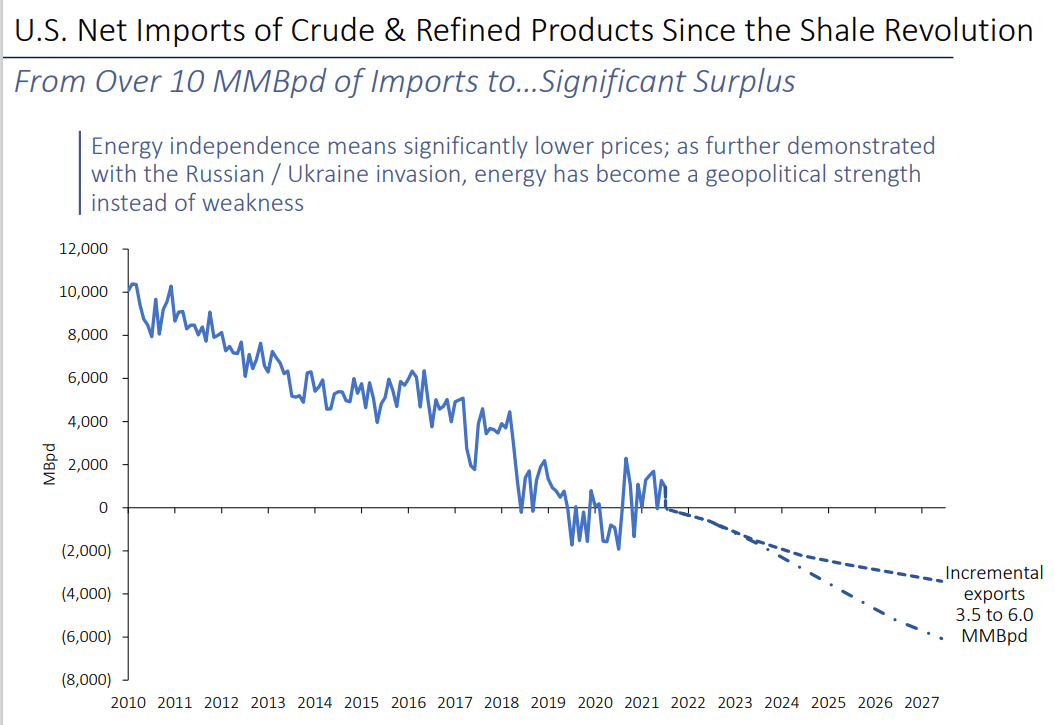
The US shale revolution (that helped the US switch from coal to gas in record time and reduce emissions more than Europe) is also why the US is in a much better position than the EU during this war.
- Europe was so focused on renewables they ignored energy security and are now at the mercy of Putin
(Source: investor presentation)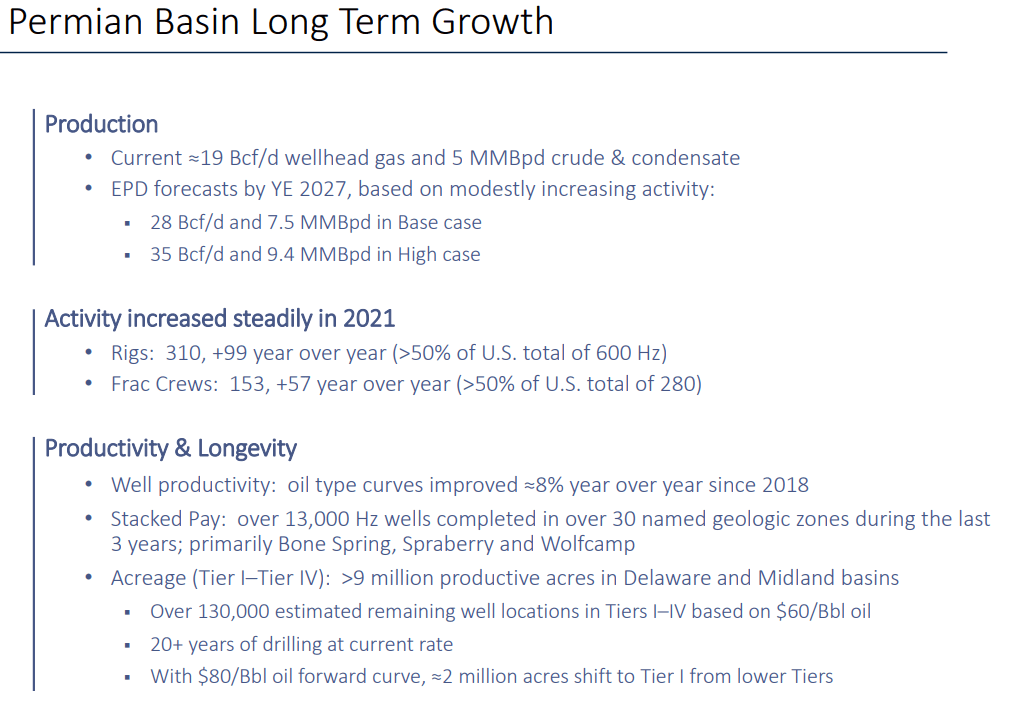
The Permian Basin in Texas is potentially the largest oil reserve in the world and could double oil production by 2027 if crude prices stay high.
- EPD’s assets are primarily focused on the Permian
(Source: investor presentation)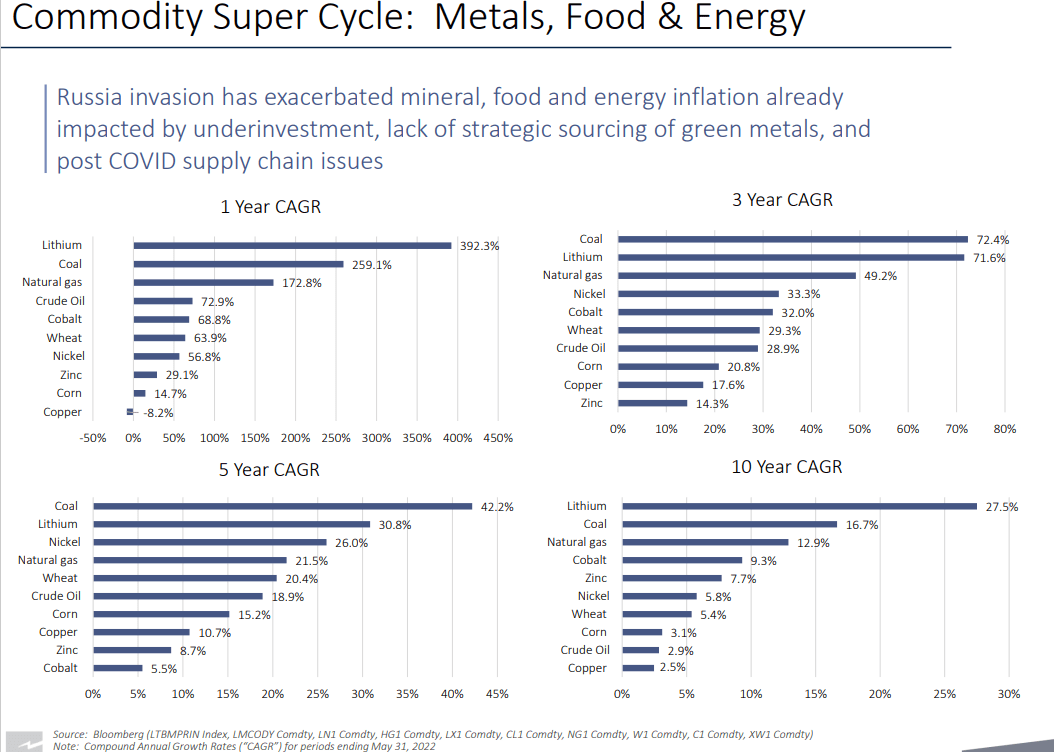
Many economists think we’re in a commodity super cycle.
- created by a decade of under-investment in raw materials
- causing Lithium prices to soar 400% in the last year
- the average EV now costs $61K vs $48K for the average car
Midstream is a great way to hedge inflation while enjoying a safe and steadily growing yield with less cash flow volatility than commodity producers.
(Source: investor presentation)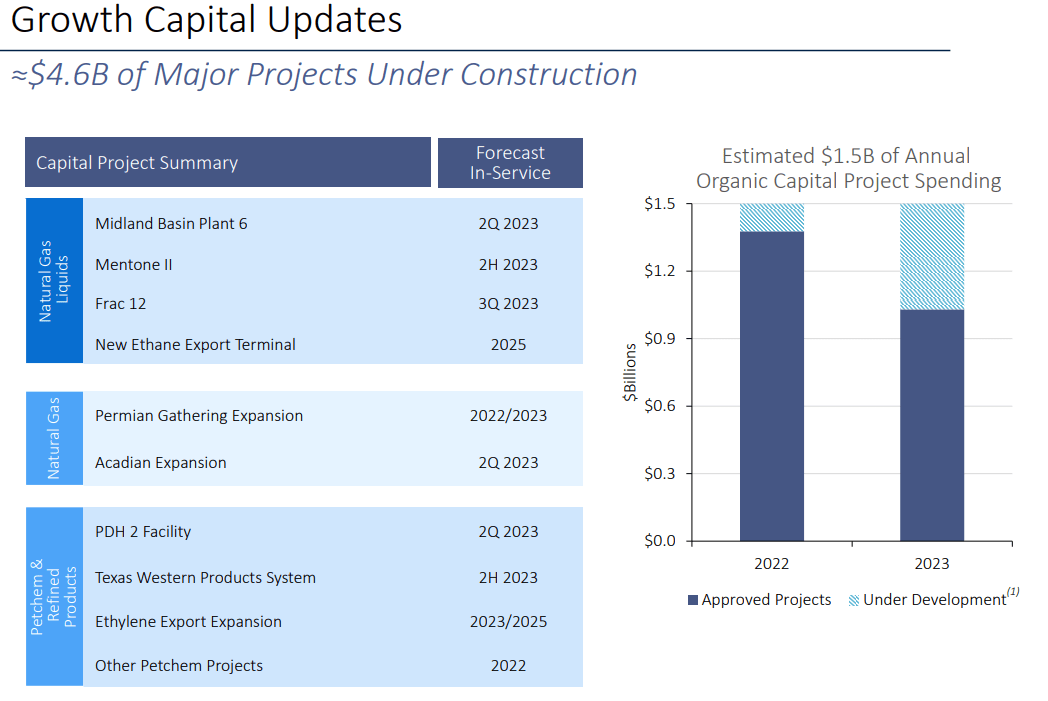
EPD currently has $4.6 billion in projects under construction and that could potentially double soon.
- S&P reports EPD could be about to start a $5 billion ethane and propane cracker in Texas
- 2 million tons per year capacity
- in Houston right at the export terminal in Beaumont Texas
EPD also recently announced it was buying Navitas Midstream for $3.25 billion.
(Source: investor presentation)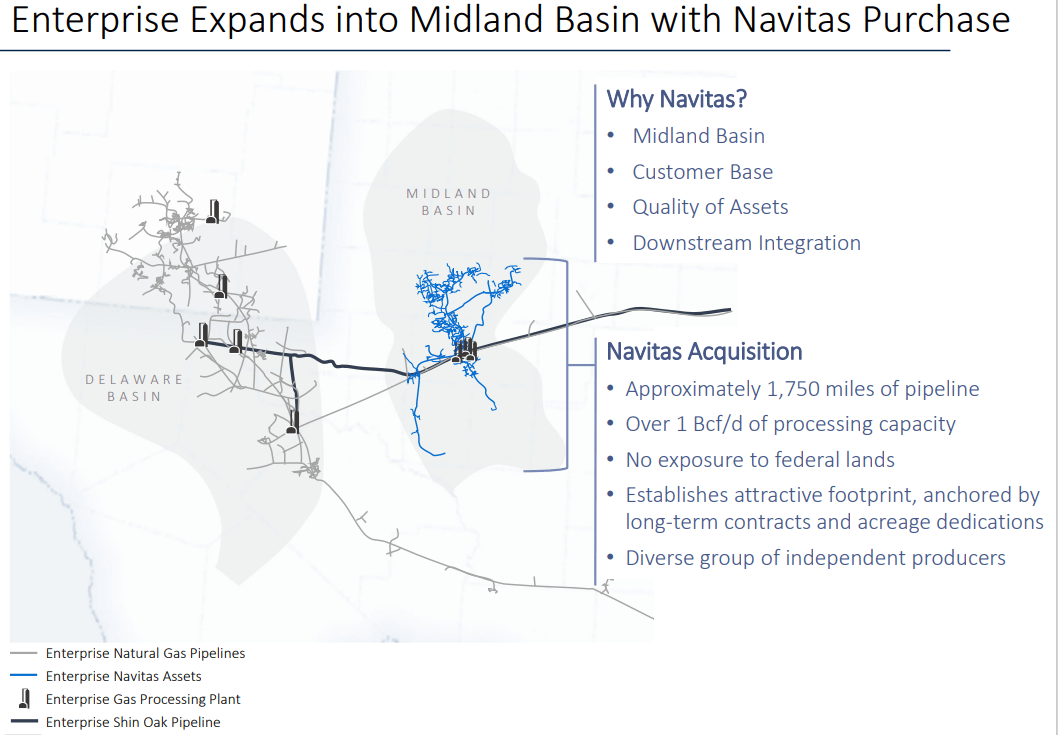
- Navitas expands capacity in the Permian Super Basin
- zero exposure to Federal lands
- minimal regulatory risk
- Texas is very pro-energy projects
(Source: investor presentation)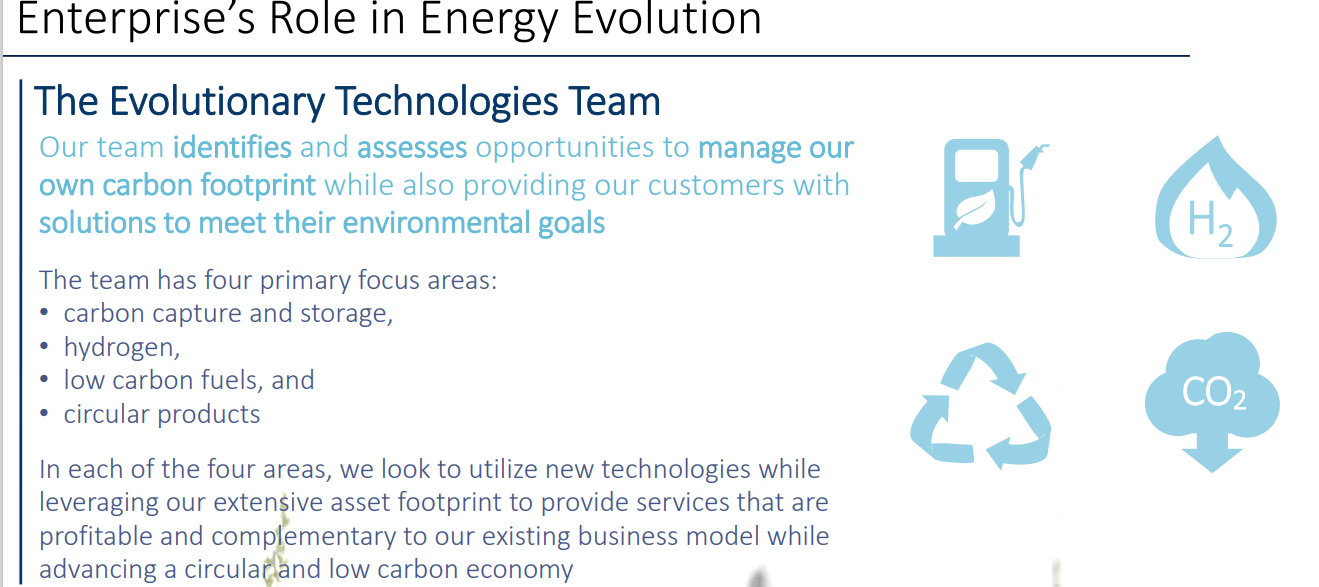
For the long-term EPD has an entire team focused on carbon capture, hydrogen, and low carbon fuels (like renewable methane).
- Cummins (CMI) thinks hydrogen is a potential $3.5 trillion global market by 2030
- EPD is already one of the largest hydrogen producers in the country
- they have the infrastructure to become an industry leader
(Source: investor presentation)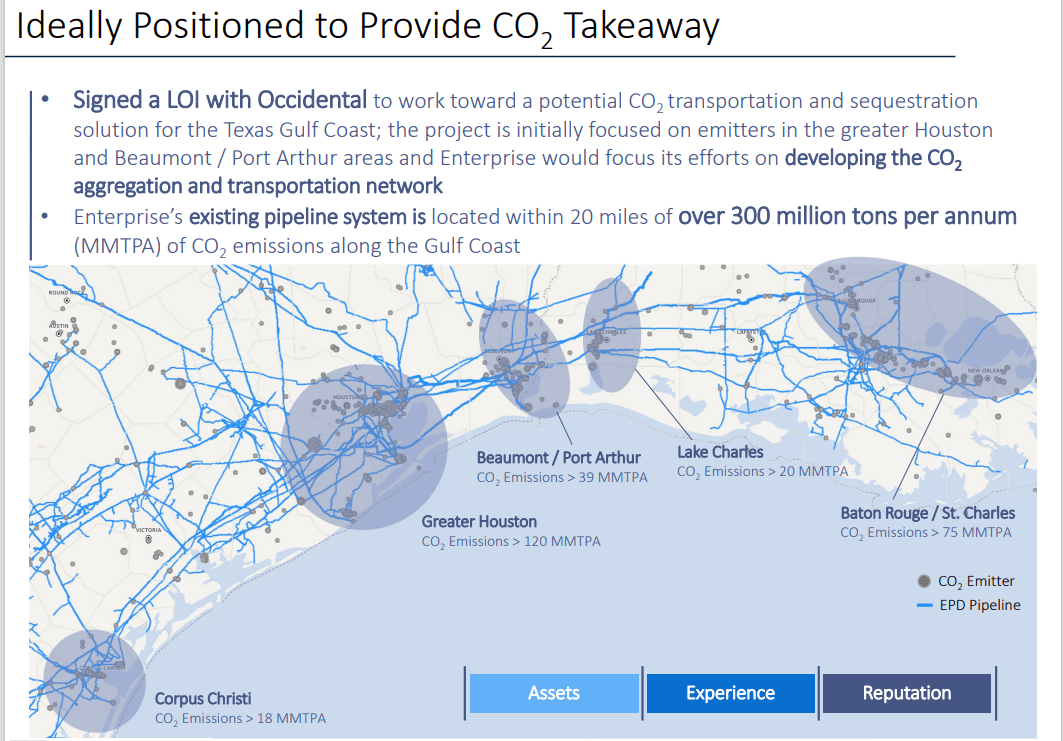
EPD is also well positioned for CO2 transportation and storage.
- CO2 is used for enhanced oil production
- which injects CO2 into oil wells to increase production
- while reducing emissions
(Source: investor presentation)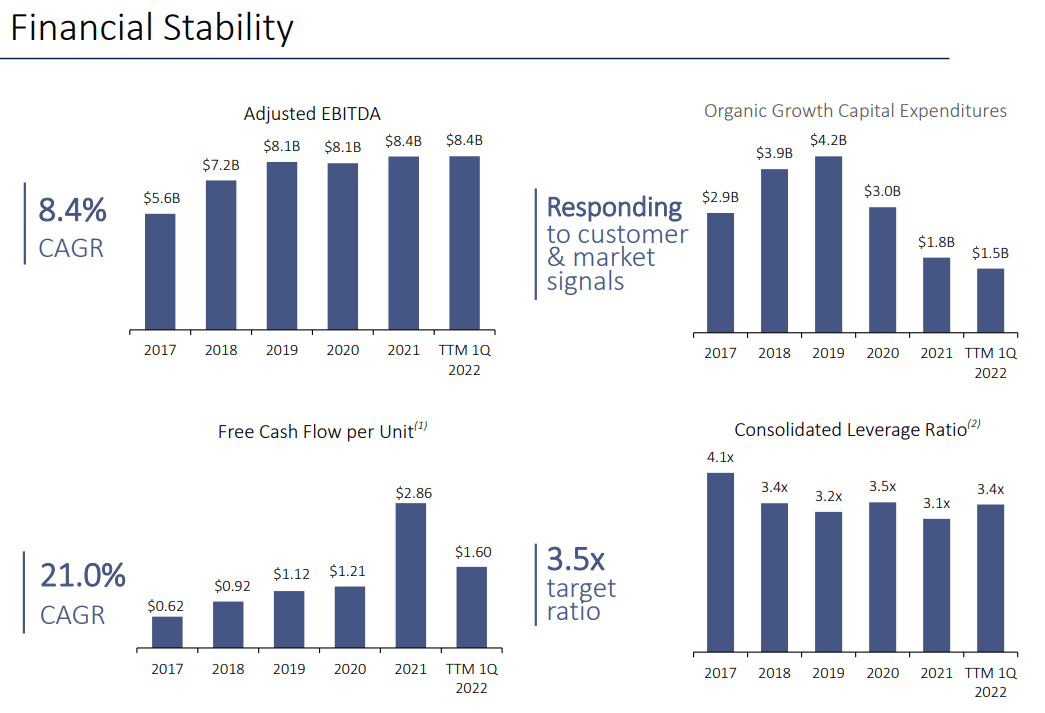
EPD has been one of the most conservative midstream blue-chips.
- targeting 3.5X debt/EBITDA vs 5.0 or less safe according to rating agencies
- modifying growth spending to align with industry demand
- strong growth in free cash flow per share
| Year | Distributable Cash Flow | Free Cash Flow | Distributions | DCF Payout Ratio | FCF Payout Ratio |
| 2022 | $7,041.0 | $5,428.20 | $4,076.60 | 57.9% | 75.1% |
| 2023 | $7,043.0 | $5,820.60 | $4,229.20 | 60.0% | 72.7% |
| 2024 | $7,394.0 | $6,561.80 | $4,360.00 | 59.0% | 66.4% |
| 2025 | $7,692.0 | $6,518.20 | $4,490.80 | 58.4% | 68.9% |
| 2026 | $8,272.0 | $7,194.00 | $4,621.60 | 55.9% | 64.2% |
| 2027 | $8,760.0 | $6,888.80 | $4,752.40 | 54.3% | 69.0% |
| Annual Growth | 4.47% | 4.88% | 3.12% | -1.29% | -1.68% |
(Source: FactSet Research Terminal)
- rating agencies consider an 83% DCF payout ratio safe for midstream
- EPD’s 2022 consensus is 58% and it also covers distributions with free cash flow
- 100% free-cash-flow self-funding
- if EPD’s price was $1 it would accelerate growth
- due to buybacks
- 100% independent of capital markets for its growth prospects
- FCF self-funding is the platinum standard of safety in the industry
(Source: investor presentation)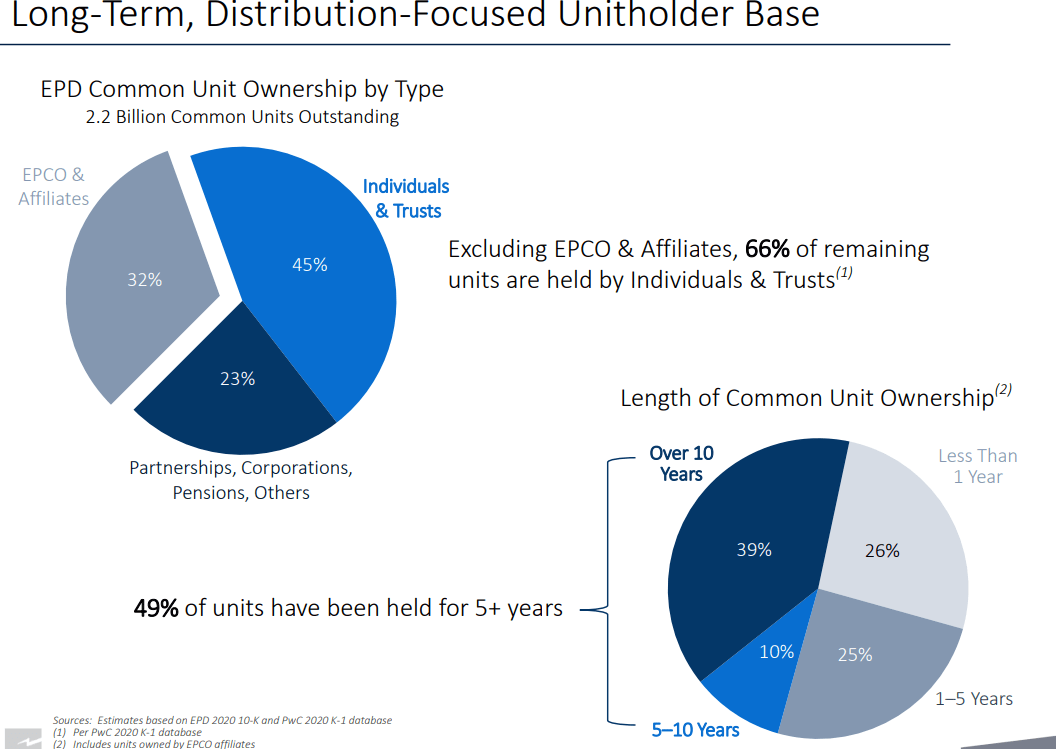
32% of EPD is owned by management via EPCO.
- it was one of the first MLPs to buy out its GP’s incentive distribution rights and reduce its cost of capital
(Source: investor presentation)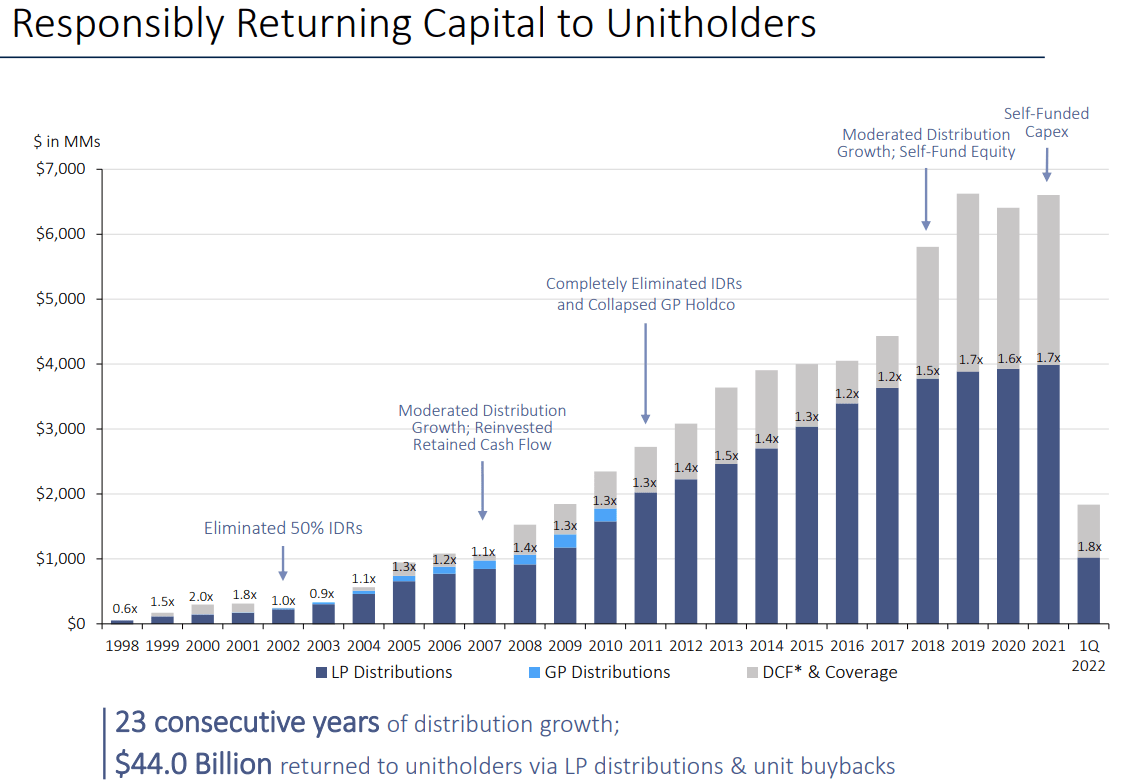
1.2X DCF coverage is considered safe in this industry.
- EPD has maintained a safe coverage ratio for 22 of the last 24 years
- now 1.8X
- 23-year payout growth streak
- management says becoming a dividend champion (25+ year streak) is a priority
(Source: investor presentation)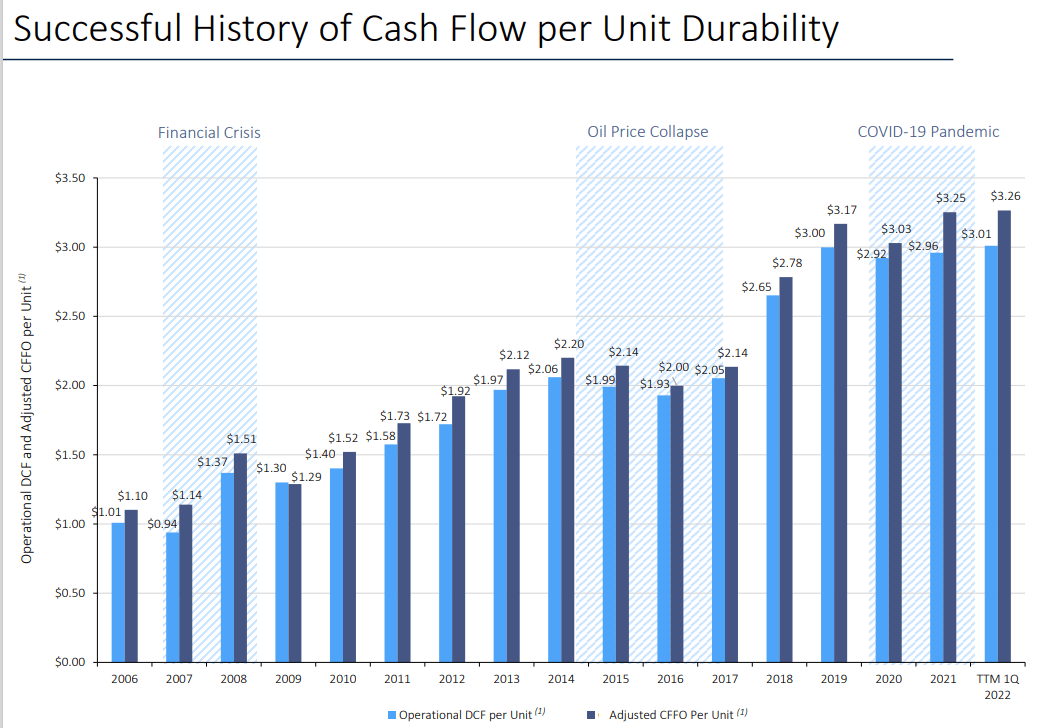
EPD’s cash flow is very stable compared to commodity prices.
- new projects tend to be 100% contracted for long-term with investment-grade companies
- 15-year contracts for new NGL projects
EPD’s cash flows are 14% sensitive to commodity prices.
(Source: investor presentation)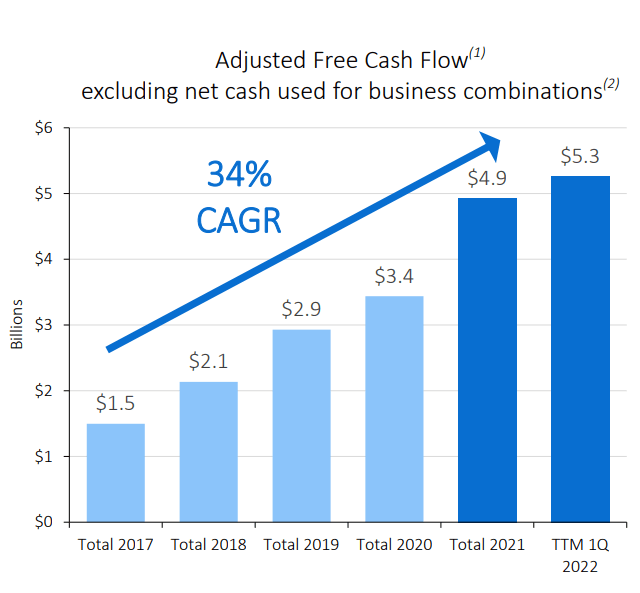
EPD has become a free cash flow minting machine, with FCF growth of 34% annually since 2017.
(Source: investor presentation)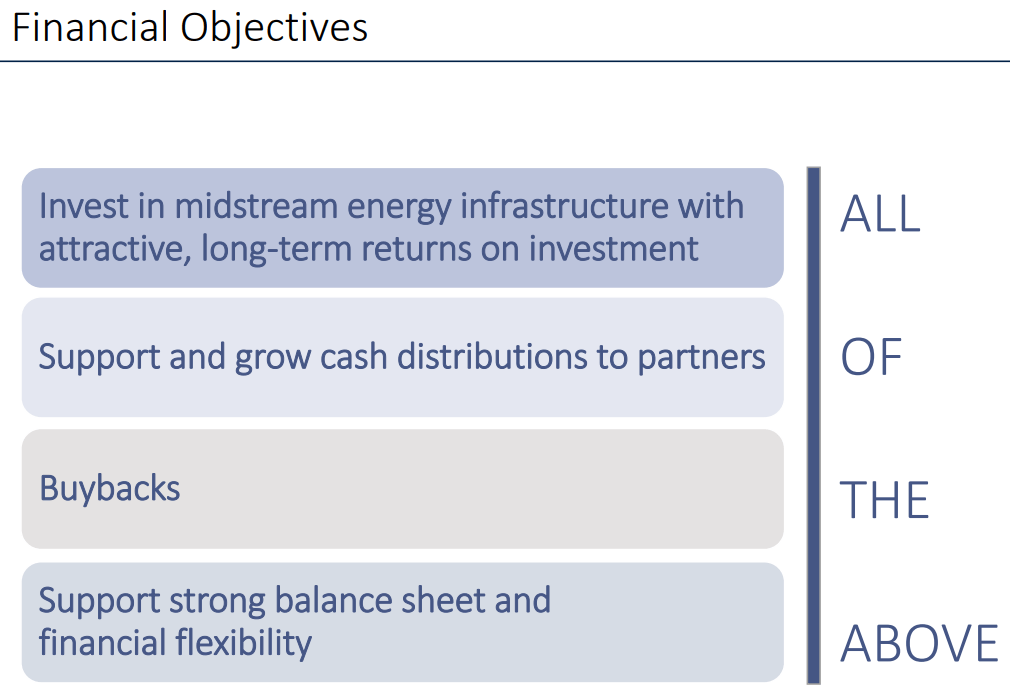
EPD’s priorities include investing in growth, growing the payout every year, opportunistically buying back stock, and maintaining one of the strongest balance sheets in the industry.
- tied for the highest with MMP, ENB, and TRP (BBB+)
Bottom Line: EPD Is The Quality And Safety King of Midstream
Quantitative Analysis: The Math Backing Up The Investment Thesis
Ben Graham recommended combining qualitative (the story) analysis with quantitative analysis looking at the past, present, and likely future.
EPD Credit Ratings
| Rating Agency | Credit Rating | 30-Year Default/Bankruptcy Risk | Chance of Losing 100% Of Your Investment 1 In |
| S&P | BBB+ stable outlook | 5.00% | 20.0 |
| Fitch | BBB+ stable outlook | 5.00% | 20.0 |
| Moody’s | BBB+ stable outlook | 5.00% | 20.0 |
| Consensus | BBB+ stable outlook | 5.00% | 20.0 |
(Source: S&P, Fitch)
EPD is tied for the highest credit rating in midstream and if its leverage keeps trending lower as analysts expect it could be one of the first to obtain an A-credit rating.
EPD Leverage Consensus Forecast
| Year | Debt/EBITDA | Net Debt/EBITDA (5.0 Or Less Safe According To Credit Rating Agencies) |
Interest Coverage (2+ Safe) |
| 2020 | 3.72 | 3.58 | 3.91 |
| 2021 | 3.37 | 3.17 | 4.92 |
| 2022 | 3.35 | 3.23 | 5.14 |
| 2023 | 3.26 | 3.05 | 5.41 |
| 2024 | 2.67 | 2.86 | 5.70 |
| 2025 | NA | 2.34 | 6.19 |
| 2026 | NA | 1.94 | NA |
| Annualized Change | -7.94% | -9.67% | 9.62% |
(Source: FactSet Research Terminal)
EPD’s fortress balance sheet is expected to keep getting stronger over time.
- by 2026 it could obtain the first A-credit rating in the industry
- possibly earlier
EPD Balance Sheet Consensus Forecast
| Year | Total Debt (Millions) | Cash | Net Debt (Millions) | Interest Cost (Millions) | EBITDA (Millions) | Operating Income (Millions) |
| 2020 | $30,001 | $410 | $28,819 | $1,287 | $8,056 | $5,035 |
| 2021 | $28,271 | $2,819 | $26,608 | $1,283 | $8,381 | $6,315 |
| 2022 | $29,905 | $1,368 | $28,863 | $1,288 | $8,938 | $6,617 |
| 2023 | $29,901 | $1,762 | $27,938 | $1,267 | $9,165 | $6,857 |
| 2024 | $25,106 | NA | $26,817 | $1,222 | $9,387 | $6,964 |
| 2025 | NA | NA | $22,246 | $1,182 | $9,488 | $7,321 |
| 2026 | NA | NA | $19,344 | $1,131 | $9,951 | NA |
| 2027 | NA | NA | NA | NA | $10,548 | NA |
| Annualized Growth | -4.36% | 62.58% | -6.43% | -2.13% | 3.93% | 7.77% |
(Source: FactSet Research Terminal)
Debt is expected to modestly roll off over time, while cash on the balance sheet is exploding higher and cash flows grow at a modest rate.
Bond Profile:
(Source: FactSet Research Terminal) (Source: FactSet Research Terminal)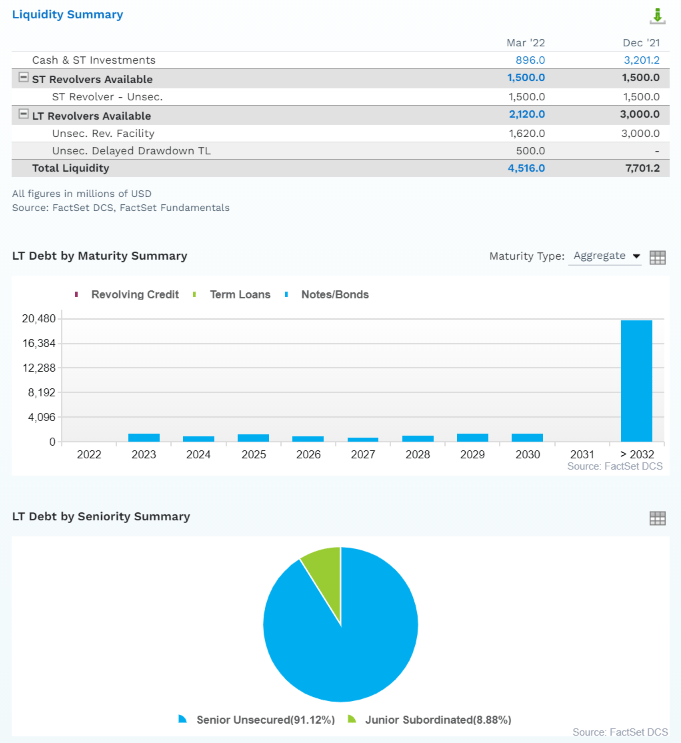
- $4.5 billion in liquidity (including buying Navitas Midstream)
- 91% unsecured bonds (very high financial flexibility)
- well-staggered bond maturities (no trouble refinancing debt)
- average debt maturity of 21 years
- over 50% of bonds 30+ year duration
- 4.23% average borrowing cost vs bond market’s 2.5% long-term inflation forecast
- EPD’s effective real interest rate is 1.76% vs 22.3% cash return on invested capital
- returns on investment are 13X its real borrowing cost
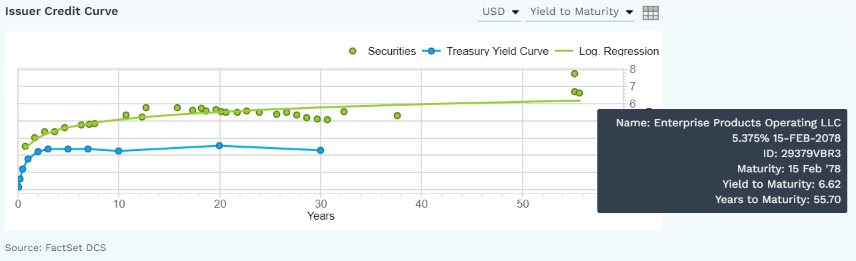
The bond market is so confident in EPD’s long-term plans its willing to lend to it for 56 years at 6.62%.
- today’s 10-year AAA-rated bonds yield 4%
Credit Default SWAPs: Real-Time Fundamental Risk Estimates From The Bond Market
(Source: FactSet Research Terminal)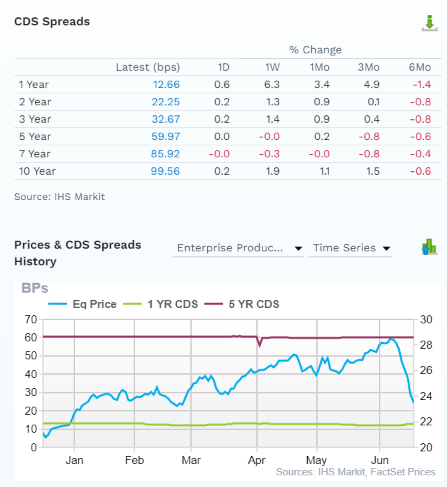
Credit default SWAPs are insurance bond investors take out against bankruptcies and defaults.
They represent a real-time fundamental risk estimate and are affected by things like breaking news, earnings updates, etc.
- EPD’s price may rise or fall but its fundamental risk is very stable
- the bond market is estimating a 3% default risk of 30 years
- treating EPD as an A-rated company
- analysts, rating agencies, the bond market, and management all agree the investment thesis is intact
EPD GF Score: The Newest Addition To The DK Safety And Quality Model
The GF Score is a ranking system that has been found to be closely correlated to the long-term performances of stocks by backtesting from 2006 to 2021.” – Gurufocus
GF Score takes five key aspects into consideration. They are:
- Financial Strength
- Profitability
- Growth
- Valuation
- Momentum
(Source: Gurufocus Premium)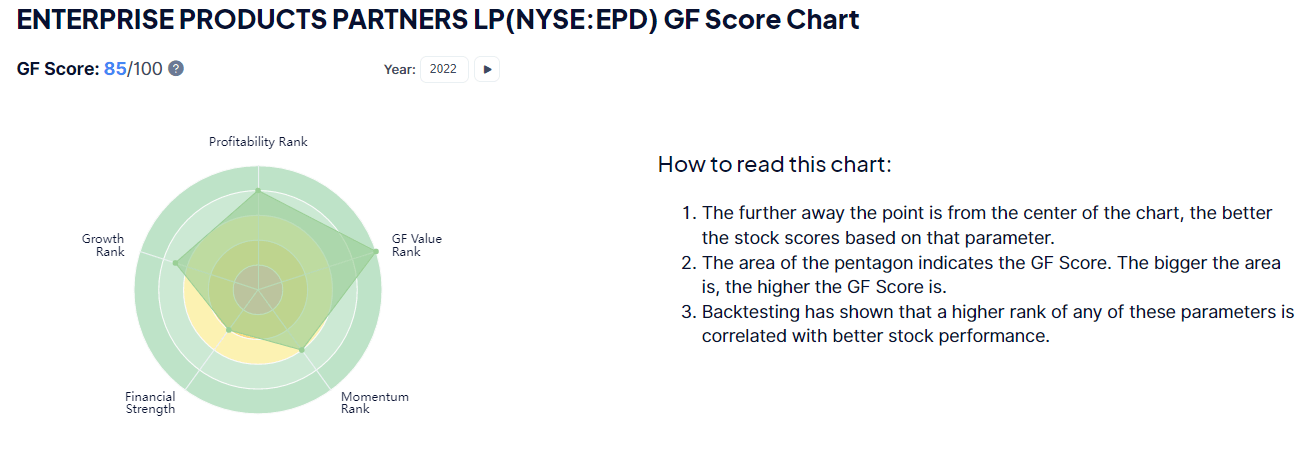
EPD’s very strong score of 85/100 GF score confirms overall very strong fundamentals.
EPD Profitability: Wall Street’s Favorite Quality Proxy
(Source: GuruFocus Premium)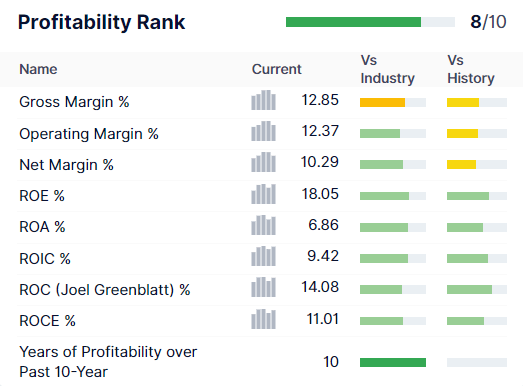
EPD historically has profitability in the top 20% of its peers.
EPD Trailing 12-Month Profitability Vs Peers
| Metric | TTM | Industry Percentile | Major Oil & Gas Companies More Profitable Than EPD (Out Of 1,116) |
| Gross Margins | 12.85% | 31.6 | 763 |
| Operating Margin | 12.37% | 61.33 | 432 |
| Net Margin | 10.29% | 65.92 | 380 |
| Return On Equity | 18.05% | 75.05 | 278 |
| Return On Assets | 6.86% | 72.67 | 305 |
| Returns On Invested Capital | 9.42% | 72.56 | 306 |
| Return On Capital (Greenblatt) | 14.08% | 63.49 | 407 |
| Return On Capital Employed | 11.01% | 64.69 | 394 |
| Average | 11.73% | 67.96 | 358 |
(Source: GuruFocus Premium)
EPD’s relative profitability is down a bit because oil & gas producers are minting money with record-high margins.
For midstream (and REITs) moatiness is defined by the asset base, management track record, and cost of capital.
EPD’s industry-leading asset base, management quality, and cost of capital give it a wide and stable moat.
Ycharts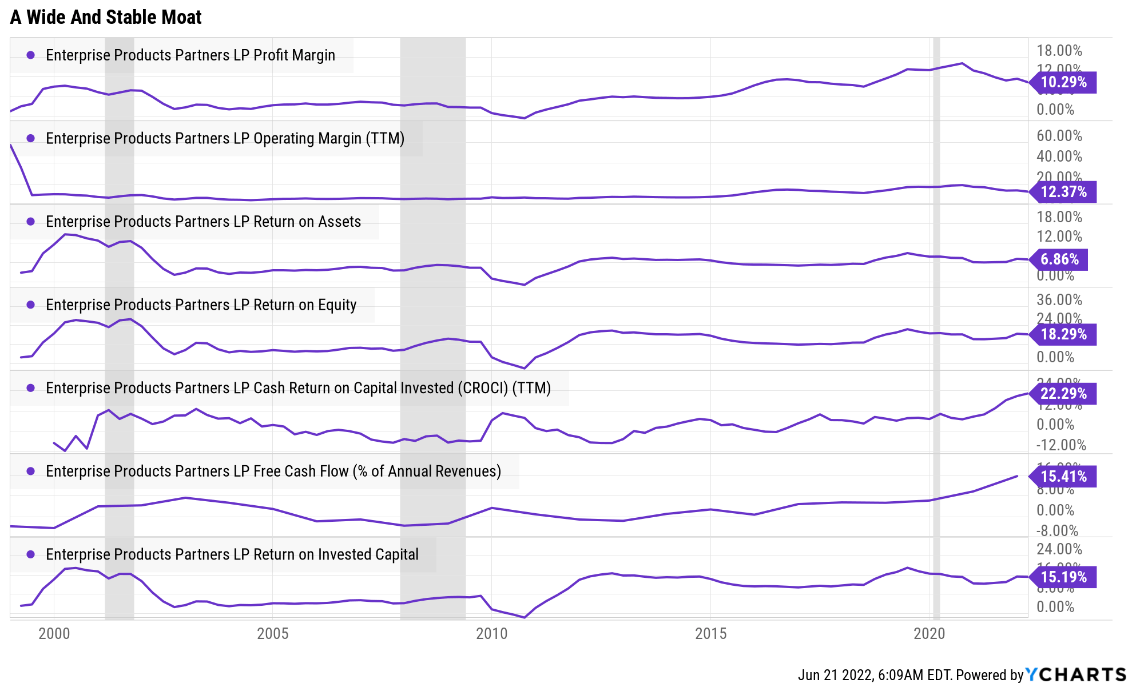
EPD’s profitability has been stable or improving for the last quarter-century.
Recent scaling back on growth spending has sent returns on invested capital and FCF margins soaring.
EPD Profit Margin Consensus Forecast
| Year | FCF Margin | EBITDA Margin | EBIT (Operating) Margin | Net Margin |
| 2020 | 9.8% | 29.6% | 18.5% | 13.9% |
| 2021 | 15.4% | 20.5% | 15.5% | 11.4% |
| 2022 | 10.3% | 18.7% | 13.9% | 11.1% |
| 2023 | 11.6% | 18.7% | 14.0% | 11.3% |
| 2024 | 14.1% | 19.3% | 14.3% | 11.6% |
| Annualized Growth | 9.44% | -10.20% | -6.27% | -4.48% |
| Annualized Growth (Post Pandemic) | -3.01% | -2.12% | -2.62% | 0.58% |
(Source: FactSet Research Terminal)
- in 2020 EPD slashed spending and created a spike in margins
Analysts expect modest margin pressure over time through 2024 though free cash flow margins are expected to remain very high, about 40% more than pre-pandemic levels.
Reason Three: Steady Growth Likely For Decades
At 6.6X cash flow EPD is priced for about -4% CAGR growth forever according to the Graham/Dodd fair value formula. Here’s what analysts actually expect.
EPD Medium-Term Growth Consensus Forecast
| Year | Sales | Free Cash Flow | EBITDA | EBIT (Operating Income) | Net Income |
| 2020 | $27,200 | $2,670 | $8,056 | $5,035 | $3,775 |
| 2021 | $40,807 | $6,297 | $8,381 | $6,315 | $4,634 |
| 2022 | $47,690 | $4,896 | $8,938 | $6,617 | $5,271 |
| 2023 | $49,102 | $5,703 | $9,165 | $6,857 | $5,530 |
| 2024 | $48,734 | $6,862 | $9,387 | $6,964 | $5,631 |
| 2025 | NA | $6,428 | $9,488 | $7,321 | $5,895 |
| 2026 | NA | $7,047 | $9,951 | NA | $6,194 |
| 2027 | NA | $6,760 | $10,548 | NA | $6,765 |
| Annualized Growth | 15.70% | 14.19% | 3.93% | 7.77% | 8.69% |
| Annualized Growth (Post Pandemic) | 6.10% | 1.19% | 3.91% | 3.76% | 6.51% |
| Cumulative Over The Next 3 Years | $145,526 | $17,461 | $27,490 | $20,438 | $16,432 |
(Source: FactSet Research Terminal)
EPD is expected to grow at a modest rate, as one would expect from an energy utility.
- $17.5 billion in total free cash flow over the next three years
EPD Distribution Growth Consensus Forecast
| Year | Distribution Consensus | FCF Consensus | FCF Payout Ratio | Retained (Post-Dividend) Free Cash Flow | Buyback Potential | Debt Repayment Potential |
| 2022 | $1.87 | $2.49 | 75.1% | $1,352 | 2.64% | 4.5% |
| 2023 | $1.94 | $2.67 | 72.7% | $1,591 | 3.11% | 5.3% |
| 2024 | $2.00 | $3.01 | 66.4% | $2,202 | 4.31% | 7.4% |
| 2025 | $2.06 | $2.99 | 68.9% | $2,027 | 3.97% | 8.1% |
| 2026 | $2.12 | $3.30 | 64.2% | $2,572 | 5.03% | NA |
| 2027 | $2.18 | $3.16 | 69.0% | $2,136 | 4.18% | NA |
| Total 2022 Through 2027 | $12.17 | $17.62 | 69.1% | $11,881.00 | 23.24% | 39.73% |
| Annualized Rate | 3.12% | 4.88% | -1.68% | 9.59% | 9.59% | #DIV/0! |
(Source: FactSet Research Terminal)
83% DCF is the safety guideline rating agencies like to see for payout ratios. EPD’s FCF payout ratio is 75% and is expected to fall to 69% by 2026
$12 billion in retained cash flow is enough to pay off 40% of current debt or buy back almost 23% of its stock at current valuations.
EPD Buyback Consensus Forecast
| Year | Consensus Buybacks ($ Millions) | % Of Shares (At Current Valuations) | Market Cap |
| 2022 | $200.0 | 0.4% | $51,132 |
| 2023 | $300.0 | 0.6% | $51,132 |
| 2024 | $300.0 | 0.6% | $51,132 |
| 2025 | $300.0 | 0.6% | $51,132 |
| 2026 | $300.0 | 0.6% | $51,132 |
| 2027 | $300.0 | 0.6% | $51,132 |
| Total 2022-2027 | $1,700.00 | 3.3% | $51,132 |
| Annualized Rate | 0.56% | Average Annual Buybacks | $283.33 |
(Source: FactSet Research Terminal)
Analysts expect a modest $300 million in annual buybacks to reduce the unit count by about 0.6% per year.
Ycharts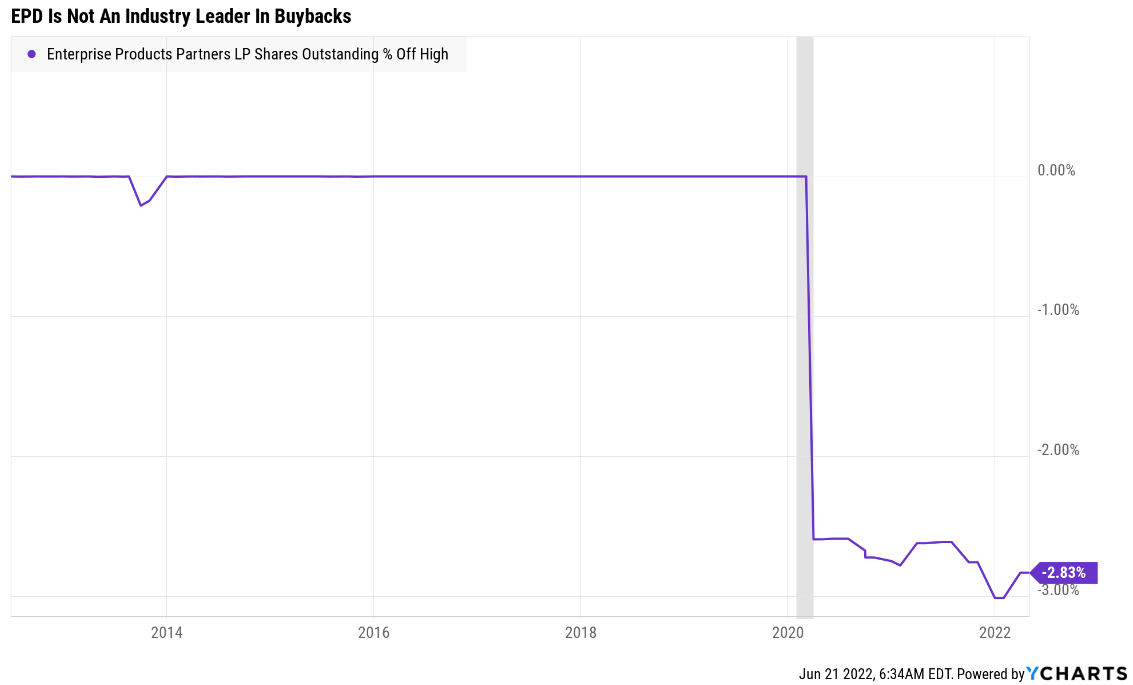
EPD’s buyback program is relatively new and less aggressive than some of its peers.
- EPD is more focused on growth spending than many other midstreams
| Time Frame (Years) | Net Buyback Rate | Shares Remaining | Net Shares Repurchased | Each Share You Own Is Worth X Times More (Not Including Future Growth And Dividends) |
| 5 | 0.6% | 97.23% | 2.77% | 1.03 |
| 10 | 0.6% | 94.54% | 5.46% | 1.06 |
| 15 | 0.6% | 91.92% | 8.08% | 1.09 |
| 20 | 0.6% | 89.38% | 10.62% | 1.12 |
| 25 | 0.6% | 86.90% | 13.10% | 1.15 |
| 30 | 0.6% | 84.50% | 15.50% | 1.18 |
(Source: DK Research Terminal, FactSet Research Terminal)
That could result in a 15% reduction in units outstanding over the next 30 years.
EPD Long-Term Growth Outlook
(Source: FactSet Research Terminal)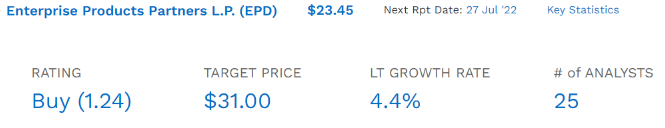
- 3.0% to 10.2% CAGR growth consensus range
- 4.4% CAGR median growth consensus
How accurate are analyst estimates on this energy utility?
FAST Graphs, FactSet FAST Graphs, FactSet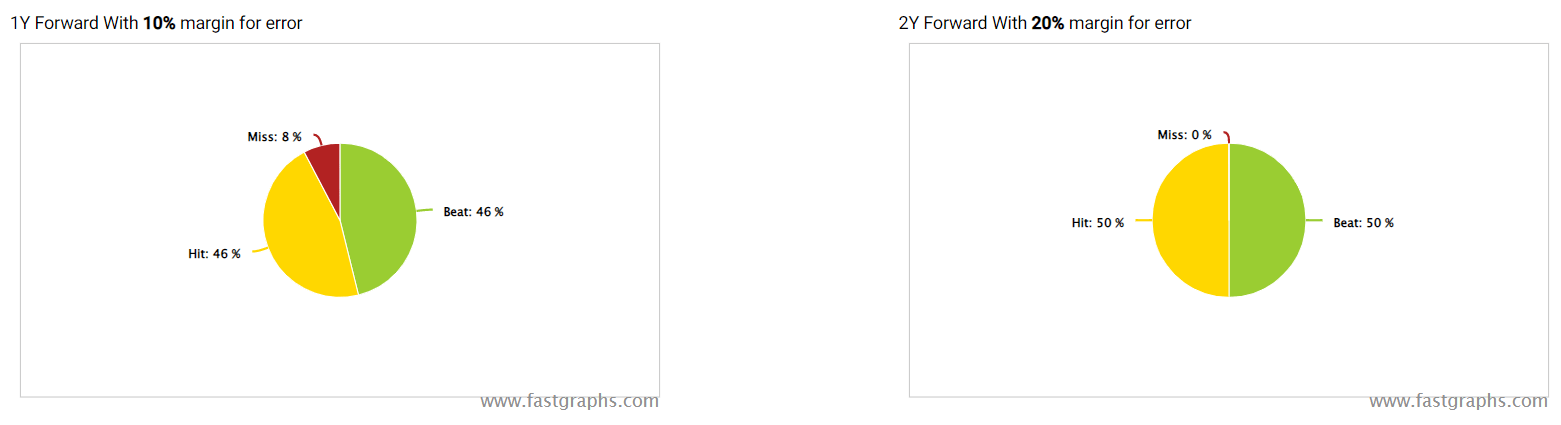
Smoothing for outliers historical analyst margins of error are 10% to the downside and 20% to the upside.
- 2% to 13% CAGR margin-of-error adjusted growth consensus range
- 70% probability that EPD grows at between 2% and 13% over time.
FAST Graphs, FactSet FAST Graphs, FactSet FAST Graphs, FactSet FAST Graphs, FactSet
Analysts expect growth similar to the last 14 years.
Reason Four: A Wonderful Company At A Wonderful Anti-Bubble Price
(Source: FAST Graphs, FactSet)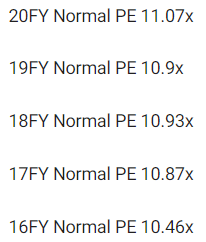
(Source: FAST Graphs, FactSet) (Source: FAST Graphs, FactSet)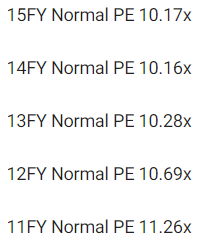
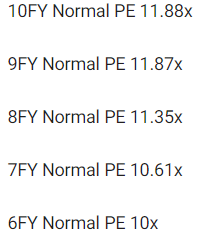
For 20 years, outside of bear markets and bubbles millions of income investors have consistently paid between 10 and 12X cash flow for EPD.
- including through the worst bear market in industry history
- including -$38 oil during the Pandemic
- 91% statistical probability that this approximates intrinsic value
| Metric | Historical Fair Value Multiples (all years) | 2021 | 2022 | 2023 | 2024 |
12-Month Forward Fair Value |
| 5-Year Average Yield | 6.84% | $26.61 | $27.19 | $27.19 | $29.24 | |
| 13-Year Median Yield | 5.88% | $30.95 | $31.63 | $31.63 | $34.01 | |
| 23-Year Average Yield | 6.67% | $27.29 | $27.89 | $27.89 | $29.99 | |
| Operating Cash Flow | 11.07 | $42.95 | $39.52 | $39.52 | $41.40 | |
| Average | $30.81 | $30.88 | $30.88 | $33.03 | $30.88 | |
| Current Price | $23.45 | |||||
|
Discount To Fair Value |
23.89% | 24.05% | 24.05% | 29.00% | 24.05% | |
|
Upside To Fair Value (NOT Including Dividends) |
31.39% | 31.67% | 31.67% | 40.85% | 31.67% (including distribution) | |
| 2022 OCF | 20223 OCF | 2022 Weighted OCF | 2023 Weighted OCF | 12-Month Forward OCF | 12-Month Average Fair Value Forward P/OCF |
Current Forward P/OCF |
| $3.57 | $3.57 | $1.92 | $1.65 | $3.57 | 8.65 | 6.57 |
I conservatively estimate EPD is worth 8.7X cash flow and today it trades at an anti-bubble 6.6X.
- pricing in -4.4% CAGR growth according to the Graham/Dodd fair value formula
- vs 4.4% median growth consensus
- How To Avoid Bubbles And Profit From “Anti-Bubbles”
- anti-bubble blue-chips are high-quality companies that are priced for negative growth
- as long as they grow at 0+% it’s nearly impossible to lose money
- as long as you avoid becoming a forced seller for emotional or financial reasons
|
Analyst Median 12-Month Price Target |
Morningstar Fair Value Estimate |
| $31.00 (8.7X cash flow) | $27.50 (7.7X cash flow) |
|
Discount To Price Target (Not A Fair Value Estimate) |
Discount To Fair Value |
| 24.35% | 14.73% |
|
Upside To Price Target (Not Including Dividend) |
Upside To Fair Value (Not Including Dividend) |
| 32.20% | 17.27% |
|
12-Month Median Total Return Price (Including Dividend) |
Fair Value + 12-Month Dividend |
| $32.86 | $29.36 |
|
Discount To Total Price Target (Not A Fair Value Estimate) |
Discount To Fair Value + 12-Month Dividend |
| 28.64% | 20.13% |
|
Upside To Price Target ( Including Dividend) |
Upside To Fair Value + Dividend |
| 40.13% | 25.20% |
Morningstar’s DCF model estimates EPD is worth 7.7X cash flow.
- zero historical justification for this estimate
- 91% statistically likely it’s too conservative
Analysts expect EPD to return to historical fair value within a year and deliver 40% total returns.
- 100% justified by fundamentals
I don’t make stock recommendations based on 12-month forecasts but on whether the margin of safety is sufficient to compensate for the risk profile.
| Rating | Margin Of Safety For Low-Risk 13/13 Super SWAN quality companies | 2022 Price | 2023 Price |
12-Month Forward Fair Value |
| Potentially Reasonable Buy | 0% | $30.88 | $30.88 | $30.88 |
| Potentially Good Buy | 5% | $29.33 | $29.33 | $29.33 |
| Potentially Strong Buy | 15% | $26.24 | $26.24 | $26.24 |
| Potentially Very Strong Buy | 25% | $22.00 | $23.16 | $23.16 |
| Potentially Ultra-Value Buy | 35% | $20.07 | $20.07 | $20.07 |
| Currently | $23.45 | 24.05% | 24.05% | 24.05% |
| Upside To Fair Value (Not Including Dividends) | 31.67% | 31.67% | 31.67% |
For anyone comfortable with its risk profile and K-1 tax form, EPD is a potentially strong buy and 1% above its very strong buy price.
Risk Profile: Why Enterprise Isn’t Right For Everyone
There are no risk-free companies and no company is right for everyone. You have to be comfortable with the fundamental risk profile.
What Could Cause EPD’s Investment Thesis To Break
- safety falls to 40% or less
- balance sheet collapses (highly unlikely, 5% probability according to rating agencies)
- green energy transition plans collapse
- growth outlook falls to less than 0.1% for seven years
- EPD’s role in my portfolio is to deliver long-term 8+% returns with minimal fundamental risk
- 8+% total return requirement for defensive sectors (energy utility)
- 10+% for non-defensive (cyclical) sectors – like financials
How long it takes for a company’s investment thesis to break depends on the quality of the company.
| Quality |
Years For The Thesis To Break Entirely |
| Below-Average | 1 |
| Average | 2 |
| Above-Average | 3 |
| Blue-Chip | 4 |
| SWAN | 5 |
| Super SWAN | 6 |
| Ultra SWAN | 7 |
| 100% Quality Companies (MSFT, LOW, and MA) | 8 |
These are my personal rule of thumb for when to sell a stock if the investment thesis has broken. EPD is highly unlikely to suffer such catastrophic declines in fundamentals.
EPD’s Risk Profile Includes
- heavy bet on NGLs (nearly 85% of growth budget)
- regulatory/political risk (pertaining to interstate projects)
- litigation risk (pertaining to interstate projects and industrial accidents)
- industrial accident risk (can cost over $1 billion each to clean up)
- green energy transition execution risk
- M&A execution risk
- talent retention risk
- supply chain disruption risk (causing havoc globally right now)
- cyber security risk: hackers and ransomware (pipelines are now targets)
- virtually no say in how the LP is run
How do we quantify, monitor, and track such a complex risk profile? By doing what big institutions do.
Long-Term Risk Analysis: How Large Institutions Measure Total Risk
- see the risk section of this video to get an in-depth view (and link to two reports) of how DK and big institutions measure long-term risk management by companies
| Rating Agency | Industry Percentile |
Rating Agency Classification |
| Morningstar/Sustainalytics 20 Metric Model | 94.4% |
21.5/100 Medium-Risk |
| Reuters’/Refinitiv 500+ Metric Model | 53.8% | Average |
| FactSet | 50.0% |
Average, Positive Trend |
| Morningstar Global Percentile (All 15,000 Rated Companies) | 70.6% | Good |
| Consensus | 67% |
Low-Risk, Above-Average Risk-Management, Stable Trend |
(Sources: Morningstar, FactSet, Reuters)
EPD’s Long-Term Risk Management Is The 205th Best In The Master List (59th Percentile)
| Classification | Average Consensus LT Risk-Management Industry Percentile |
Risk-Management Rating |
| S&P Global (SPGI) #1 Risk Management In The Master List | 94 | Exceptional |
| Strong ESG Stocks | 78 |
Good – Bordering On Very Good |
| Foreign Dividend Stocks | 75 | Good |
| Ultra SWANs | 71 | Good |
| Low Volatility Stocks | 68 | Above-Average |
| Enterprise Products Partners | 67 | Above-Average |
| Dividend Aristocrats | 67 | Above-Average |
| Dividend Kings | 63 | Above-Average |
| Master List average | 62 | Above-Average |
| Hyper-Growth stocks | 61 | Above-Average |
| Monthly Dividend Stocks | 60 | Above-Average |
| Dividend Champions | 57 | Average |
(Source: DK Research Terminal)
EPD’s risk-management consensus is in the top 41% of the world’s highest quality companies and similar to that of such other blue-chips as
- Cardinal Health (CAH) – dividend aristocrat
- PPG Industries (PPG) – dividend aristocrat
- Hormel Foods (HRL) – dividend king
- Archer-Daniels-Midland (ADM) – dividend aristocrat
- Alphabet (GOOG)
- Eli Lilly (LLY)
The bottom line is that all companies have risks, and EPD is above-average at managing theirs.
How We Monitor EPD’s Risk Profile
- 25 analysts
- 3 credit rating agencies
- 6 total risk rating agencies
- 31 experts who collectively know this business better than anyone other than management
- the bond market provides real-time fundamental risk-assessments
When the facts change, I change my mind. What do you do sir?” – John Maynard Keynes
There are no sacred cows at iREIT or Dividend Kings. Wherever the fundamentals lead we always follow. That’s the essence of disciplined financial science, the math behind retiring rich and staying rich in retirement.
Bottom Line: Enterprise Is Likely Set To Soar And Too Cheap To Ignore
I can’t tell you when this bear market will end, no one can. The best economist teams in the world can only update their models and use historical bear market valuations as a guide.
I can’t tell you when oil will stop falling, or energy stocks like EPD.
Could it fall a lot more? Quite possibly, especially if we get a recession next year.
| Time Frame | Historically Average Bear Market Bottom |
| Non-Recessionary Bear Markets Since 1965 | -21% (Achieved May 20th) |
| Median Recessionary Bear Market Since WWII | -24% (Citigroup base case with a mild recession) June 16th |
| Non-Recessionary Bear Markets Since 1928 | -26% (Goldman Sachs base case with a mild recession) |
| Average Bear Markets Since WWII | -30% (Morgan Stanley base case) |
| Recessionary Bear Markets Since 1965 | -36% (Bank of America recessionary base case) |
| All 140 Bear Markets Since 1792 | -37% |
| Average Recessionary Bear Market Since 1928 |
-40% (Deutsche Bank, Bridgewater, SocGen Severe Recessionary base case, Morgan Stanley Recessionary Base Case) |
|
(Sources: Ben Carlson, Bank of America, Oxford Economics, Goldman Sachs) |
But here’s what I can tell you with 80% confidence.
- EPD is one of the world’s safest, most dependable, and highest quality companies on earth
- the safety and quality king of midstream
- 7.9% very safe yield
- 12.3% CAGR long-term return consensus
- 24% discount to fair value = potential very strong buy
- 6.6X cash flow – anti-bubble valuation
- about 150% consensus return potential over the next five years, 18% CAGR, 2.5X more than the S&P 500
- about 1.5X better risk-adjusted expected returns of the S&P 500 over the next five years
What if I’m wrong and the market reprices EPD permanently lower?
What if ESG, the MLP structure, and a recession in 2023 resulting in oil falling to under $65 cause EPD to trade at 7X cash flow forever?
While I consider that a low probability risk, it’s not zero. But guess what?
Over the very long-term, 30+ years, a study from fidelity finds that just two things determine total return, and valuation isn’t one of them.
Fidelity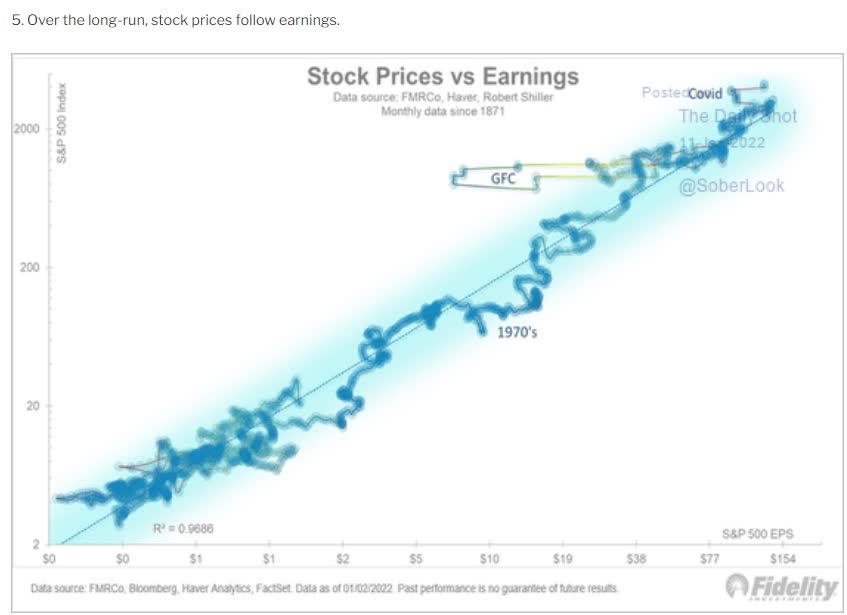
Starting yield + growth determines 97% of long-term market returns.
In other words, buy EPD for the very safe 8.1% yield today, and 4.4% consensus growth driven 12.5% long-term total returns in the years to come.
If EPD returns to historical fair value, then those Buffett-like returns in the short to medium-term are the cherry on top.
But I personally don’t care about capital gains, because EPD is as close to a buy-and-hold forever ultra-high-yield blue-chip as you can find on Wall Street.
Whether or not we get a recession in 2023, anyone buying EPD at today’s deeply discounted price can sleep well at night knowing their hard-earned savings are being managed by one of the best risk-management teams in all of corporate America.
Enterprise’s management team is a chess master in an industry where everyone else is playing checkers.” – Morningstar
Be the first to comment