

Jose Luis Pelaez Inc
The 2022 bear market has created potentially life-changing opportunities for long-term investors.
That’s not to say that it’s over. Morgan Stanley’s Chief Investment Officer, Mike Wilson, just provided his latest weekly update:
- inflation has likely peaked (great news)
- bond yields are close to peaking or have peaked (more great news)
- a potential 7th bear market rally has started
- which could take the S&P to 4,000 to 4,150 by year end (up to an 18% rally)
- Q4 earnings season is when poor 2023 guidance causes earnings estimates to finally bottom
- and the stock market finally bottoms around 3,000 to 3,200 in five to eight months
So far in 2022 Mike Wilson has nailed it, but he’s not infallible, and that’s why I’m still eager to buy and recommend the world’s best blue-chip bargains.
Ben Carlson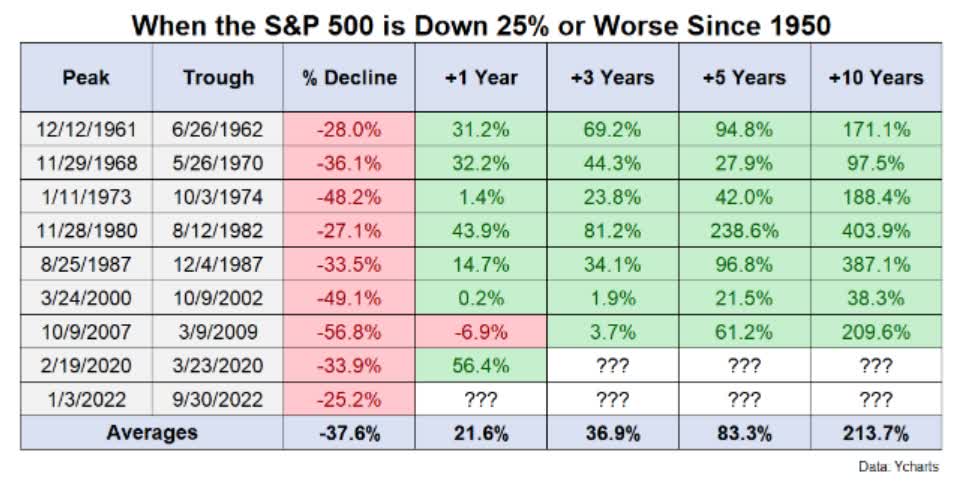
This table measures from the first time the S&P hits -25% from record highs. Even though stocks usually keep falling for a few more months, the average 12-month return is +22%.
If Morgan Stanley is right, and long-term interest rates come crashing down next year, stocks could be in for a strong rally.
- one of the best returns for a 60/40 portfolio in history
And while stocks are a great buy right now, no matter where they ultimately bottom, world-class dividend growth stocks like Lowe’s (NYSE:LOW) MIGHT have already bottomed.
So let me show you the three reasons why I consider LOW’s my highest priority dividend stock, and a no-brainer long-term buy.
One that could potentially more than triple in the next five years, and possibly deliver close to 40X inflation-adjusted returns over the next 20 years.
Reason One: Lowe’s Is One Of The Highest Quality Dividend Stocks On Earth
Here is the bottom line up front on LOW.
YCharts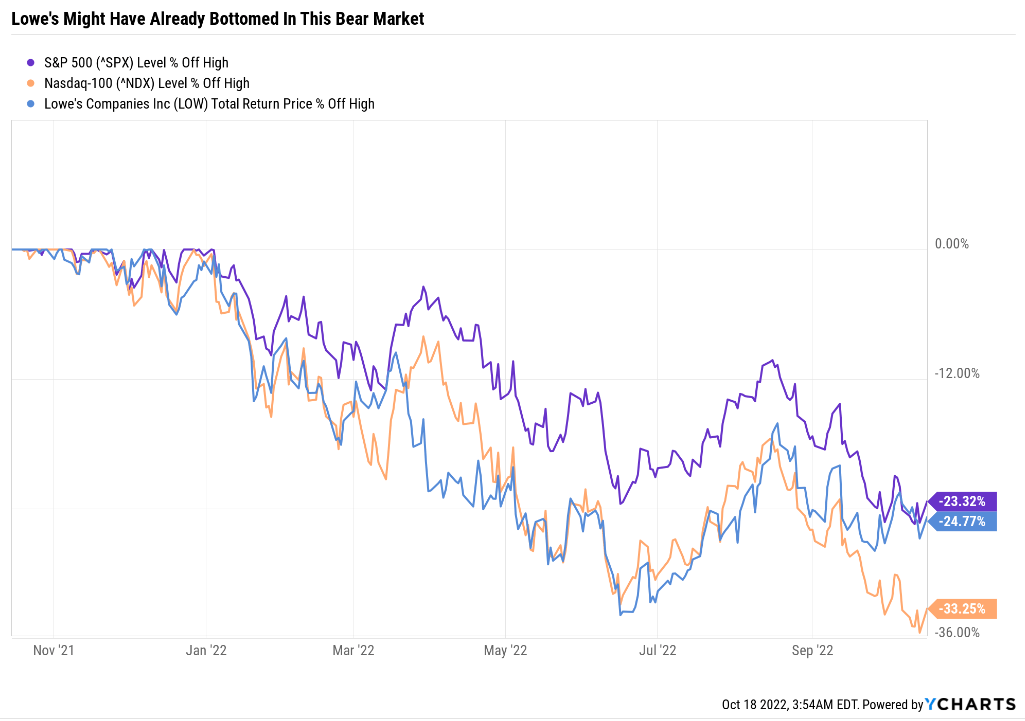
LOW is up nicely off its June lows, and potentially those lows will hold even if the market falls further.
LOW’s June PE Is Consistent With Recessionary Bear Market Trough PEs
(Source: FAST Graphs, FactSet)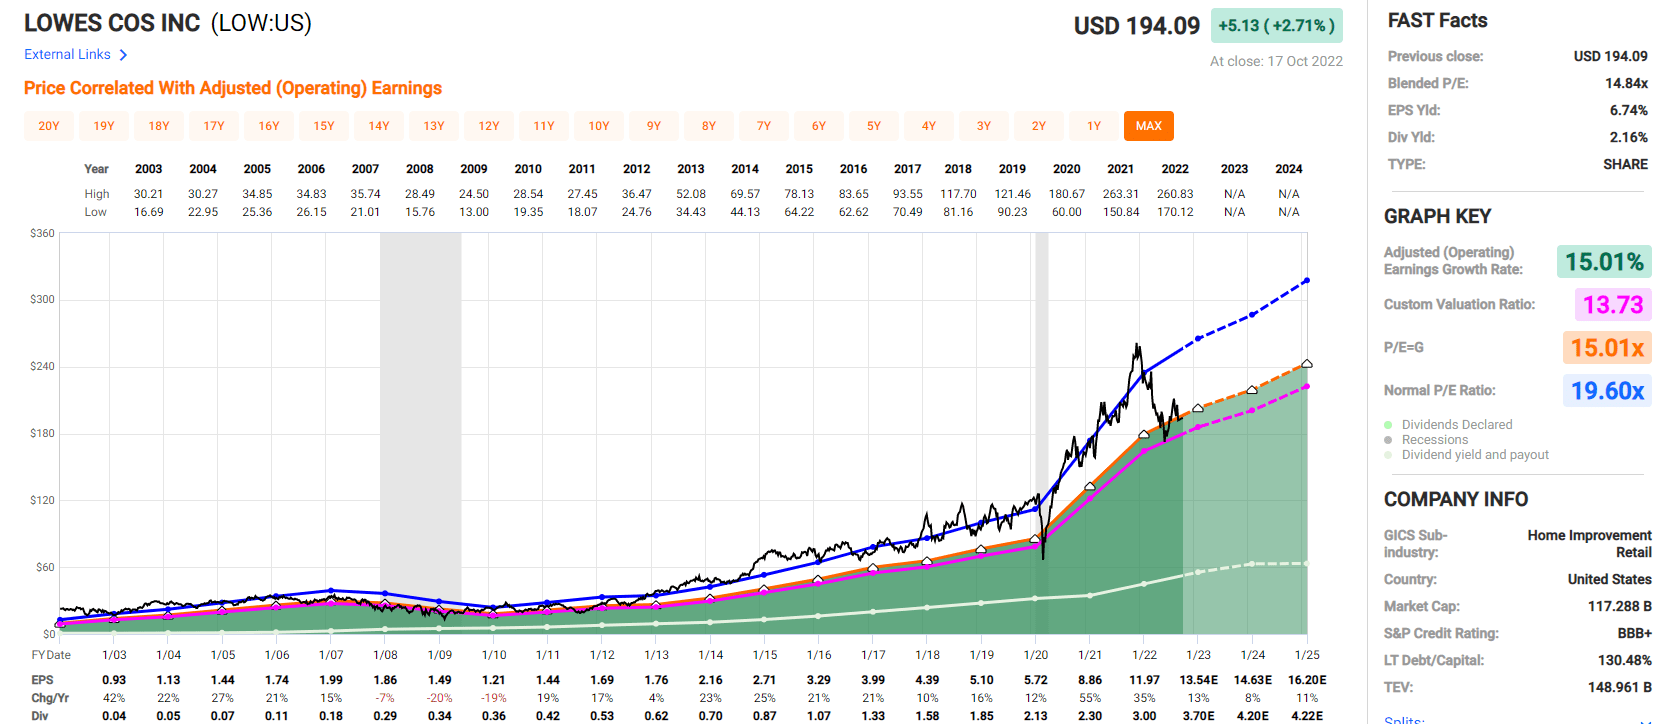
Meanwhile, the investment thesis remains firmly intact.
Wide-Moat Lowe’s on Track to Bolster Its Operating Margin Profile Through Productivity Initiatives – Morningstar.
LOW’s hired Marvin Ellison as CEO to catch up to HD regarding profitability.
(Source: investor presentation)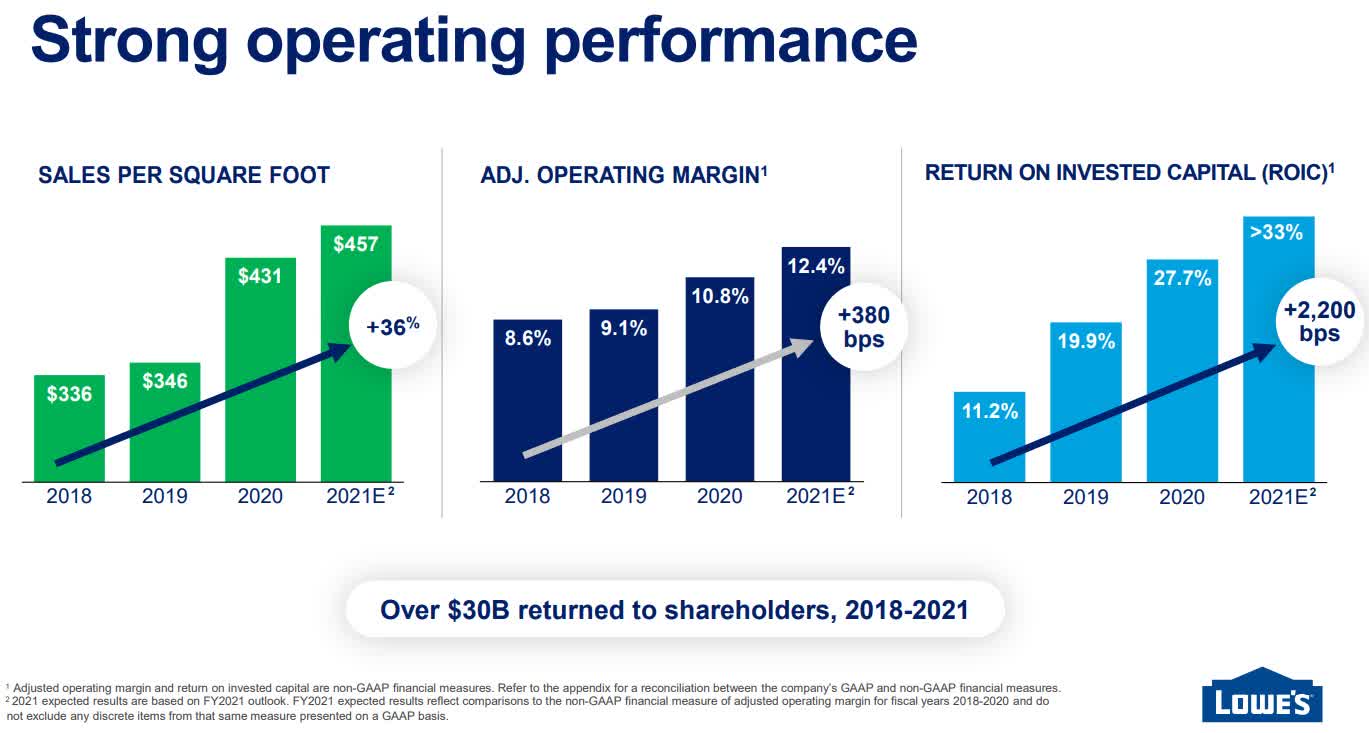
The company has a detailed plan that Wall Street has a lot of confidence in to significantly streamline its operations and improve margins and returns on capital.
(Source: investor presentation)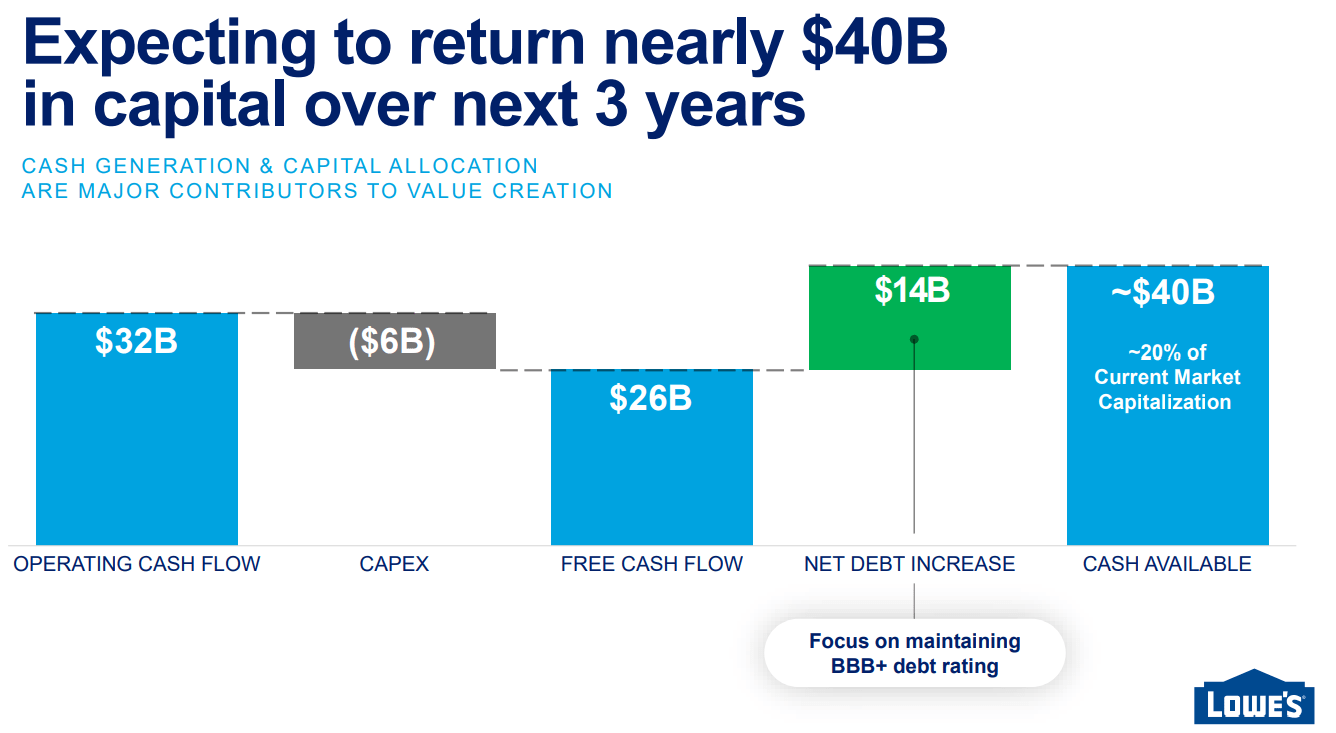
All while being very generous with buybacks and dividends and maintaining a very safe dividend for which it’s so famous.
(Source: investor presentation)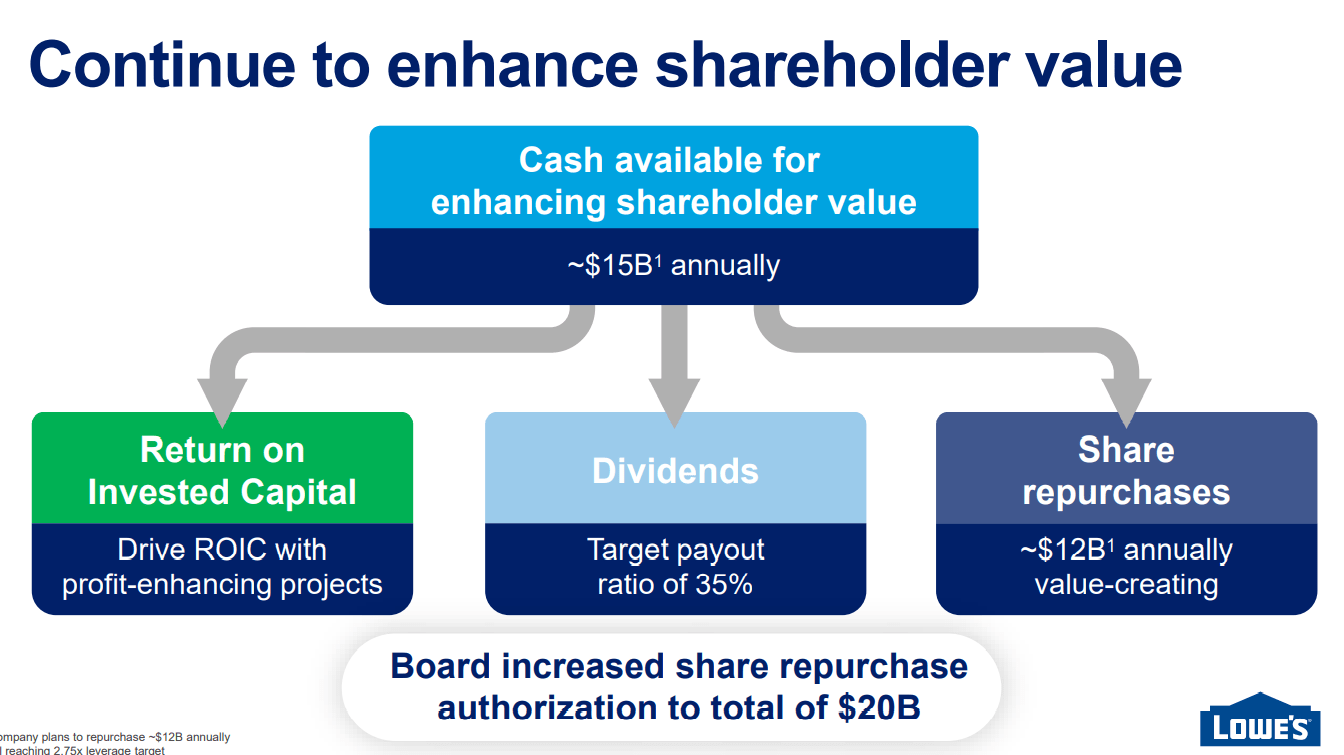
That includes a 35% EPS payout ratio target and buybacks of about $12 billion per year, or roughly 10% of shares outstanding at current valuations.
LOW’s Credit Ratings
| Rating Agency | Credit Rating | 30-Year Default/Bankruptcy Risk | Chance of Losing 100% Of Your Investment 1 In |
| S&P | BBB+ stable | 5.00% | 20.0 |
| Moody’s | Baa1 (BBB+ equivalent) stable | 5.00% | 20.0 |
| DBRS | BBB High (BBB+ Equivalent) | 5.00% | 20.0 |
| Consensus | BBB+ stable | 5.00% | 20.0 |
(Source: S&P, Moody’s)
Management plans to target a leverage ratio of 2.75X over the long term, Vs. a 3.0X or less safe guideline from rating agencies.
(Source: FactSet Research Terminal) (Source: FactSet Research Terminal) (Source: FactSet Research Terminal)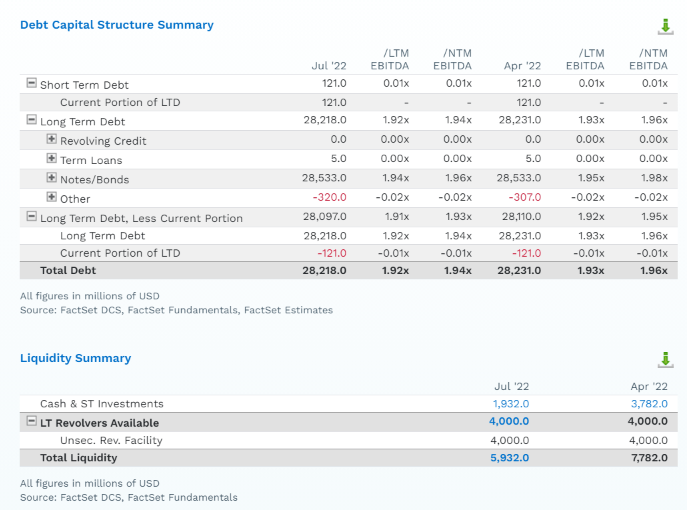
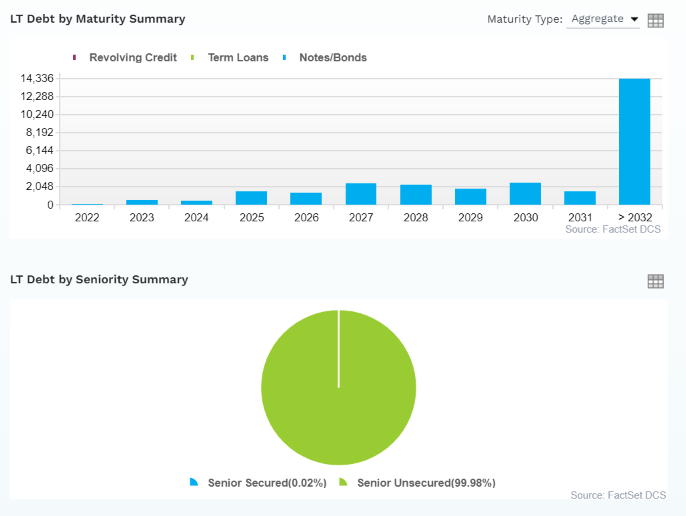
LOW has almost $6 billion in liquidity, with very little debt maturing in 2023 and 2024 (possible recession years).
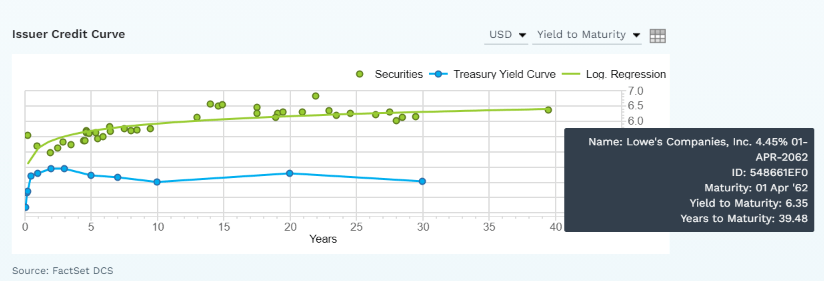
The bond market is so confident in LOW’s plans they are willing to lend to it for nearly 40 years at reasonable interest rates.
(Source: FactSet Research Terminal)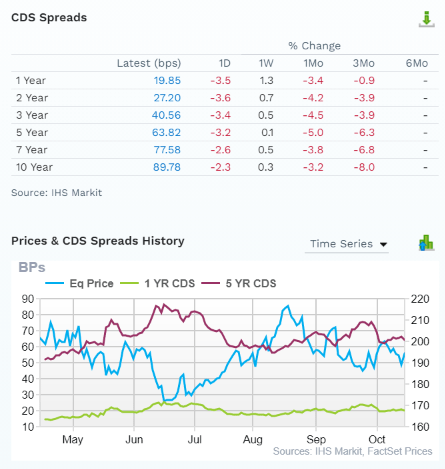
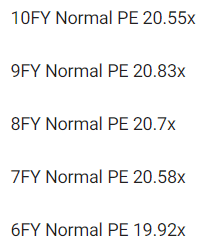
The bond market treats LOW as an A-rated company with a 2.7% 30-year bankruptcy risk, which has been relatively stable over the last six months.
- fundamental risk is usually much more stable than stock prices would have you believe
Reasons To Potentially LOW Today
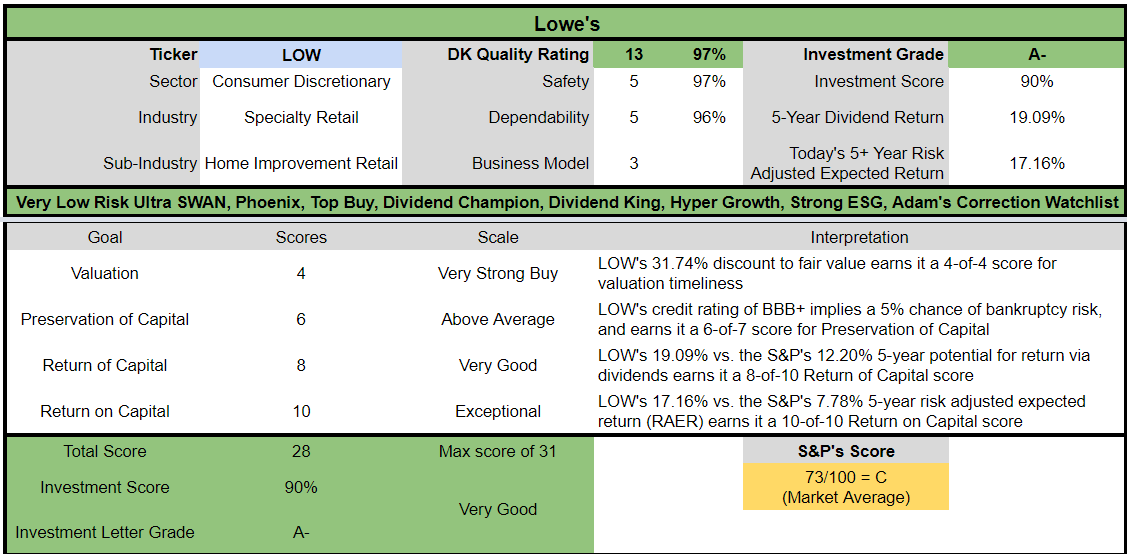
| Metric | Lowe’s |
| Quality | 97% 13/13 Quality Ultra SWAN (Sleep Well At Night) Dividend King |
| Risk Rating | Very Low Risk |
| DK Master List Quality Ranking (Out Of 500 Companies) | 20 |
| Quality Percentile | 96% |
| Dividend Growth Streak (Years) | 60 |
| Dividend Yield | 2.20% |
| Dividend Safety Score | 97% |
| Average Recession Dividend Cut Risk | 0.5% |
| Severe Recession Dividend Cut Risk | 1.15% |
| S&P Credit Rating | BBB+ Stable |
| 30-Year Bankruptcy Risk | 5.00% |
| LT S&P Risk-Management Global Percentile | 86% Very Good |
| Fair Value | $284.34 |
| Current Price | $194.09 |
| Discount To Fair Value | 32% |
| DK Rating |
Potentially Very Strong Buy |
| PE | 13.7 |
| Cash-Adjusted PE | 11.0 |
| Growth Priced In | 5.0% |
| Historical PE | 19 to 21 |
| LT Growth Consensus/Management Guidance | 20.1% |
| PEG Ratio | 0.55 (hyper-growth at a wonderful price) |
| 5-year consensus total return potential |
20% to 26% CAGR |
| Base Case 5-year consensus return potential |
24% CAGR (3X the S&P 500) |
| Consensus 12-month total return forecast | 44% |
| Fundamentally Justified 12-Month Return Potential | 49% |
| LT Consensus Total Return Potential | 22.3% |
| Inflation-Adjusted Consensus LT Return Potential | 20.0% |
| Consensus 10-Year Inflation-Adjusted Total Return Potential (Ignoring Valuation) | 6.20 |
| LT Risk-Adjusted Expected Return | 14.83% |
| LT Risk-And Inflation-Adjusted Return Potential | 12.54% |
| Conservative Years To Double | 5.74 Vs 15.2 S&P |
(Source: Dividend Kings Zen Research Terminal)
Even after a nice rally, LOW is trading at 11X cash-adjusted earnings and a 0.55 PEG ratio.
Analysts think it will deliver 44% returns within a year, and 49% returns would be fundamentally justified.
LOW 2025 Consensus Total Return Potential
(Source: FAST Graphs, FactSet)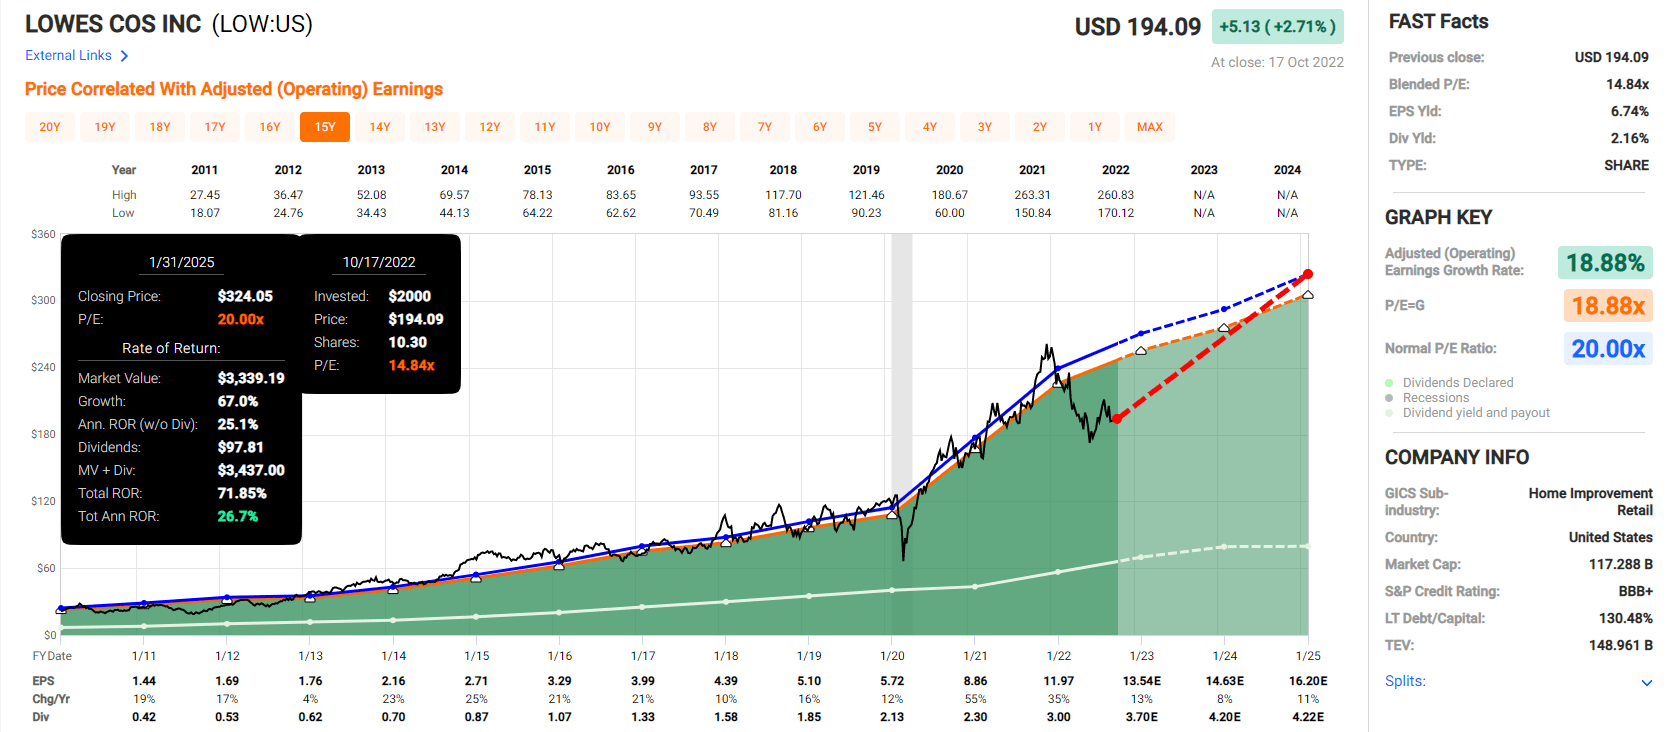
LOW is offering the potential for 27% annual returns through Jan 2025 4 if it grows as expected and returns to historical fair value.
- about 2X more than the S&P 500
LOW 2028 Consensus Total Return Potential
(Source: FAST Graphs, FactSet)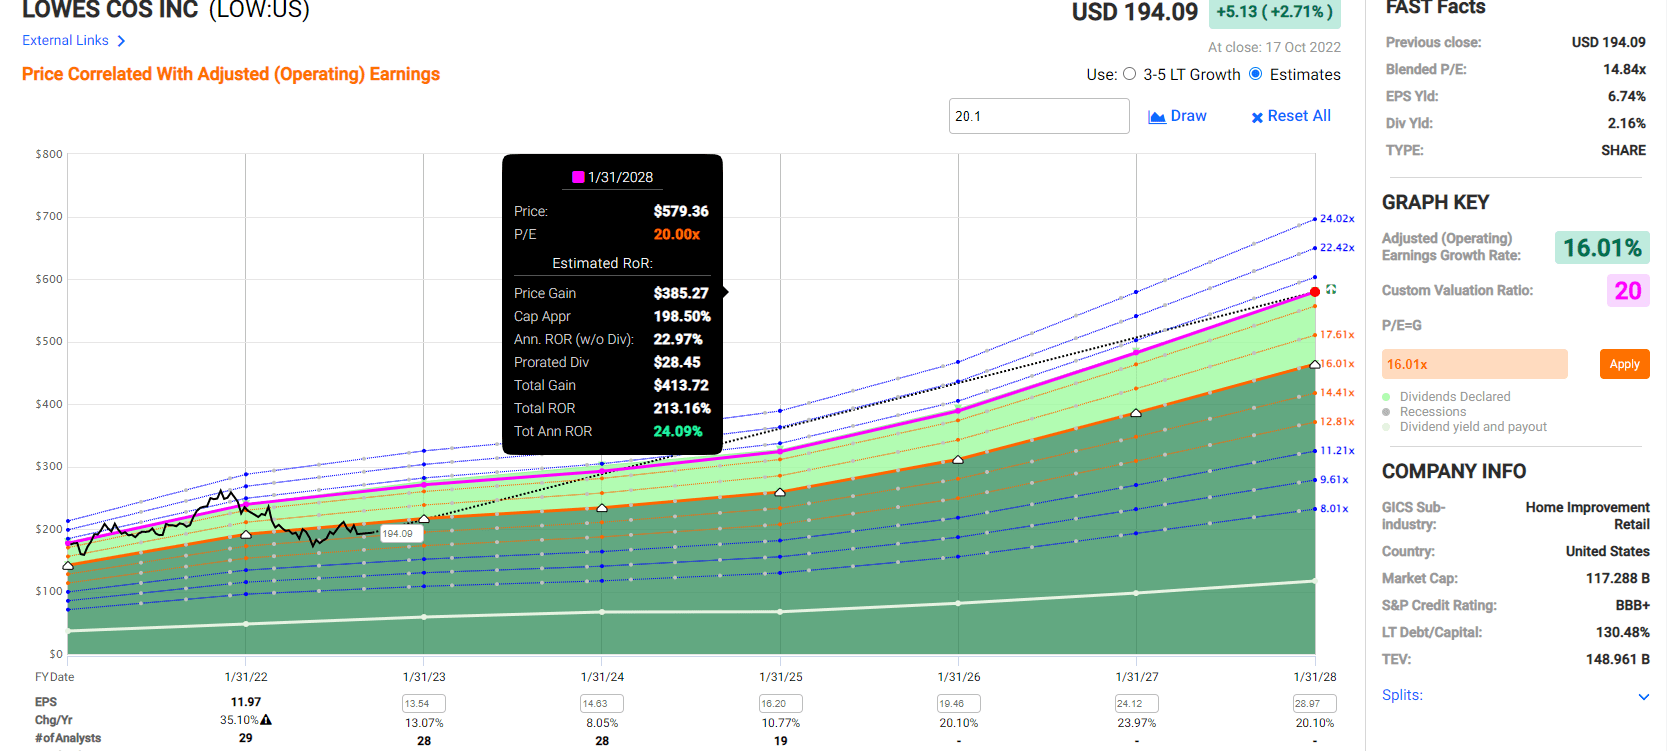
If LOW grows as expected and returns to fair value by 2025, it could triple with 24% annual returns.
- about 3X the total return potential of the S&P 500
LOW Corp Investment Decision Tool
DK (Source: Dividend Kings Automated Investment Decision Tool)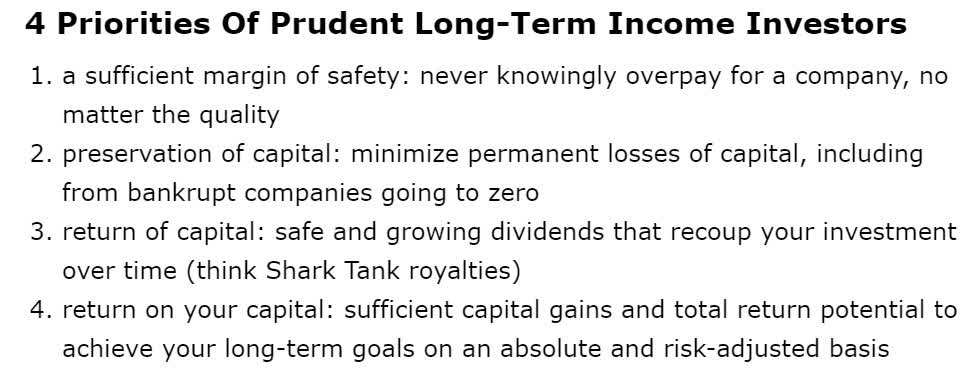
LOW is a potentially excellent deep-value Ultra SWAN dividend king opportunity for anyone comfortable with its risk profile. Look at how it compares to the S&P 500.
- 32% discount to fair value vs. 7% S&P = 25% better valuation
- 2.2% very safe yield vs. 1.8% S&P (and growing at 17% CAGR)
- 120% higher annual long-term return potential
- more than 2X higher risk-adjusted expected returns
- almost 2X the consensus 5-year income
Reason Two: 20 Years Of Potential Hyper-Growth Ahead
Lowe’s 11X cash-adjusted PE implies LOW’s is priced for 5% CAGR long-term growth but take a look at what analysts expect.
| Metric | 2021 Growth | 2022 Growth Consensus |
2023 Growth Consensus (Potential Recession Year) |
2024 Growth Consensus (Potential Recession Year) | 2025 Growth Consensus | 2026 Growth Consensus |
2027 Growth Consensus |
| Sales | 29% | 15% | 13% | 1% | 3% | 5% | 4% |
| Dividend | 9% | 33% | 31% (Official) | 11% | 5% | 32% | 29% |
| EPS | 55% | 35% | 13% | 8% | 11% | 21% | 22% |
| Operating Cash Flow | 167% | -2% | 25% | 0% | 12% | NA | NA |
| Free Cash Flow | 242% | -4% | 25% | -4% | 14% | 14% | 14% |
| EBITDA | 59% | 21% | 11% | 2% | 5% | NA | NA |
| EBIT (operating income) | 72% | 21% | 16% | 2% | 5% | NA | NA |
(Source: FAST Graphs, FactSet)
After a modest slowdown in the recession years, LOW’s growth is expected to re-accelerate back to 20%.
The dividend is expected to grow at 17% CAGR through 2027.
- about 3X faster than the S&P 500
LOW Long-Term Growth Outlook
(Source: FactSet Research Terminal)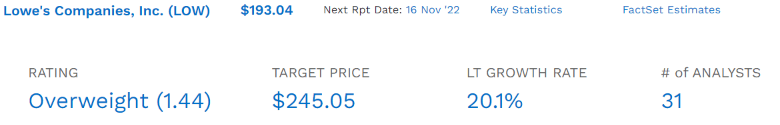
- 9.4% to 20.1% CAGR growth consensus range (from four sources)
- 20.1% CAGR median growth consensus from all 31 analysts
(Source: FAST Graphs, FactSet)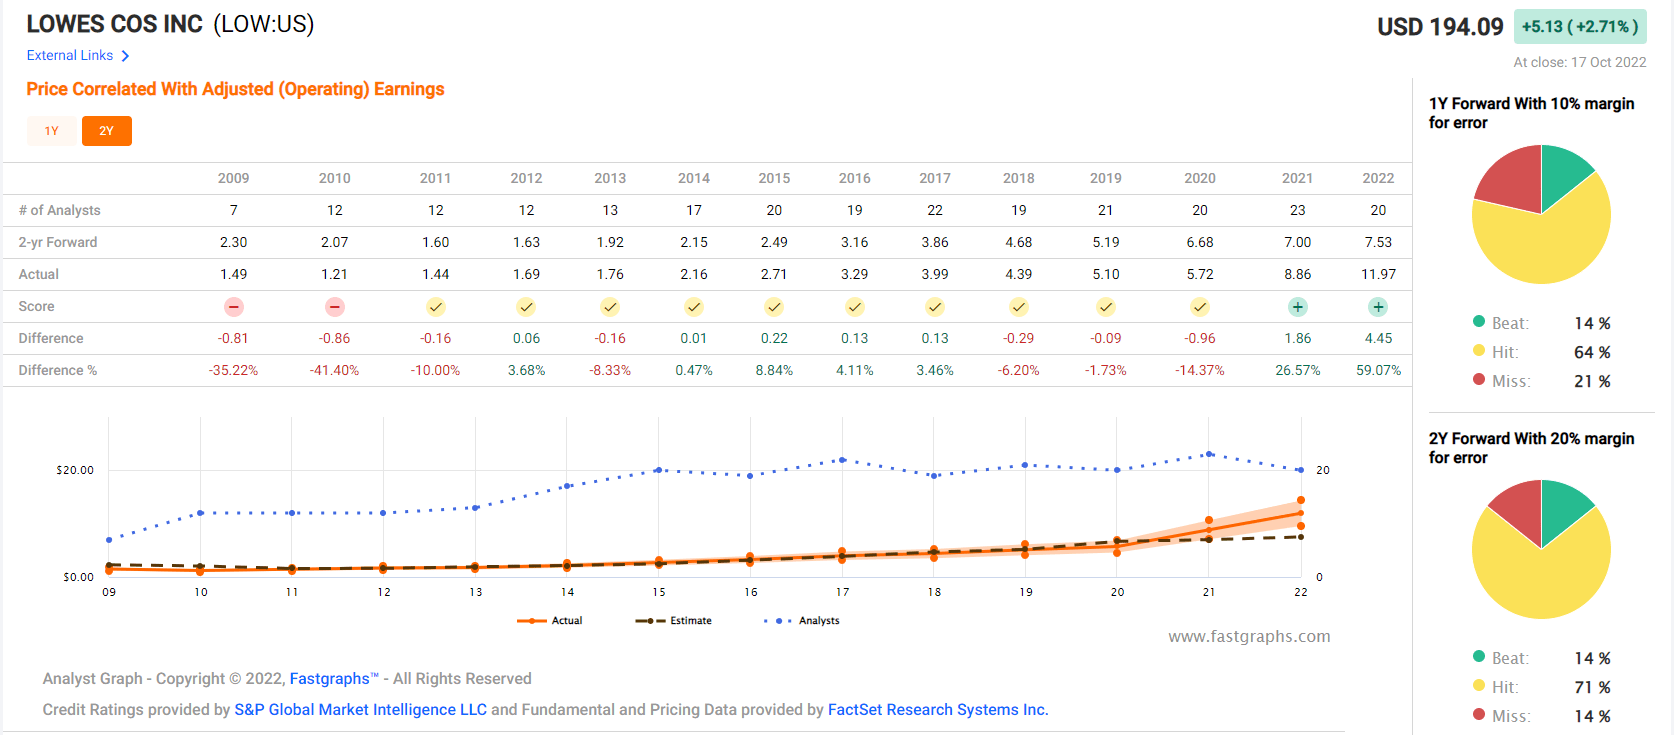
Smoothing for outliers analyst historical margins of error are 10% to the downside and 5% to the upside.
- 7% to 22% CAGR margin-of-error growth adjusted range
- vs. 5% growth priced in
(Source: FAST Graphs, FactSet Research Terminal) (Source: FAST Graphs, FactSet Research Terminal) (Source: FAST Graphs, FactSet Research Terminal) (Source: FAST Graphs, FactSet Research Terminal)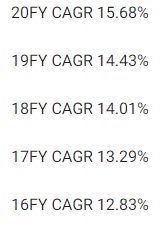
Morgan Stanley expects a 20-year secular housing boom thanks to 150 million Millennials and Gen Z entering household formation.
This could help LOW maintain the same growth rate as the last 12 years, which is what analysts are currently expecting.
| Investment Strategy | Yield | LT Consensus Growth | LT Consensus Total Return Potential | Long-Term Risk-Adjusted Expected Return | Long-Term Inflation And Risk-Adjusted Expected Returns | Years To Double Your Inflation & Risk-Adjusted Wealth |
10-Year Inflation And Risk-Adjusted Expected Return |
| Lowe’s | 2.2% | 20.1% | 22.3% | 15.6% | 13.3% | 5.4 | 3.50 |
| Schwab US Dividend Equity ETF | 3.8% | 8.50% | 12.3% | 8.6% | 6.3% | 11.4 | 1.85 |
| Nasdaq | 0.8% | 11.5% | 12.3% | 8.6% | 6.3% | 11.4 | 1.85 |
| Dividend Aristocrats | 2.8% | 8.7% | 11.5% | 8.1% | 5.8% | 12.5 | 1.75 |
| S&P 500 | 1.8% | 8.5% | 10.3% | 7.2% | 4.9% | 14.6 | 1.62 |
(Source: DK Research Terminal, FactSet, Morningstar, YCharts)
LOW has the potential to outperform the most popular investing strategies. Not just the high-yield, the S&P, aristocrats, and even the Nasdaq.
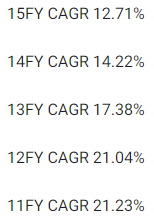
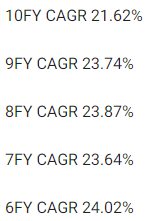
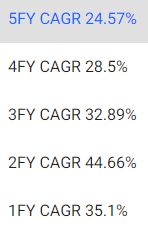
LOW Historical Returns Since 1985
(Source: Portfolio Visualizer Premium) (Source: Portfolio Visualizer Premium) (Source: Portfolio Visualizer Premium)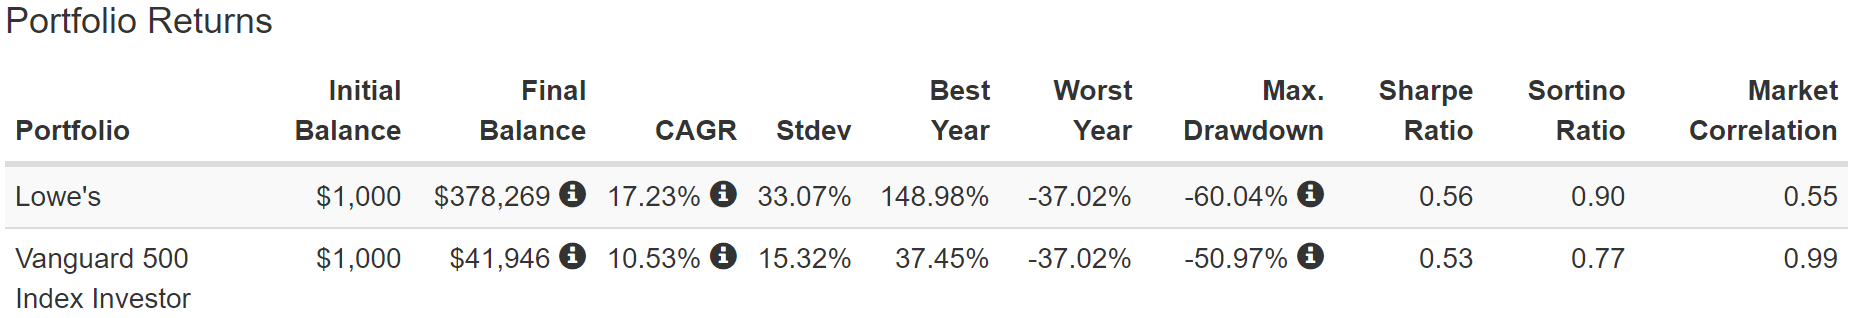
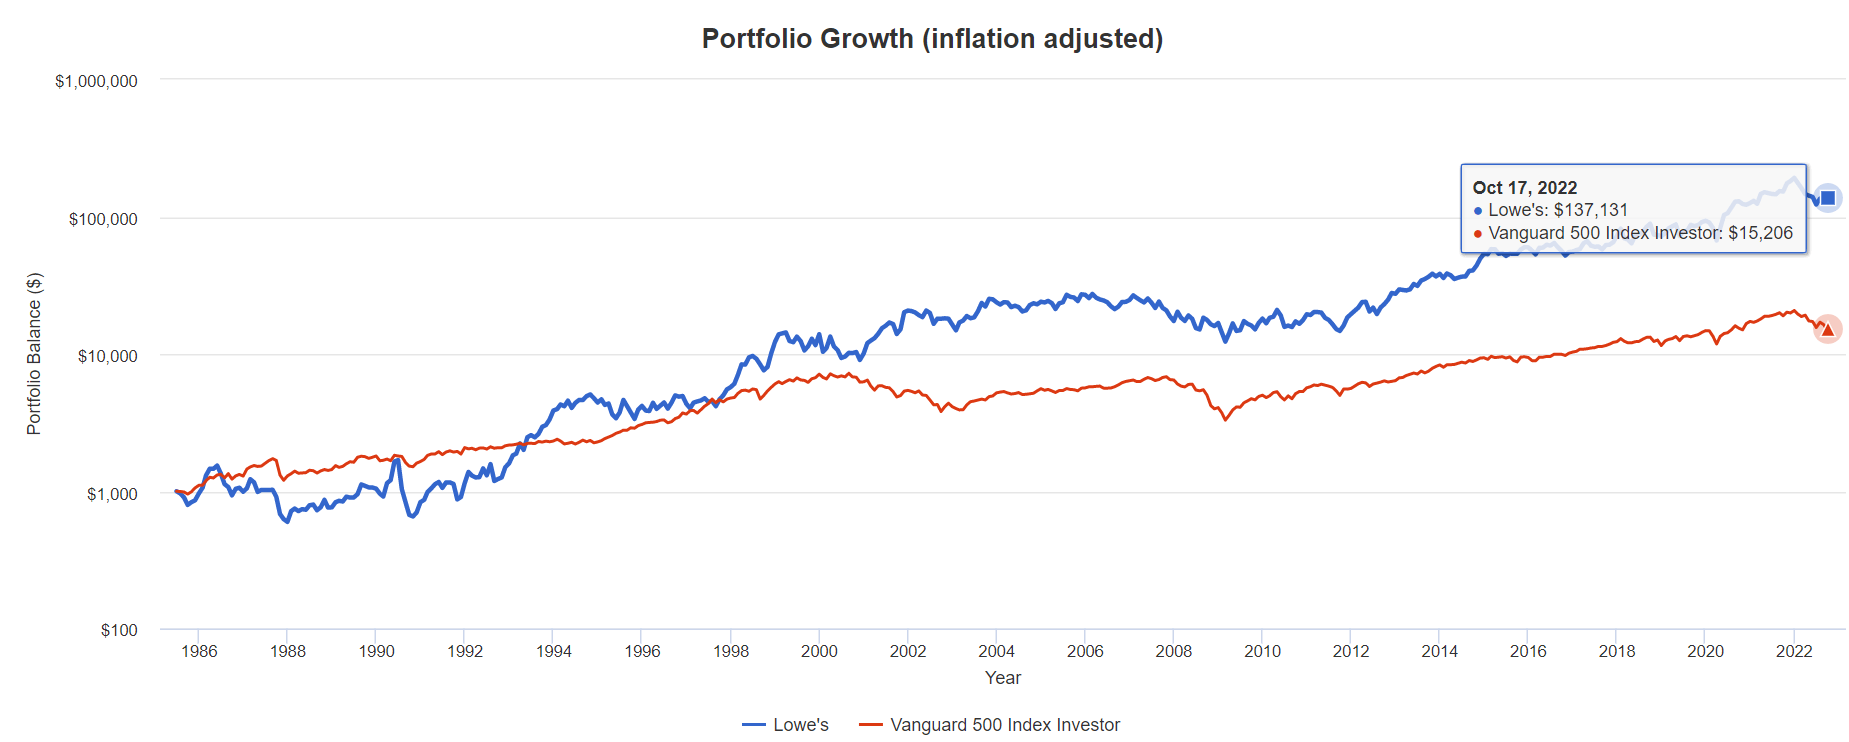
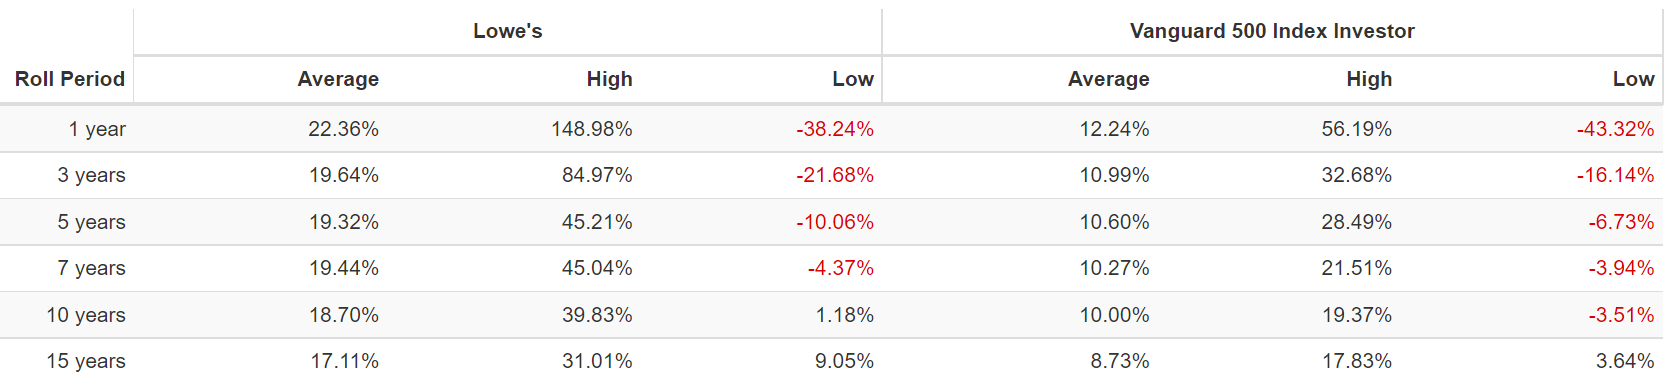
LOW’s historical rolling returns are 22% annually over the last 37 years.
- 137X inflation-adjusted returns
- 9X more than the S&P 500
Inflation-Adjusted Consensus Total Return Potential: $1,000 Initial Investment
| Time Frame (Years) | 8.0% CAGR Inflation-Adjusted S&P 500 Consensus | 9.2% Inflation-Adjusted Aristocrat Consensus | 20.1% CAGR Inflation-Adjusted LOW Consensus | Difference Between Inflation-Adjusted LOW Consensus And S&P Consensus |
| 5 | $1,468.65 | $1,553.50 | $2,496.63 | $1,027.98 |
| 10 | $2,156.93 | $2,413.37 | $6,233.14 | $4,076.21 |
| 15 | $3,167.77 | $3,749.18 | $15,561.81 | $12,394.05 |
| 20 | $4,652.33 | $5,824.36 | $38,852.02 | $34,199.68 |
(Source: DK Research Terminal, FactSet)
If Morgan Stanley is right then potentially LOW could deliver nearly 40X inflation-adjusted returns over the next two decades.
| Time Frame (Years) | Ratio Inflation-Adjusted LOW Consensus/Aristocrat Consensus | Ratio Inflation-Adjusted LOW Consensus vs. S&P consensus |
| 5 | 1.61 | 1.70 |
| 10 | 2.58 | 2.89 |
| 15 | 4.15 | 4.91 |
| 20 | 6.67 | 8.35 |
(Source: DK Research Terminal, FactSet)
Which is far more than the aristocrats or S&P 500.
Reason Three: A Wonderful Company At A Wonderful Price
(Source: FAST Graphs, FactSet) (Source: FAST Graphs, FactSet) (Source: FAST Graphs, FactSet)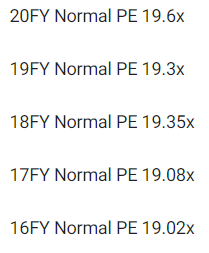
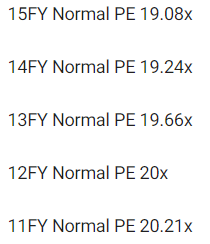
For 20 years, hundreds of millions of income investors, outside of bear markets and bubbles, have consistently paid 19 to 21X earnings for LOW.
- 91% statistical probability LOW is worth around 20X earnings unless it grows significant slowly in the future (less than 13% per year)
| Metric | Historical Fair Value Multiples (15-year) | 2021 | 2022 | 2023 | 2024 | 2025 |
12-Month Forward Fair Value |
| Earnings | 20.00 | $234.00 | $267.80 | $287.80 | $337.60 | $432.60 | |
| Average | $234.00 | $267.80 | $287.80 | $337.60 | $432.60 | $284.34 | |
| Current Price | $194.09 | ||||||
|
Discount To Fair Value |
17.06% | 27.52% | 32.56% | 42.51% | 55.13% | 31.74% | |
|
Upside To Fair Value |
20.56% | 37.98% | 48.28% | 73.94% | 122.89% | 48.66% | |
| 2022 EPS | 2023 EPS | 2022 Weighted EPS | 2023 Weighted EPS | 12-Month Forward EPS | 12-Month Average Fair Value Forward PE | Current Forward PE | Cash-Adjusted PE |
| $13.39 | $14.39 | $2.32 | $11.90 | $14.22 | 20.0 | 13.7 | 11.0 |
LOW is historically worth about 20X earnings and today trades at 13.7X and just 11.0X adjusted for cash.
| Rating | Margin Of Safety For Very Low Risk 13/13 Ultra SWAN Quality Companies | 2022 Fair Value Price | 2023 Fair Value Price |
12-Month Forward Fair Value |
| Potentially Reasonable Buy | 0% | $267.80 | $287.80 | $284.34 |
| Potentially Good Buy | 5% | $254.41 | $273.41 | $270.12 |
| Potentially Strong Buy | 15% | $227.63 | $244.63 | $241.69 |
| Potentially Very Strong Buy | 25% | $190.81 | $215.85 | $213.25 |
| Potentially Ultra-Value Buy | 35% | $174.07 | $187.07 | $184.82 |
| Currently | $194.09 | 27.52% | 32.56% | 31.74% |
| Upside To Fair Value (Including Dividends) | 40.14% | 50.45% | 4LOW is a potentially very strong buy for anyone comfortable with its risk profile |
For anyone comfortable with its risk profile, LOW is a potentially very strong buy.
Risk Profile: Why Lowe’s Isn’t Right For Everyone
There are no risk-free companies, and no company is suitable for everyone. You have to be comfortable with the fundamental risk profile.
LOW’s Risk Profile Includes
- economic cyclicality risk: sales are partially driven by new homes sales); the recent slowdown could reduce estimates
- 39% peak EPS decline in the Great Recession
- M&A execution risk: CA acquisition (Rona) didn’t work out
- Margin expansion plan execution risk: thus far, going well, but if it fails, growth estimates could fall significantly
- talent retention risk in the tightest job market in 50 years
- cyber-security risk: hackers and ransomware
- disruption risk: minimal, though AMZN is trying to increase its sales of similar products
(Source: Dividend Kings S&P 500 Valuation Tool)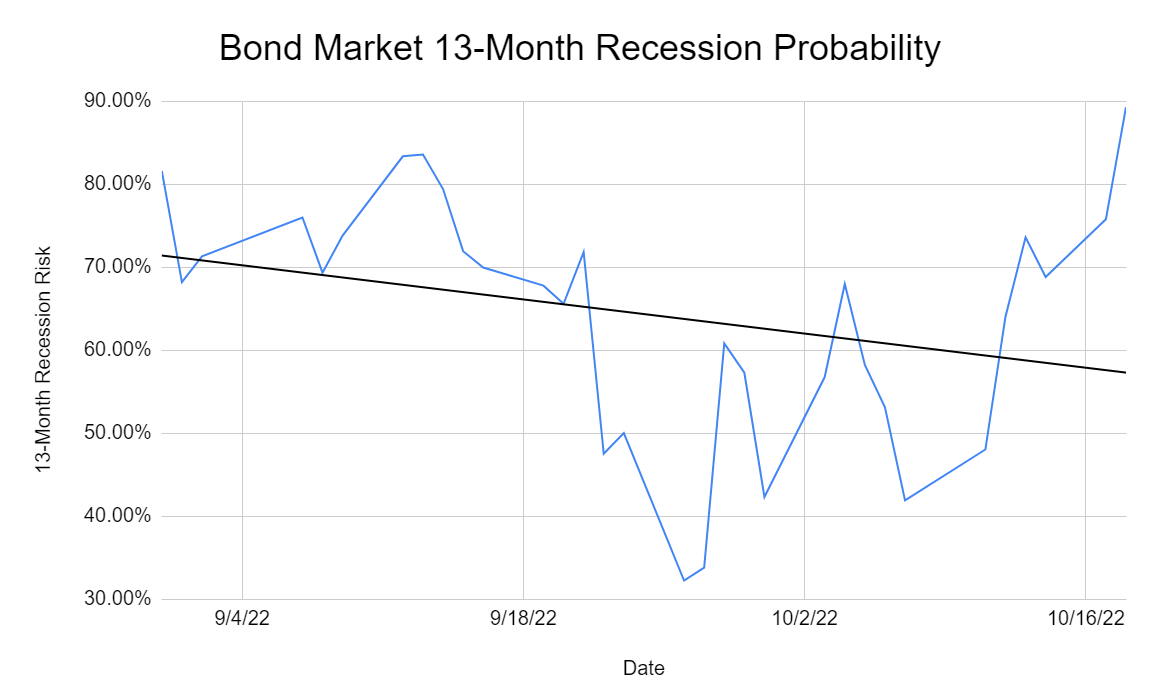
The bond market now estimates a 90% probability of recession within 13 months.
- Bloomberg: 100%
- Ned Davis Research: 98%
- The Conference Board: 96%
- 80% of CEOs expect a recession in 2023
In the Great Recession LOW’s EPS fell 39%, though this was the 2nd most severe recession since the Great Depression AND was focused around the housing market.
- over 40% of LOW’s sales are from home repairs, not new home sales
- if people can’t afford new homes, they are likely to spend more on repairing old ones
How do we quantify, monitor, and track such a complex risk profile? By doing what big institutions do.
Long-Term Risk Analysis: How Large Institutions Measure Total Risk
- see the risk section of this video to get an in-depth view (and link to two reports) of how DK and big institutions measure long-term risk management by companies
S&P Global
DK uses S&P Global’s global long-term risk-management ratings for our risk rating.
- S&P has spent over 20 years perfecting their risk model
- which is based on over 30 major risk categories, over 130 sub categories, and 1,000 individual metrics
- this risk rating has been included in every credit rating for decades
The DK risk rating is based on the global percentile of how a company’s risk management compares to 8,000 S&P-rated companies.
Lowe’s Scores 86nd Percentile On Global Long-Term Risk Management
S&P Global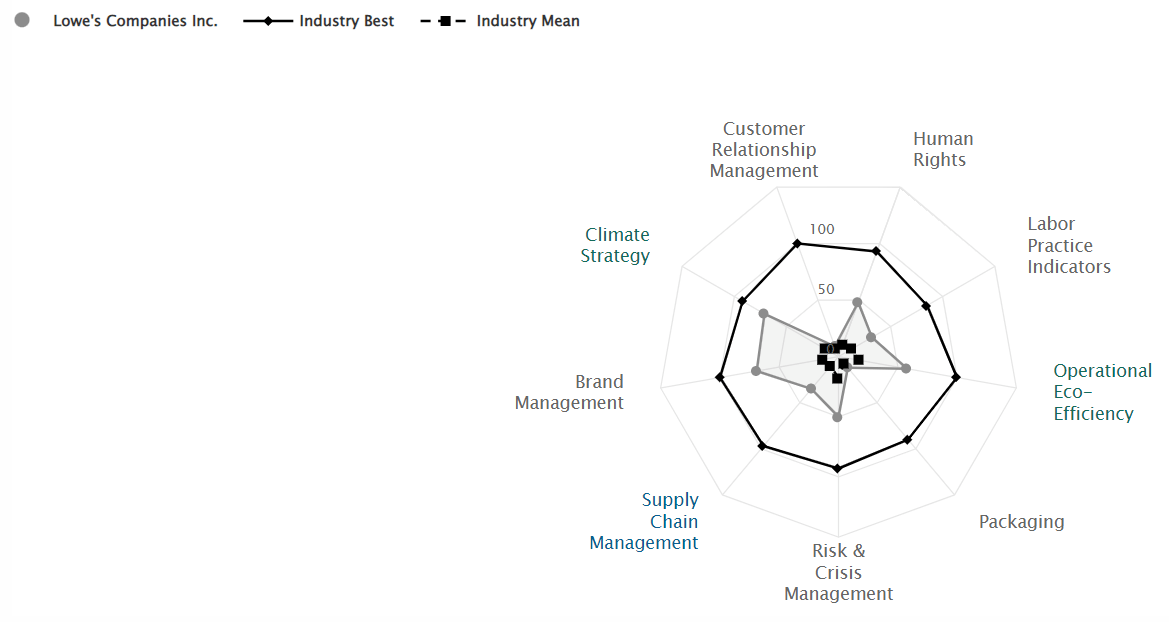
S&P’s risk management scores factor in things like:
- supply chain management
- crisis management
- packaging
- efficiency
- labor relations
- human rights
- customer relationship management
- climate strategy adaptation
- brand management
LOW’s Long-Term Risk Management Is The 22nd Best In The Master List (96 Percentile)
| Classification | Average Consensus LT Risk-Management Industry Percentile |
Risk-Management Rating |
| British American Tobacco (tied for #1) | 100 | Exceptional |
| S&P Global (SPGI) tied for #1 | 100 | Exceptional |
| Lowe’s | 86 |
Very Good |
| Foreign Dividend Stocks | 76 |
Good |
| Strong ESG Stocks | 73 |
Good |
| Ultra SWANs | 70 | Good |
| Low Volatility Stocks | 68 | Above-Average |
| Dividend Aristocrats | 67 | Above-Average |
| Dividend Kings | 63 | Above-Average |
| Master List average | 62 | Above-Average |
| Hyper-Growth stocks | 61 | Above-Average |
| Monthly Dividend Stocks | 60 | Above-Average |
| Dividend Champions | 57 | Average bordering on above-average |
(Source: DK Research Terminal)
LOW’s risk-management consensus is in the top 4% of the world’s highest quality companies and similar to that of such other blue-chips as
- Colgate-Palmolive (CL): Ultra SWAN dividend king
- Allianz SE (OTCPK:ALIZY): Super SWAN (best run insurance company in the world according to rating agencies)
- Lockheed Martin (LMT): Ultra SWAN
- BlackRock (BLK): Ultra SWAN
- Microsoft (MSFT): Ultra SWAN
The bottom line is that all companies have risks, and LOW is very good, at managing theirs.
How We Monitor LOW’s Risk Profile
- 31 analysts
- three credit rating agencies
- 34 experts who collectively know this business better than anyone other than management
- and the bond market for real-time fundamental risk updates
When the facts change, I change my mind. What do you do, sir? – John Maynard Keynes
There are no sacred cows at iREIT or Dividend Kings. Wherever the fundamentals lead, we always follow. That’s the essence of disciplined financial science, the math behind retiring rich and staying rich in retirement.
Bottom Line: Buy Lowe’s Today For A Potentially Rich Retirement Tomorrow
Let me be clear: I’m NOT calling the bottom in LOW (I’m not a market-timer).
Sleep Well At Night doesn’t mean “can’t fall hard in a bear market.”
Fundamentals are all that determine safety and quality, and my recommendations.
- over 30+ years, 97% of stock returns are a function of pure fundamentals, not luck
- in the short term; luck is 25X as powerful as fundamentals
- in the long term, fundamentals are 33X as powerful as luck
While I can’t predict the market in the short term, here’s what I can tell you about LOW.
- One of the highest quality, safest, and most dependable dividend blue-chips on earth.
- 2.2% very safe yield, growing at 16% to 20% CAGR over time
- 22.3% CAGR long-term total return consensus, better than the Nasdaq, aristocrats, S&P 500, and SCHD.
- 32% historically undervalued, a potentially very strong buy
- 11.0X cash-adjusted PE (PEG 0.55)
- 214% consensus return potential over the next five years, 24% CAGR, about 3X more than the S&P 500
- 2X the risk-adjusted expected returns of the S&P 500 over the next five years
- about 2X better income potential over the next five years
If you want to profit from this bear market, it’s hard to go wrong with Lowe’s.
If you want to maximize the chances of retiring rich and staying rich in retirement, consider buying some Lowe’s today.
If you want to take charge of your financial destiny and make your own luck on Wall Street, buying LOW at 11X cash-adjusted earnings is a great place to start.
With its strong balance sheet, exceptional risk-management profile, and an impeccable track record of raising dividends through even the most extreme recessions and bear markets, LOW is truly an Ultra SWAN dividend aristocrat you can trust.
No matter what happens next with inflation, interest rates, the economy or the stock market.
Be the first to comment