

peshkov
This article was published for Dividend Kings Marketplace subscribers on September 27, 2022.
The 2022 bear market could drive you crazy if you aren’t careful.
Daily Shot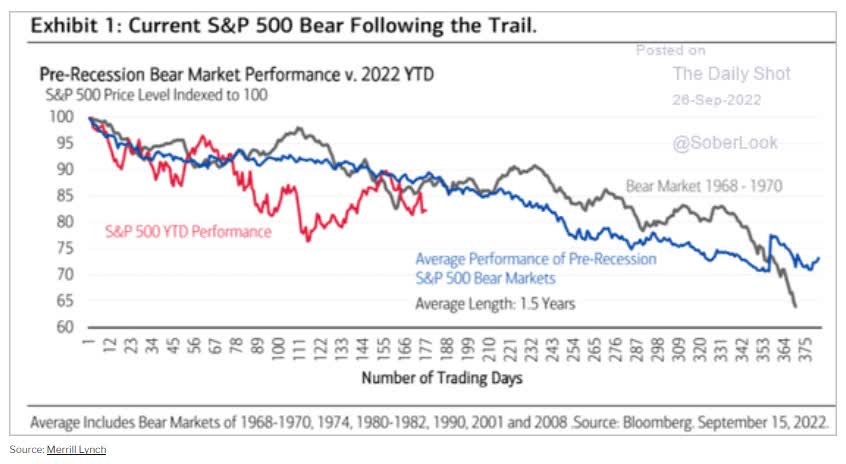
We’ve seen wild swings in both directions and unprecedented things like the worst bond bear market in history, the weakest British Pound in history, and the US dollar soaring like tech stocks in 1999.
Recently a Dividend Kings member asked me an important and timely question.
“If stocks are likely to fall another 15% to 20%, why not just sit in cash until we bottom at -35% to -40%”?
My father often asks me that question, and the answer is simple. Time in the market makes you rich; timing the market makes you poor.
Bank of America
According to Bank of America, since 1930, 99.84% of the market’s long-term returns, an impressive 177X return, were from the 90 single best market days.
Miss just 90 of the best days out of 21,252 (0.43% of market days); instead of 17,715% returns, you earned 28%.
- adjusted for inflation, a 94% loss over 92 years
Blue-chip buy and hold = one of the only two sure things on Wall Street.
Charlie Bilello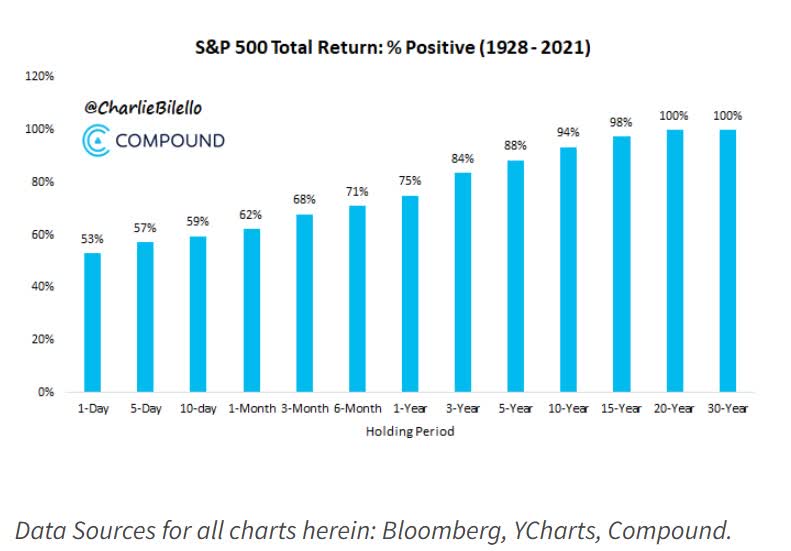
US stocks have always posted positive returns over 20+ years, even during the Great Depression and stagflation hell of the 1970s.
Why is market timing impossible? Why can’t we just sit out the 90 worst days and earn 214X higher returns than buy and hold?
- 80% of the market’s single best days come within 2 weeks of its single worst days
Michael Batnick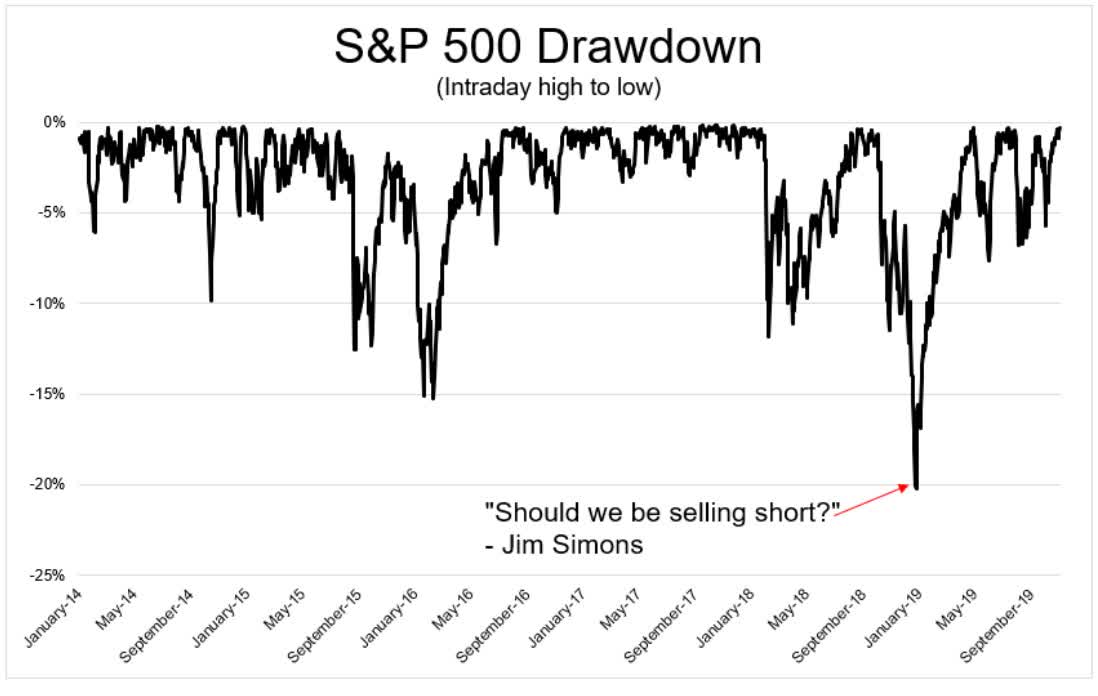
Jim Simons can’t time the market. He almost shorted it at the bottom of the 2018 bear market, though a colleague talked him out of it.
Who is Jim Simons? The founder of Renaissance Technology, the best quant hedge fund in history.
Ben Carlson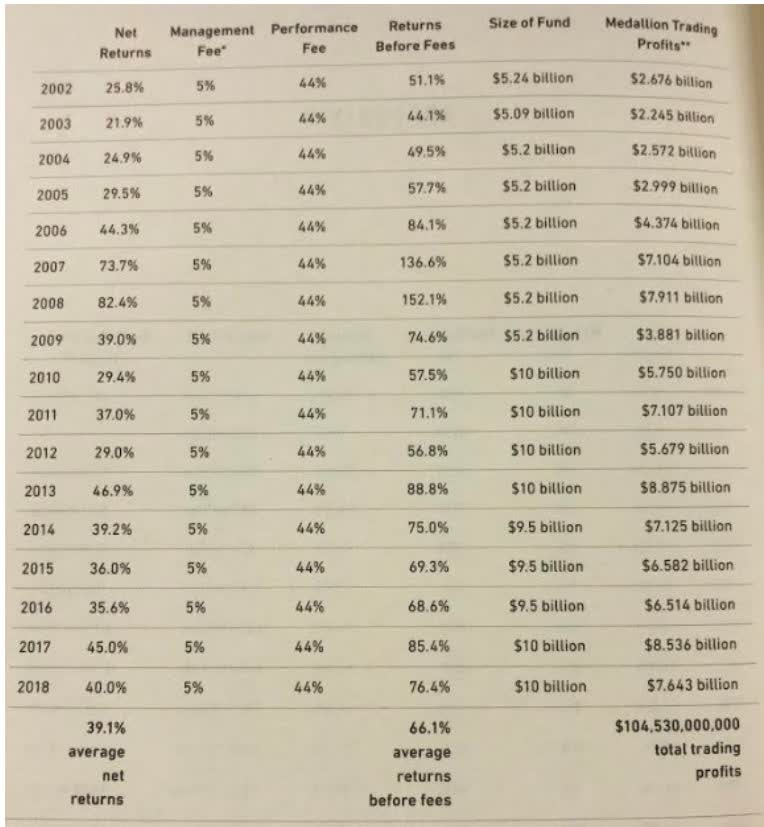
If the greatest trader in history can’t time the market bottom, what chance do you and I have?
JPMorgan Asset Management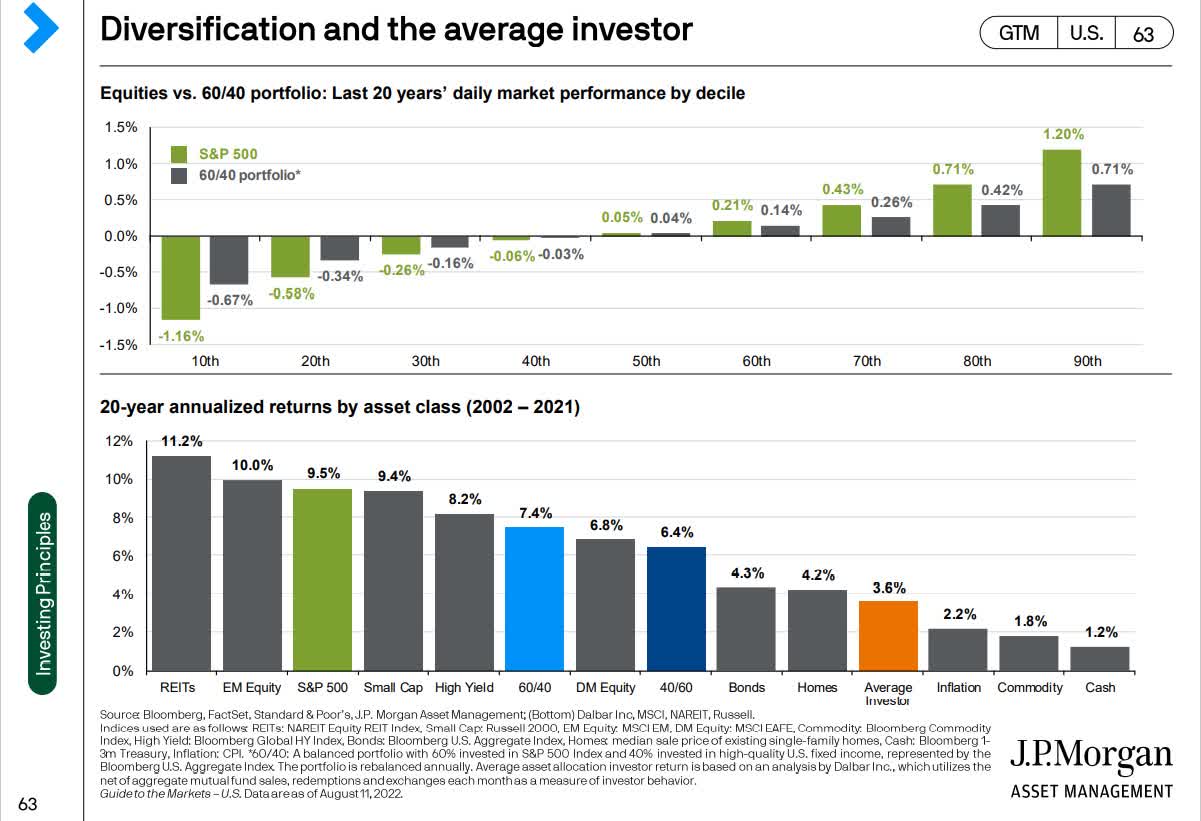
The answer is almost none. 98% of short-term traders lose money. 1% make enough money to earn a living at it.
Everyone else? Well, the average retail investor underperformed the stock market over the last 20 years by 66%. They lost to every asset class (including a super conservative 40% stock, 60% bond portfolio) except cash, inflation, commodities, and the worst hedge fund managers in the world (like permabear prophet of doom John Hussman).
What if you could at least time the market bottom for new money though? You could stay fully invested but not buy until we’re near likely market bottom. Wouldn’t that work?
Nick Maggiulli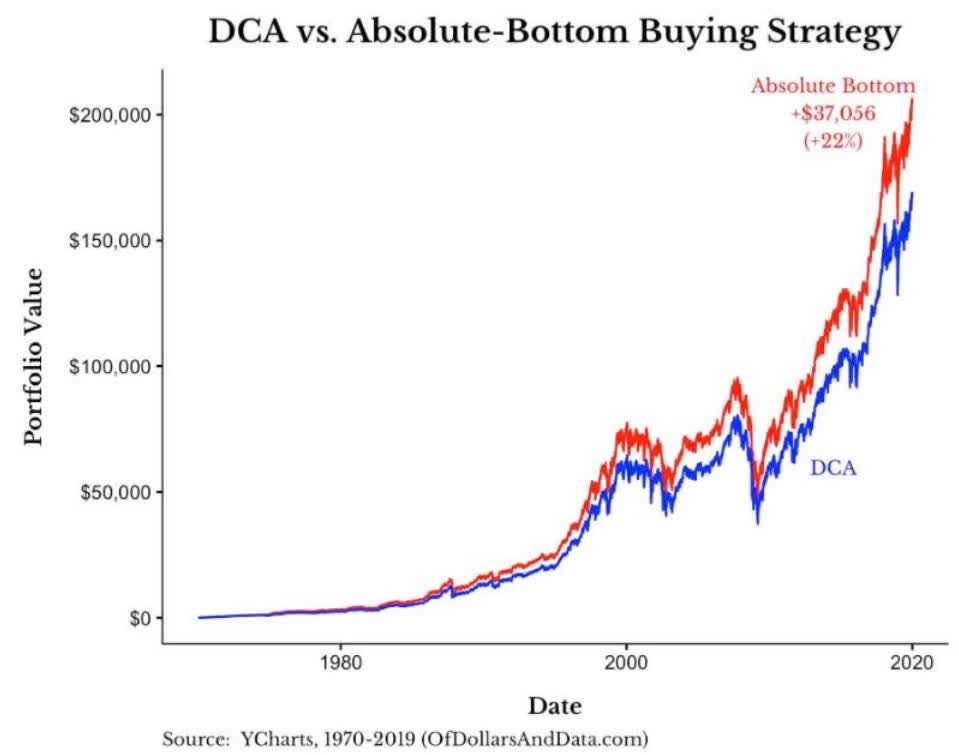
From 1970 to 2019, had you been able to buy $1,000 of the stock market on the day of the exact bottom, compared to $1,000 on January 1st, you would have earned an extra 22%. Not 22% per year, 22% over 49 years.
- an extra 0.41% annual return
- and all you had to do was nail the exact bottom 49 times in a row
What are the odds of being able to do that?
- approximately 1 in 9.12*10^115
- there are an estimated 10^82 atoms in the entire universe
In other words, the odds of being able to time the exact bottom of the market every year for 49 years is impossible. And even if you had done it, you would have earned an extra 22%, not counting taxes.
Vanguard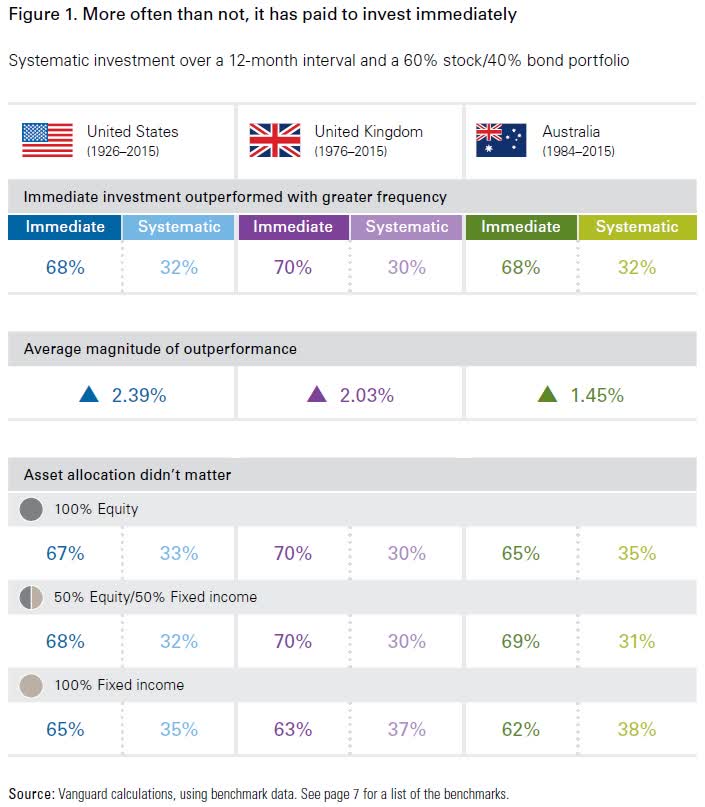
From 160 years of market data in the US, UK, and Australia, Vanguard found that being fully invested at all times, including dollar-cost-averaging new money as it becomes available is optimal 70% of the time.
It results in 2.4% higher annual returns on US stocks over time.
- 103% more inflation-adjusted wealth over 30 years
The 30% of the time when holding cash to buy bargains in a correction is optimal is now likely a lot less given that we’re 24% of the way into a bear market.
Charlie Bilello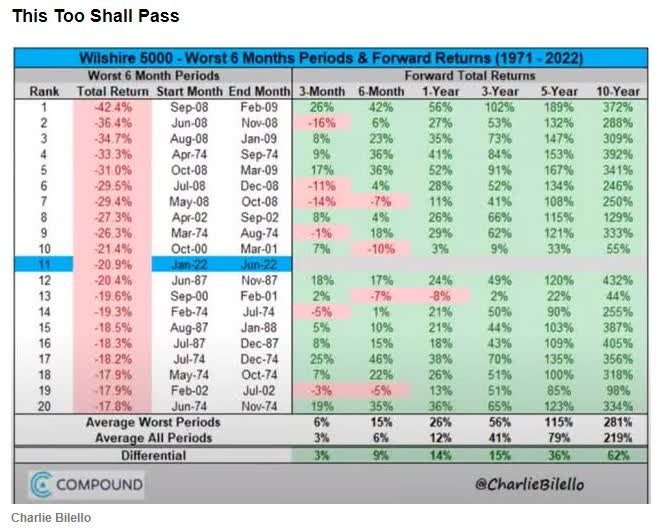
After the bear market, we’ve seen stocks average a nearly 4X gain in the following 10 years.
Individual blue-chips can deliver 8X to 16X returns.
And let’s not forget that it’s always and forever a market of stocks, not a stock market. Individual blue-chips bottom on their own schedule, which no one knows.
- MO bottomed 4 months before the market in December 2008, at a very safe 15% yield
- it was up 9% by the time the market stopped falling in March 2009
- AMZN bottomed in January 2002, the S&P 500 in October 2002
- AMZN was up 60% by the time the S&P was done falling
What do you call someone who ignored amazing valuations on world-beater blue-chips during previous bear market? Afraid, valuation greedy, or a bit of both.
What do you call someone who bought those bargains for the long-term? Already retired.
So let me show you the three reasons why Alphabet (NASDAQ:GOOG)(NASDAQ:GOOGL) is a table-pounding Buffett-style “fat pitch” very strong buy today. No matter what happens with the price in the next few months.
What if GOOG has further to fall?
Ycharts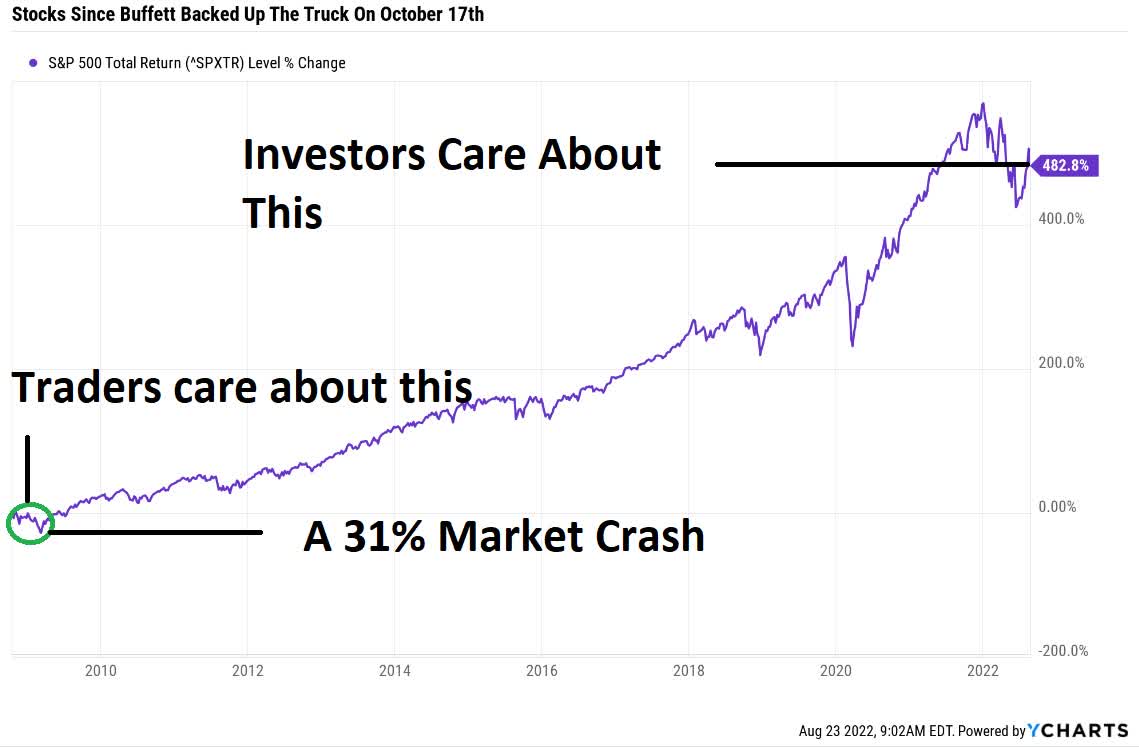
Do you think Buffett cared that stocks fell 31% more after he wrote “Buy American: I Am” in mid-October 2008? Or do you think the 6X gain in the following decade is what anyone following his advice remembers?
Reason One: The Best Buying Opportunity In 10 Years
Here’s the bottom line up front on GOOG.
Ycharts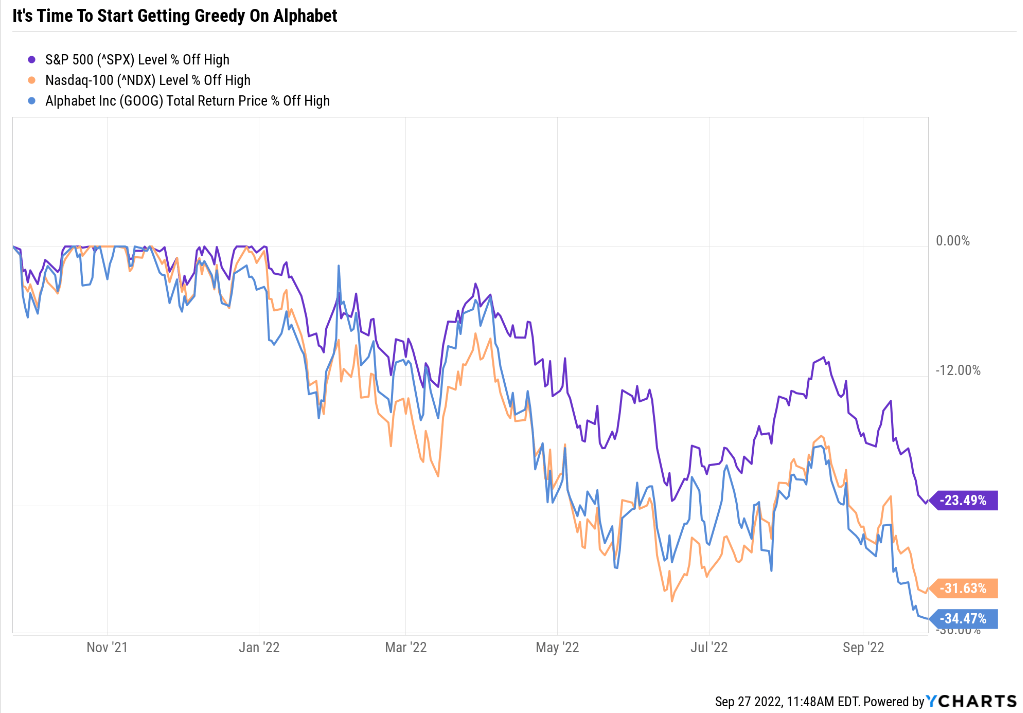
GOOG is down almost 20% off the August 16th highs and down 35% during this bear market.
Ycharts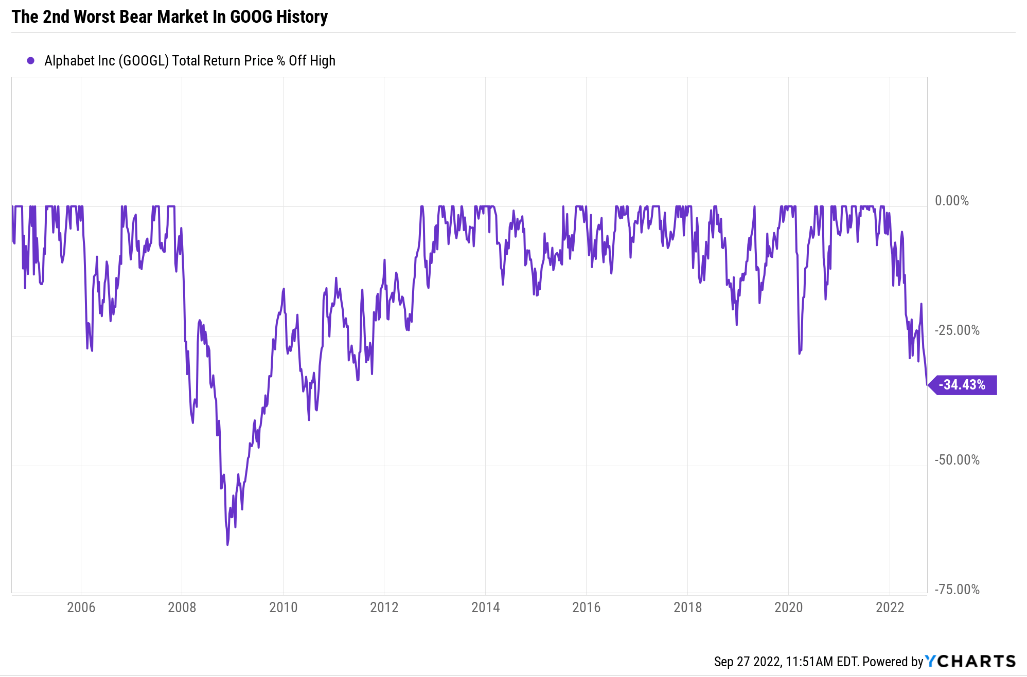
This is GOOG’s 2nd worst bear market in history, 2nd only to the Great Recession.
FAST Graphs, FactSet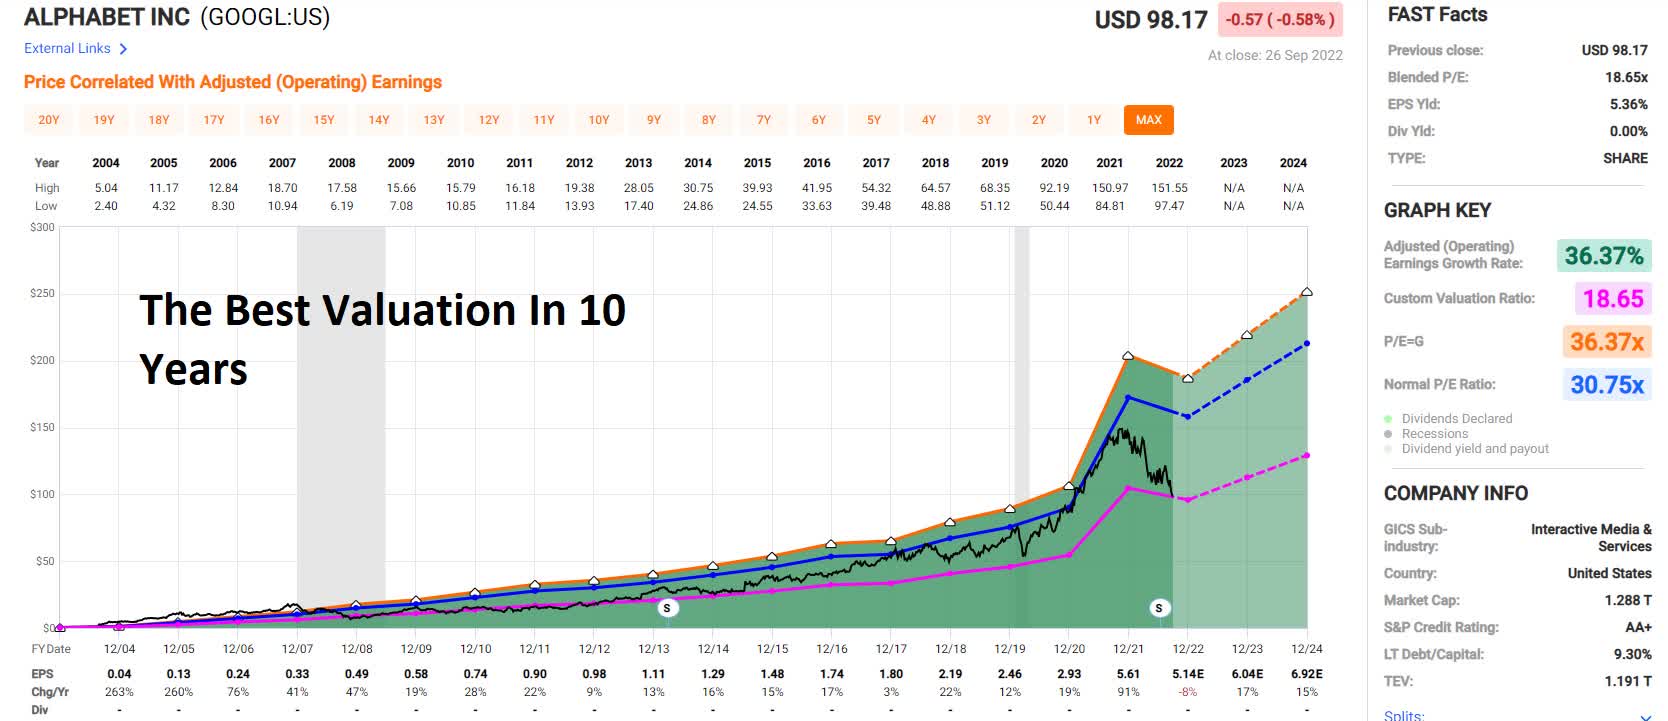
When was the last time you could buy GOOG at today’s valuation? Not since 2012, a decade ago.
Yes, it’s the best time in 10 years to buy the global king of search and online advertising.
Reasons To Potentially Buy GOOG Today
| Metric | Alphabet |
| Quality | 97% 13/13 Ultra SWAN (Sleep Well At Night) Data Giant |
| Risk Rating | Low Risk |
| DK Master List Quality Ranking (Out Of 500 Companies) | 20 |
| Quality Percentile | 96% |
| Balance Sheet Safety Score | 100% |
| S&P Credit Rating | AA+ Stable |
| 30-Year Bankruptcy Risk | 0.29% |
| Consensus LT Risk-Management Industry Percentile |
67% Above-Average, Bordering On Good |
| Fair Value | $148.93 |
| Current Price | $97.66 |
| Discount To Fair Value | 34% |
| DK Rating |
Potentially Very Strong Buy |
| PE | 17.3 |
| Cash-Adjusted PE | 10.2 |
| Growth Priced In | 3.4% |
| Historical PE Range | 25.5 to 26.5 |
| LT Growth Consensus/Management Guidance | 15.7% |
| PEG Ratio | 0.65 (hyper-growth at a wonderful price) |
| 5-year consensus total return potential |
18% to 20% CAGR |
| Base Case 5-year consensus return potential |
19% CAGR (2.5X better than the S&P 500) |
| Consensus 12-month total return forecast | 48% |
| Fundamentally Justified 12-Month Return Potential | 53% |
| LT Consensus Total Return Potential | 15.7% |
| Inflation-Adjusted Consensus LT Return Potential | 13.5% |
| Consensus 10-Year Inflation-Adjusted Total Return Potential (Ignoring Valuation) | 3.54 |
| LT Risk-Adjusted Expected Return | 10.96% |
| LT Risk-And Inflation-Adjusted Return Potential | 8.74% |
| Conservative Years To Double | 8.2 Vs 15.2 S&P 500 |
(Source: Dividend Kings Zen Research Terminal)
GOOG is currently trading at 10.2X cash-adjusted earnings, pricing in just 3.4% long-term growth.
It’s actually growing at over 15% and trading at a 34% historical discount to market-determined fair value.
What does that mean for investors? Analysts expect 48% returns within a year, and GOOG’s fundamentals justify that.
GOOG Corp 2024 Consensus Total Return Potential
(Source: FAST Graphs, FactSet)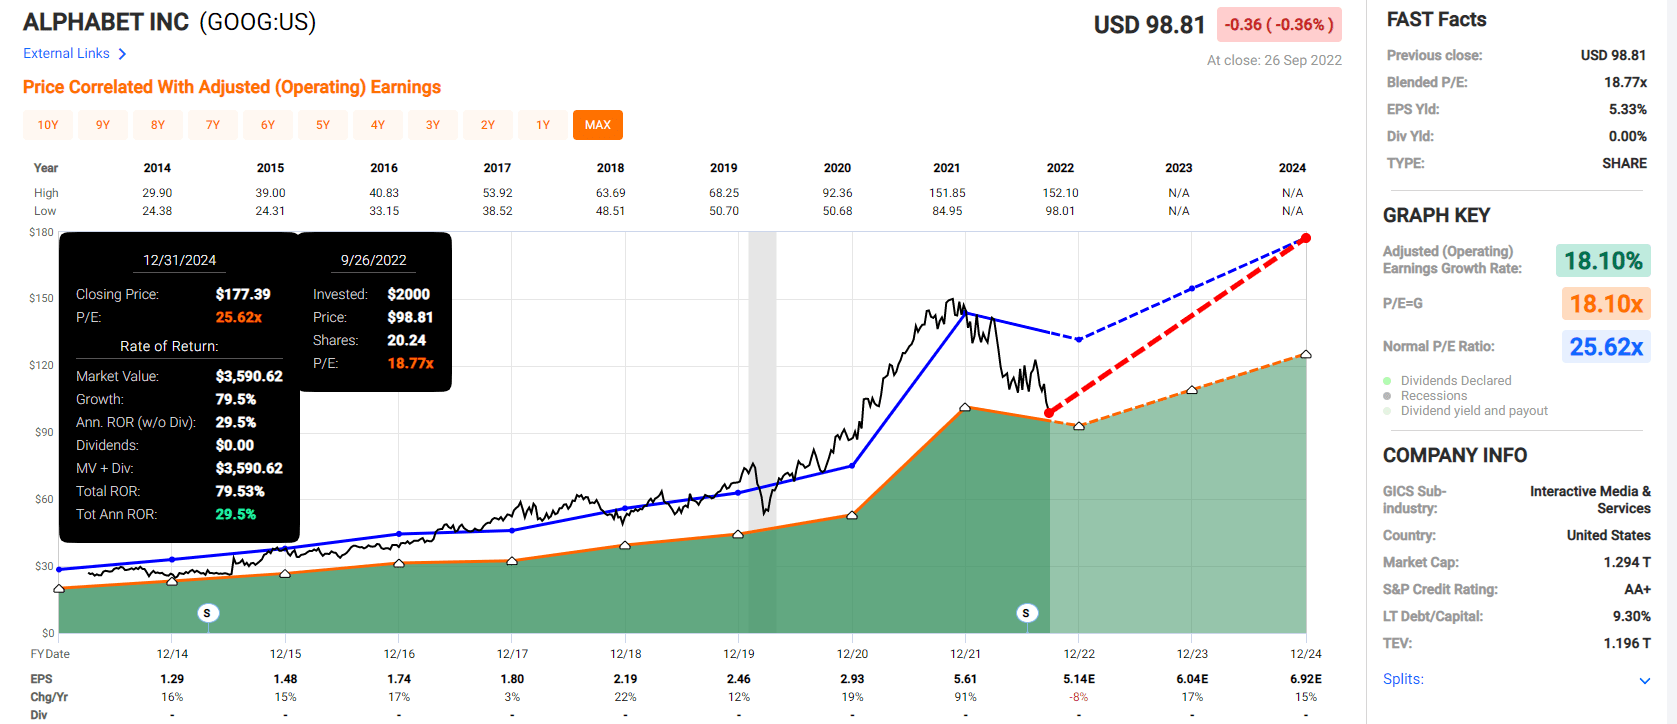
Over the next 2.3 years, analysts think GOOG could deliver 80% total returns, or a Buffett-like 30% annually.
GOOG Corp 2027 Consensus Total Return Potential
(Source: FAST Graphs, FactSet)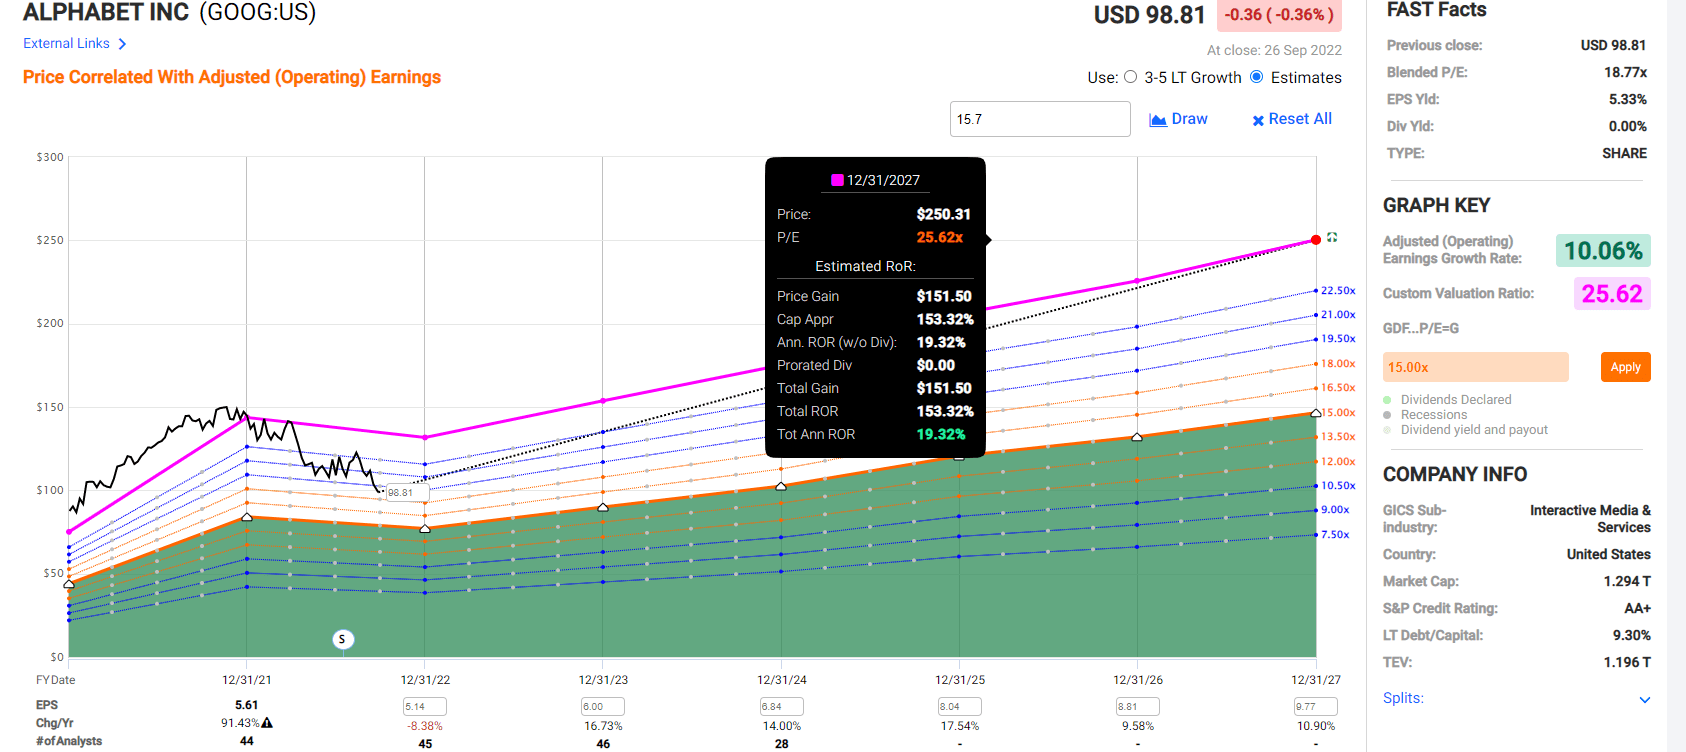
Over the next five years, analysts think GOOG could deliver 153% returns or a Buffett-like 19% annually.
Now compare that to the 8% undervalued S&P 500.
S&P 500 2024 Consensus Total Return Potential
(Source: FAST Graphs, FactSet)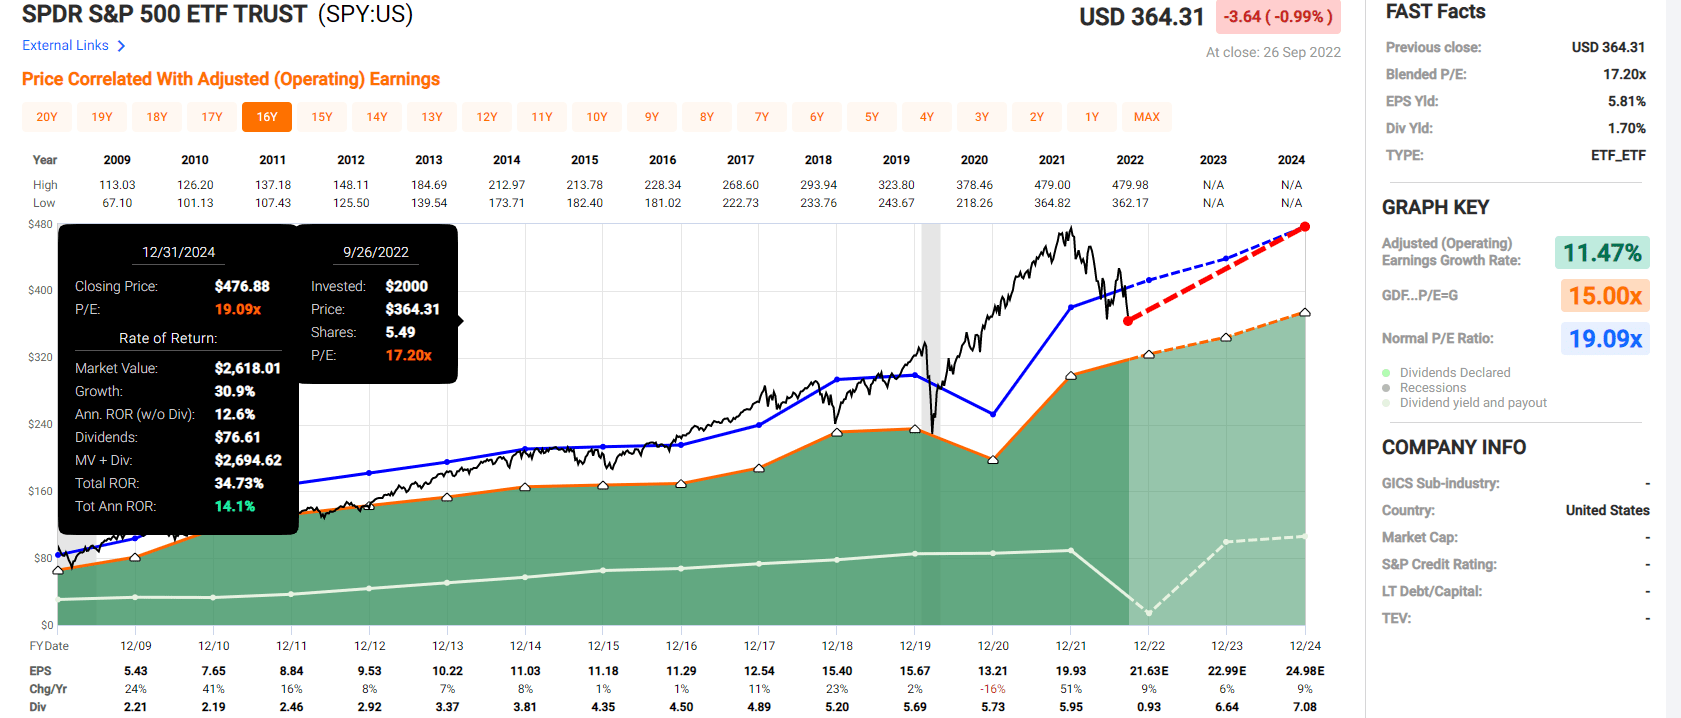
- GOOG offers 2.5X the return potential of the S&P 500 over the next 2.3 years
S&P 500 2027 Consensus Total Return Potential
| Year | Upside Potential By End of That Year | Consensus CAGR Return Potential By End of That Year | Probability-Weighted Return (Annualized) |
Inflation And Risk-Adjusted Expected Returns |
| 2027 | 64.89% | 10.52% | 7.89% | 5.57% |
(Source: DK S&P 500 Valuation & Total Return Tool)
Over the next five years, analysts expect 10.5% annual returns from the S&P 500.
- GOOG offers 2.5X the return potential of the S&P 500
Alphabet Corp Investment Decision Tool
DK (Source: Dividend Kings Automated Investment Decision Tool)
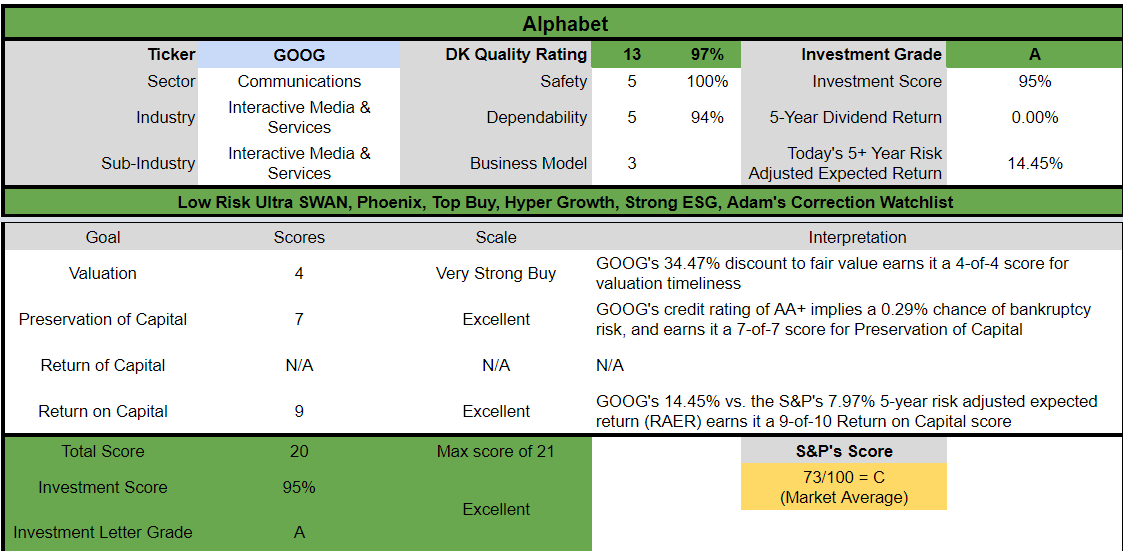
GOOG is 0.5% away from a perfect 100% A+ exceptional score.
For anyone comfortable with its risk profile, GOOG is as close to a perfect hyper-growth Ultra SWAN opportunity as exists on Wall Street.
- 35% discount to fair value Vs. 8% S&P = 27% better valuation
- 50% higher annual long-term return potential
- 2X higher risk-adjusted expected returns
Reason Two: Hyper-Growth As Far As The Eye Can See
You might think the growth thesis was imploding the way GOOG is nose-diving.
GOOG Growth Thesis Remains Intact
| Metric | 2021 Growth | 2022 Growth Consensus | 2023 Growth Consensus | 2024 Growth Consensus | 2025 Consensus | 2026 Consensus |
2027 Consensus |
| Sales | 43% | 17% | 12% | 13% | 14% | 10% | 10% |
| EPS | 91% | -8% | 17% | 15% | 18% | 10% | 11% |
| Operating Cash Flow | 43% | 15% | 15% | 14% | 28% | 5% | NA |
| Free Cash Flow | 59% | 9% | 15% | 22% | 20% | 5% | 17% |
| EBITDA | 69% | 32% | 12% | 15% | NA | NA | NA |
| EBIT (operating income) | 94% | 7% | 12% | 15% | NA | NA | NA |
(Source: FAST Graphs, FactSet)
Does this look like a company that deserves to be in a 35% bear market?
(Source: FactSet Research Terminal)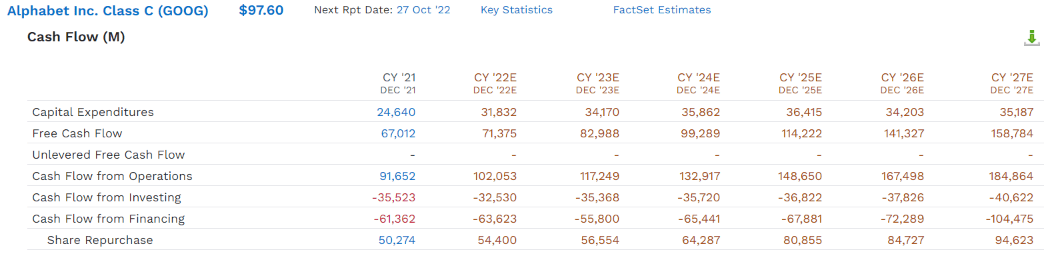
This year alone, GOOG is expected to generate $71.4 billion in free cash flow. And that’s expected to grow to $159 billion by 2027.
In 2022 GOOG is expected to buy back $54 billion in stock. By 2027 that’s expected to grow to $95 billion.
- $355 billion in cumulative buybacks by 2027
(Source: FactSet Research Terminal)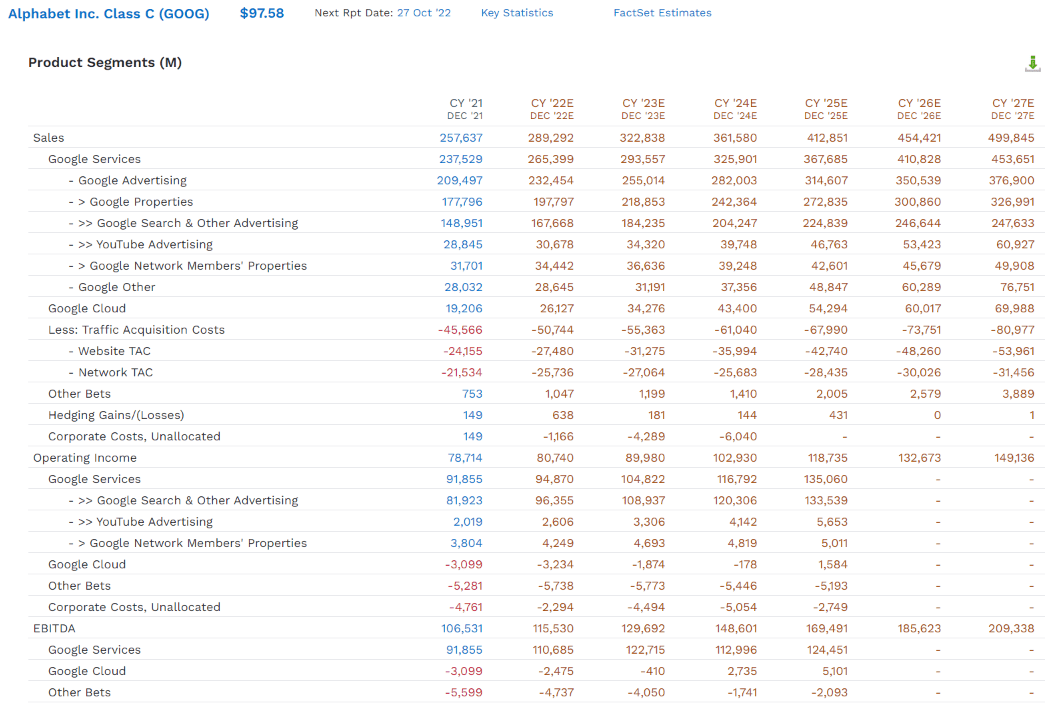
GOOG’s sales by 2027 are expected to reach $500 billion, with YouTube growing to $61 billion.
Daily Shot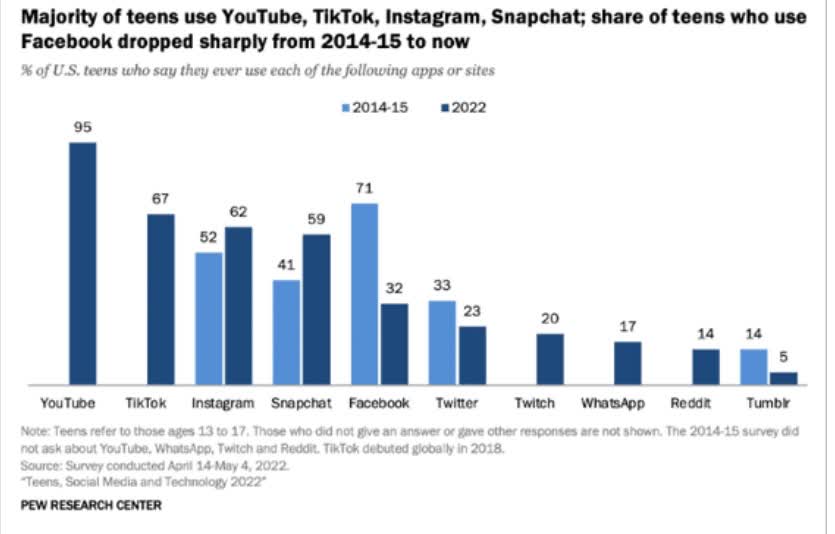
95% of US teens use YouTube daily, by far more than any Social Media network.
GOOG Cloud is expected to reach $70 billion in sales, putting it #3 in global cloud computing.
Daily Shot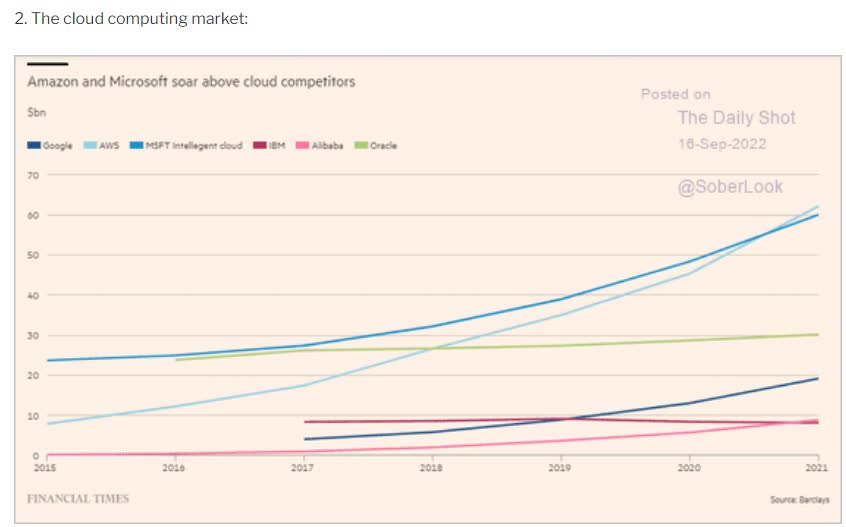
GOOG is the fastest-growing cloud computing giant, and analysts expect that MSFT, AMZN, and GOOG will dominate what might become a $2 to $10 trillion industry in a few years.
IOT Analytics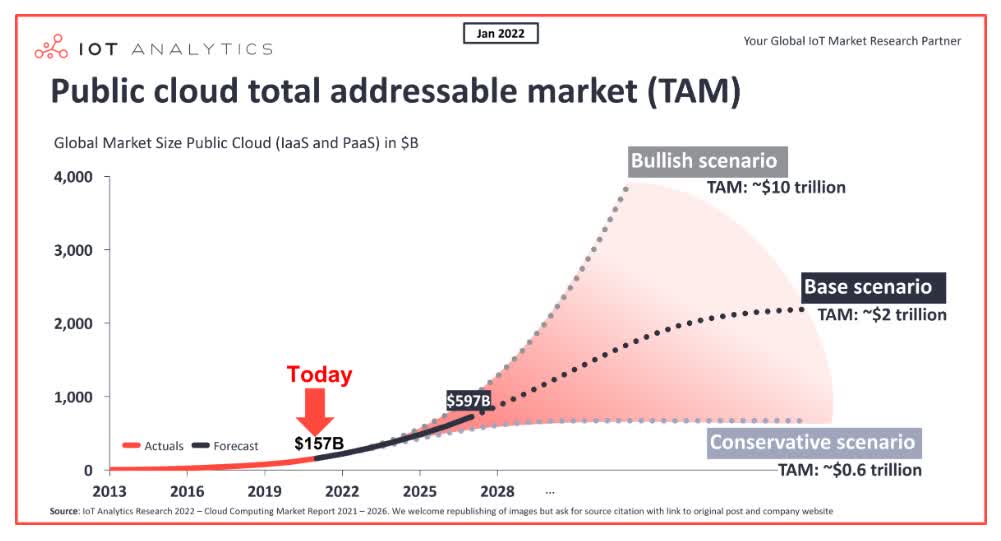
And let’s not forget about “other bets”, the GOOG skunk works. GOOG has not one but two subsidiaries working on a cure for aging.
- Imagine nanobots that can replace all medicine
- preventing heart disease, cancer, wiping out bacteria, viruses, and maintaining optimal health
- imagine being perfectly healthy and 25 years old…for as long as you want… and can pay whatever subscription price GOOG wants to charge
Is immortality a long shot? Perhaps for the next few decades. But what could a company charge for a subscription that:
- prevents disease
- eliminates illness
- allows effective immortality and even accelerated healing (like Wolverine)
$100K per year? $1 million? $10 million? There are millions of global millionaires who would pay any price GOOG asks for such a service.
- and every developed nation government on earth would be willing to pay $1,000 to 10,000 per year per citizen if it replaced all other medical costs
In other words, with GOOG, you can come for the amazing balance sheet (AA+ = 0.29% 30-year bankruptcy risk) and 15% growth for as far as the eye can see. And you can stay for the possibility of Star Trek medical breakthroughs that could be worth trillions in potential future annual sales.
- The Star Trek medical future: brought to you by Google;)
(Source: FactSet Research Terminal)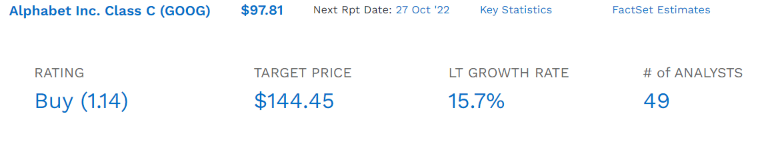
49 analysts cover GOOG, and their median long-term growth consensus is 15.7% CAGR.
| Investment Strategy | Yield | LT Consensus Growth | LT Consensus Total Return Potential | Long-Term Risk-Adjusted Expected Return | Long-Term Inflation And Risk-Adjusted Expected Returns | Years To Double Your Inflation & Risk-Adjusted Wealth |
10-Year Inflation And Risk-Adjusted Expected Return |
| Alphabet | 0.0% | 15.7% | 15.7% | 11.0% | 8.7% | 8.3 | 2.30 |
| Nasdaq | 0.9% | 11.8% | 12.7% | 8.9% | 6.6% | 10.9 | 1.89 |
| Schwab US Dividend Equity ETF | 3.6% | 8.80% | 12.4% | 8.7% | 6.4% | 11.3 | 1.86 |
| Dividend Aristocrats | 2.6% | 8.6% | 11.2% | 7.8% | 5.5% | 13.0 | 1.71 |
| S&P 500 | 1.8% | 8.5% | 10.3% | 7.2% | 4.9% | 14.6 | 1.62 |
(Source: DK Research Terminal, FactSet, Morningstar, Ycharts)
Want to beat the S&P 500? Dividend aristocrats? SCHD? Even the Nasdaq? Well, that’s what GOOG offers, according to the 49 analysts that collectively know the company better than anyone other than management.
(Source: FAST Graphs, FactSet)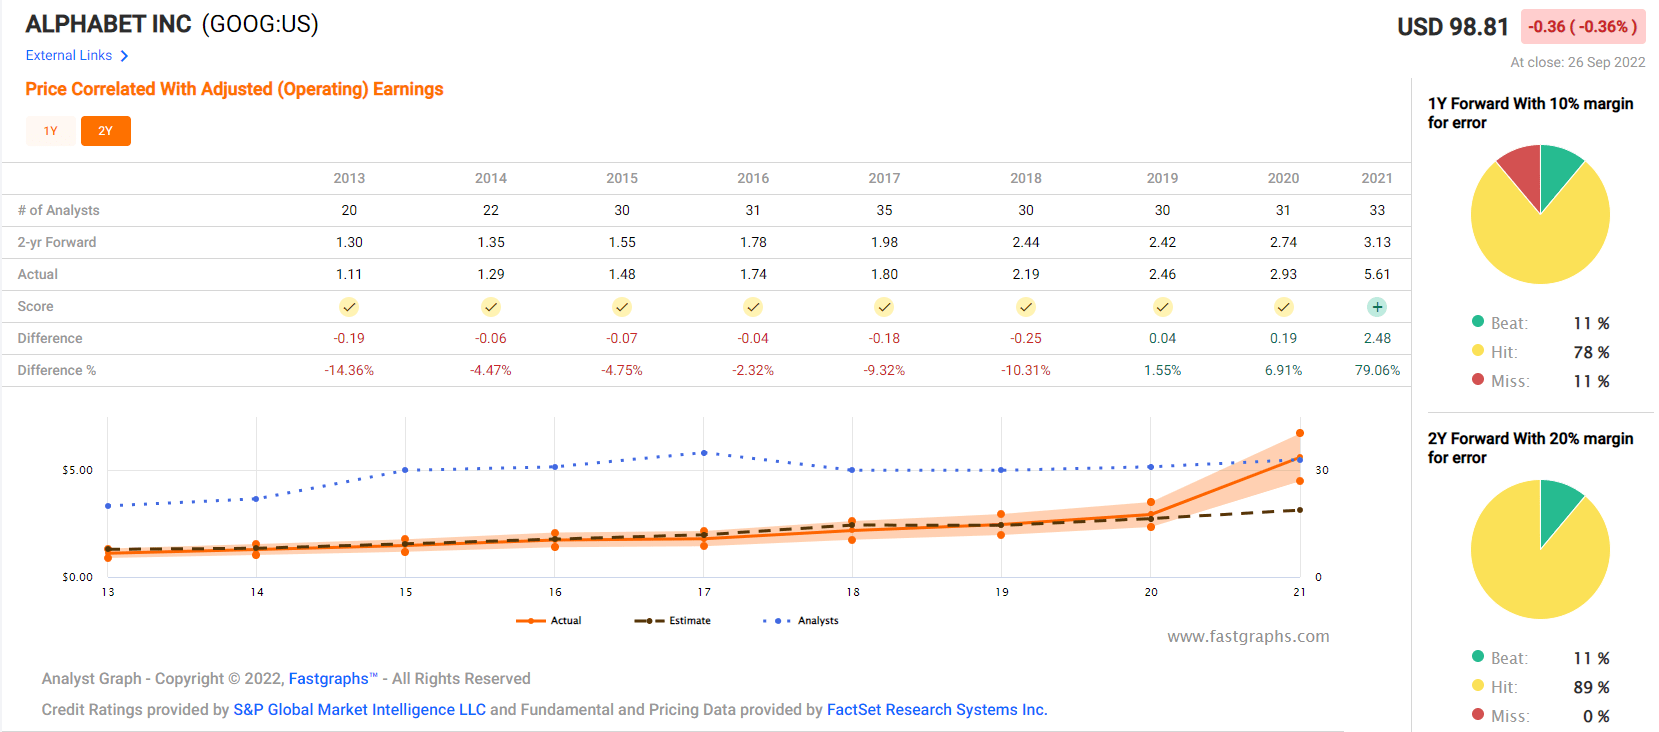
Analysts who collectively have margins of error of 10% for this company for the last decade.
Reason Three: A Wonderful Company At A Wonderful Price
(Source: FAST Graphs, FactSet) (Source: FAST Graphs, FactSet) (Source: FAST Graphs, FactSet)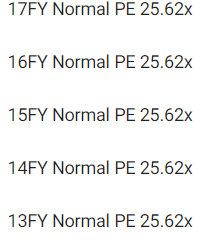
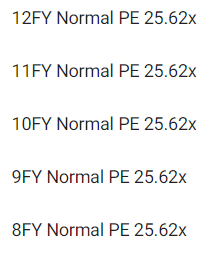
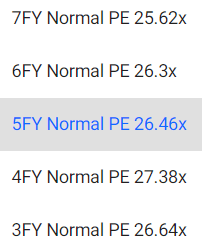
For the last 17 years, billions of investors have paid 25.5X to 26.5X earnings for GOOG outside of bear markets and bubbles.
- 25.62X is the mid-range market-determined fair value PE
- 91% probability that GOOG is worth approximately 25.62X earnings
| Metric | Historical Fair Value Multiples (all years) | 2021 | 2022 | 2023 | 2024 | 2025 | 12-Month Forward Fair Value |
| Earnings | 25.62 | $143.73 | $132.97 | $153.72 | $188.56 | $224.18 | |
| Average | $143.73 | $132.97 | $153.72 | $188.56 | $224.18 | $148.93 | |
| Current Price | $97.14 | ||||||
|
Discount To Fair Value |
32.41% | 26.94% | 36.81% | 48.48% | 56.67% | 34.78% | |
| Upside To Fair Value | 47.96% | 36.88% | 58.25% | 94.11% | 130.78% | 53.32% | |
| 2022 EPS | 2023 EPS | 2022 Weighted EPS | 2023 Weighted EPS | 12-Month Forward PE | 12-Month Average Fair Value Forward PE | Current Forward PE |
Current Forward Cash-Adjusted PE |
| $5.19 | $6.00 | $1.20 | $4.62 | $5.81 | 25.6 | 16.7 | 9.65 |
(Source: DK Research Terminal, FactSet)
GOOG is worth about 25.6X earnings and trades at 16.7X today. But back out its net cash, and it’s yours for the low, low price of 9.7X cash-adjusted earnings.
- pricing in 2.4% CAGR long-term growth
- for an Ultra SWAN growing at 15.7%
| Rating | Margin Of Safety For Low Risk 13/13 SWAN Quality Companies | 2022 Fair Value Price | 2023 Fair Value Price |
12-Month Forward Fair Value |
| Potentially Reasonable Buy | 0% | $132.97 | $153.72 | $148.93 |
| Potentially Good Buy | 5% | $113.02 | $130.66 | $126.59 |
| Potentially Strong Buy | 25% | $99.73 | $115.29 | $111.70 |
| Potentially Very Strong Buy | 35% | $73.46 | $99.92 | $96.81 |
| Potentially Ultra-Value Buy | 45% | $73.13 | $84.55 | $81.91 |
| Currently | $97.61 | 26.59% | 36.50% | 34.46% |
| Upside To Fair Value (Including Dividends) | 38.27% | 59.53% | 54.63% |
(Source: DK Research Terminal, FactSet)
For anyone comfortable with its risk profile, GOOG is a potentially very strong buy and, if you round, a Buffett-style, table-pounding “fat pitch” Ultra Value buy.
Risk Profile: Why Alphabet Isn’t Right For Everyone
There are no risk-free companies, and no company is right for everyone. You have to be comfortable with the fundamental risk profile.
GOOG’s Risk Profile Includes
- political/regulator risk (anti-trust threats)
- market share risk (from major rivals like AMZN, whose ads are 4X as effective as GOOG’s)
- disruption risk (web 3.0 potentially will allow everyone to own their data and monetize it, forcing GOOG to pay part of its current profits on data to users)
- M&A execution risk (lots of small bolt-on acquisitions and a lack of large M&A opportunities due to regulatory concerns over anti-trust)
- talent retention risk (tightest job market in over 50 years)
- currency risk (as sales become more international)
- cyber-security risk: hackers and ransomware
How do we quantify, monitor, and track such a complex risk profile? By doing what big institutions do.
Long-Term Risk Management Analysis: How Large Institutions Measure Total Risk Management
See the risk section of this video to get an in-depth view (and link to two reports) of how DK and big institutions measure long-term risk management by companies
GOOG Long-Term Risk Management Consensus
| Rating Agency | Industry Percentile |
Rating Agency Classification |
| MSCI 37 Metric Model | 63.0% |
BBB, Average, Negative Trend |
| Morningstar/Sustainalytics 20 Metric Model | 38.8% |
24.3/100 Medium-Risk |
| Reuters’/Refinitiv 500+ Metric Model | 92.7% | Excellent |
| S&P 1,000+ Metric Model | 47.0% |
Average, Positive Trend |
| Just Capital 19 Metric Model | 100.0% |
#1 Industry Leader |
| FactSet | 30.0% |
Below-Average, Stable Trend |
| Morningstar Global Percentile (All 15,000 Rated Companies) | 60.2% | Average |
| Just Capital Global Percentile (All 954 Rated US Companies) | 100.0% |
#1 Company In America |
| Consensus | 67% |
Low-Risk, Above-Average Risk-Management, Stable Trend, |
(Sources: MSCI, Morningstar, S&P, FactSet)
GOOG’s Long-Term Risk Management Is The 211th Best In The Master List (58th Percentile)
| Classification | Average Consensus LT Risk-Management Industry Percentile |
Risk-Management Rating |
| S&P Global (SPGI) #1 Risk Management In The Master List | 94 | Exceptional |
| Foreign Dividend Stocks | 76 |
Good |
| Strong ESG Stocks | 73 |
Good |
| Ultra SWANs | 70 | Good |
| Low Volatility Stocks | 68 | Above-Average |
| Alphabet | 67 | Above-Average, Bordering On Good |
| Dividend Aristocrats | 67 | Above-Average, Bordering On Good |
| Dividend Kings | 63 | Above-Average |
| Master List average | 62 | Above-Average |
| Hyper-Growth stocks | 61 | Above-Average |
| Monthly Dividend Stocks | 60 | Above-Average |
| Dividend Champions | 57 | Average bordering on above-average |
(Source: DK Research Terminal)
GOOG’s risk-management consensus is in the top 42% of the world’s highest quality companies and similar to that of such other companies as
- PPG Industries (PPG) – dividend aristocrat
- Hormel Foods (HRL) – dividend king
- Enterprise Products Partners (uses K-1 tax form) (EPD)
- Abbott Labs (ABT) – dividend king
- TC Energy (TRP)
- Magellan Midstream Partners (uses K-1) (MMP)
- Royal Bank of Canada (RY)
The bottom line is that all companies have risks, and GOOG is above-average, bordering on good, at managing theirs.
How We Monitor GOOG’s Risk Profile
- 49 analysts
- 2 credit rating agencies
- 7 total risk rating agencies
- 57 experts who collectively know this business better than anyone other than management
When the facts change, I change my mind. What do you do, sir? – John Maynard Keynes
There are no sacred cows at iREIT or Dividend Kings. Wherever the fundamentals lead, we always follow. That’s the essence of disciplined financial science, the math behind retiring rich and staying rich in retirement.
Bottom Line: It’s The Best Time In 10 Years To Buy Alphabet
I don’t know when GOOG will bottom; it could be tomorrow or next year. But here is what I do know.
- GOOG is one of the world’s safest, most dependable, and highest quality hyper-growth companies
- 15.7% CAGR long-term consensus return potential (more than aristocrats, S&P, and Nasdaq)
- 35% discount to fair value = potential Ultra Value, Buffett-style, table-pounding “fat pitch”
- 9.7X cash-adjusted PE (the lowest in 10 years)
- 130% total return potential over the next five years, 2.5X the S&P 500
- about 2X the risk-adjusted expected returns of the S&P 500 over the next five years
- eventually, it will pay a dividend and a very safe one at that
If you want to take advantage of this bear market, GOOG is one of the best names you can safely buy today.
Over the next few months, anything can happen. But over the next 10+ years? Stock returns aren’t luck; they are fundamentals-driven destiny. And those buying GOOG today are very likely to feel like a stock market genius, no matter what happens for the rest of the year.
Be the first to comment