

Pgiam/iStock via Getty Images
(This report was first published to members of Yield Hunting on Sept 26, 2022).
VictoryShares US EQ Income Enhanced Volatility Wtd ETF (NASDAQ:CDC)
(Terrible name. Could they make it any longer?)
This fund is a rule-based ETF that attempts to provide dividend income with far less downside risk. Investors who want exposure to high-yield large-cap stocks that has positive net earnings in the last year will want to look at this fund. Why? Because it offers a disciplined and balanced investment approach to manage risk by reducing equity exposure during periods of heightened market volatility.
The investment strategy is: seeks to provide investment results that track the performance of the Nasdaq Victory US Large Cap High Dividend 100 Long/Cash Volatility Managed Index before fees and expenses. Clearly, this is their proprietary index.
So what does the index do?
- Selects the highest 100 dividend-yielding stocks in the Nasdaq Victory US Large Cap 500 Volatility Weighted Index, which first:
- Screens for profitability – Must have positive net earnings across the last twelve months ‒ Selects the largest 500 stocks by market capitalization
- Weights stocks based on risk/volatility (standard deviation over the last 180 trading days)
- Reconstitutes twice a year (March and September)
- Automatically reduces its exposure to the equity markets during periods of significant market declines and reinvests when market prices have further declined or rebounded
How does it reduce downside risk?
The index it tracks is a rules-based strategy that adjusts allocations between stocks and cash. The goal is an unemotional, systemic, and potentially tax-efficient process without human interference, that reduces equity exposure and reinvests as prices decline.
Victory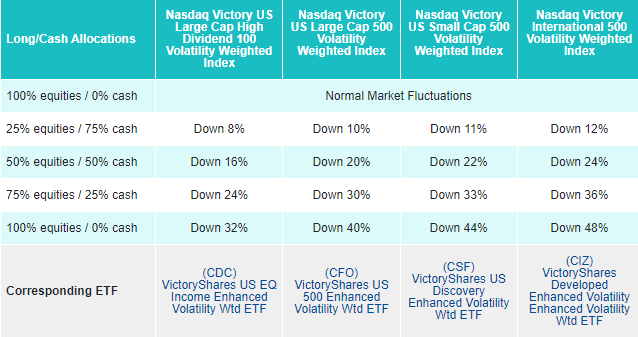
During periods of significant market declines of 8% or more from the index’s all-time high, the ETF starts to withdraw from the market only getting back in during a recessionary drop off of 40% or more.
In other words, the fund is 100% invested if the index is within 8% of its all-time highs. It keeps that allocation under normal market conditions until the index is down 8%. Upon reaching that threshold, it would then take off 75% of its equity exposure and be 25% in the index and 75% in cash.
Upon reaching a -16% drawdown, the fund would then add back 25% of its equity exposure back into the index to be 50% index and 50% in cash.
Again, once a larger drawdown is reached of -24%, the fund would then add another 25% exposure into equities with the resulting allocation being 75% equities and 25% in cash.
Lastly, once the recessionary environment is reached of -32%, then the fund would be back to fully invested.
The obvious question is, what happens if the index falls, say -23% and then recovers (something akin to this current market)? When does it get back to fully invested?
As the market recovers and the index gets within the 8% of the all-time high, it will reallocate back towards equities and be 100% invested.
Also, the changes in the allocation are done only at the month end. So if the index falls by 10% in two weeks and then recovers, no changes would be made to the allocation within the fund.
The other obvious question is what is the capital invested in when it is sitting in cash? The prospectus states that it will be put into 3-month treasury bills where the current yield is 2.18%.
During any periods of significant market decline, when the Index’s exposure to the market is less than 100%, the cash portion of the Index will be invested in 30-day U.S. Treasury bills or in money market mutual funds that primarily invest in short-term U.S. Treasury obligations.
Performance So far…
The fund has been around for 8 years so we actually have quite a bit of performance history to go off of. Remember though, this is a weighted average of the 100 highest dividend stocks in the Nasdaq. So it is not a 100% comparison to the QQQs or Nasdaq index. Below, we can see the comparison since inception between the QQQ index and the ETF.
agc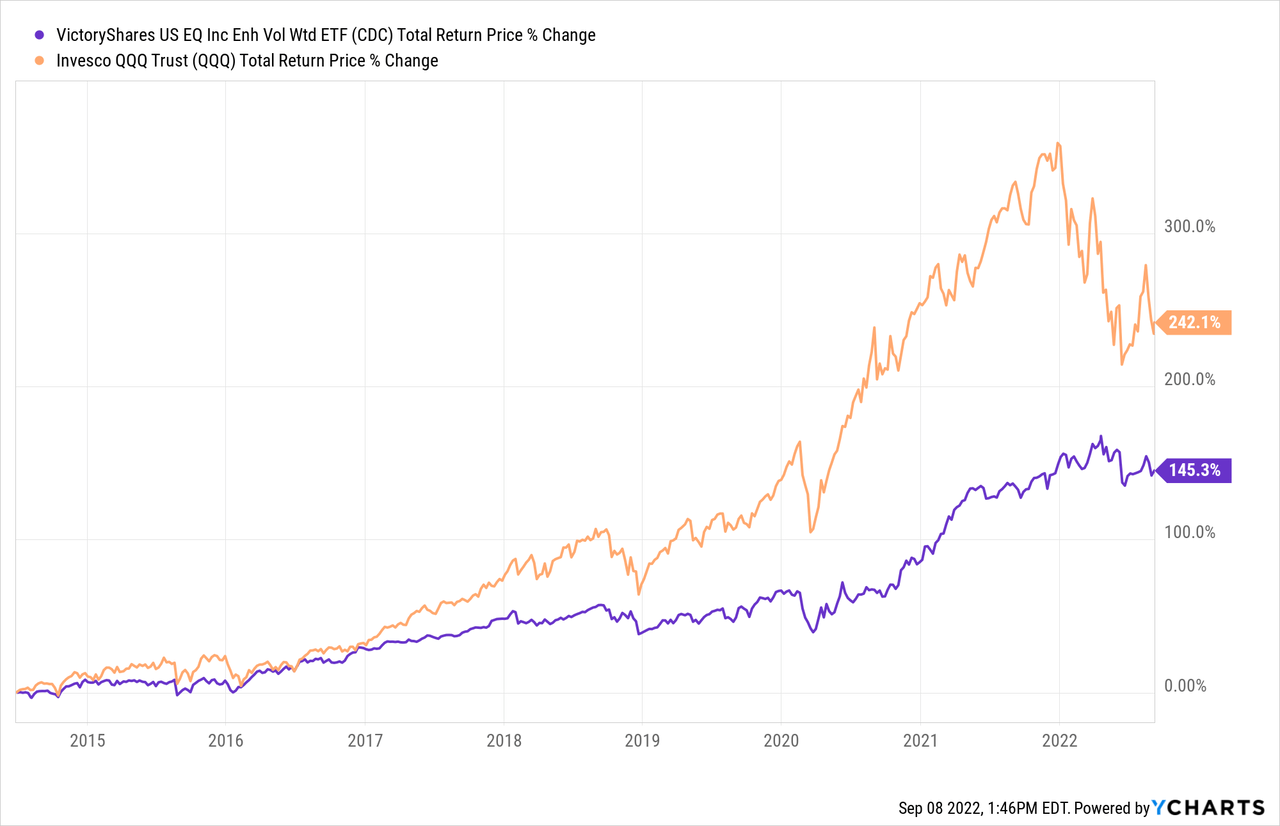
A better comparison would be the Invesco S&P 500 High Div Low Volatility Portfolio ETF (SPHD), even though the underlying index is the S&P 500, not the Nasdaq. The correlation to the Nasdaq High Dividend Low Volatility index is much higher due to that focus on higher yielding stocks and lower volatility, something the Nasdaq doesn’t actually have a lot of.
Below are the results that show a tight correlation until the Nasdaq outperformance started right after the Covid Crisis. However, the interesting thing is that while the index moves higher sharply, it does not show the same decline that the QQQs (Nasdaq) has experienced in 2022. That is most evident in the chart above. So it didn’t participate as much to the upside but it had almost no participation to the downside. That is what an investor geared towards lower volatility and risk aversion would want to see.
agc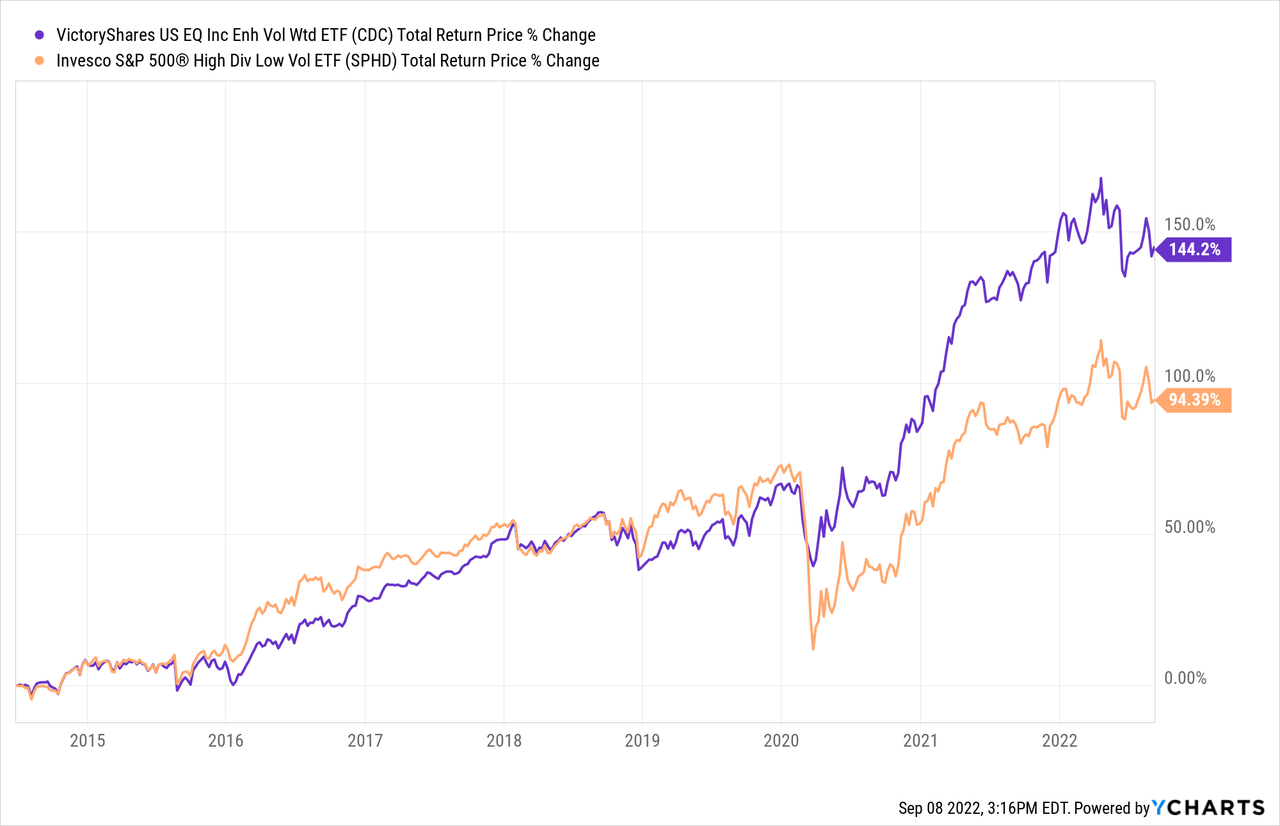
Concluding Thoughts
It’s hard to ascertain whether or not this ETF has done its job or not. There is no corresponding ETF without the reallocation strategy to compare it to. That said, we can compare it to several other options in the large cap US space with strategies that are an attempt to mitigate losses.
I compared it to a few other ETFs that have similar or slightly different goals and objectives. Those include: DRSK, NUSI, SPYC, TAIL, CBHAX, and XRMI. CDC looks the best under this limited time frame.
agc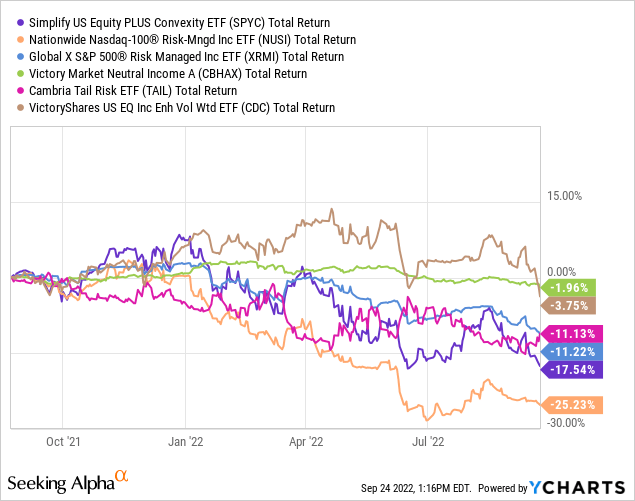
If we look at the fund compared to simply the S&P 500, you can see that the two are on top of each other. And this over a time period of nearly 7 years which encapsulates two large drawdown recessions.
agc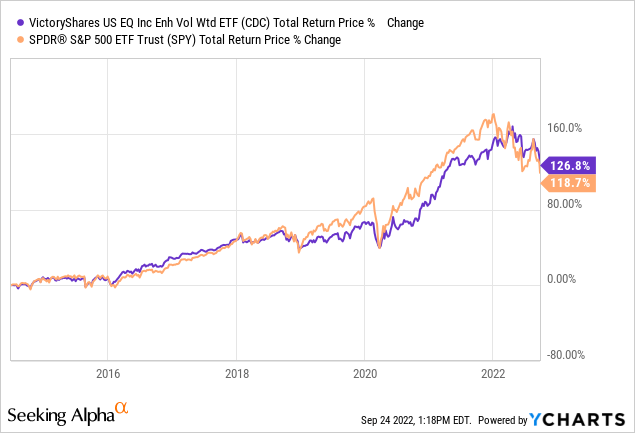
Like I said, this is one I’ll keep on my radar but the conclusion is not apparent yet. To me it seems something that will reduce risks around the edges but does not mitigate it to a large extent.
Be the first to comment