

Image Source
As you can see from the chart below, the Nasdaq remains in a bear market for now. The primary trend is still down. We had a very short bear market in the Nasdaq during the COVID year of 2020, but you have to go clear back to 2008-2009 for the last real bear.
Long-term chart of the Nasdaq (Marketsmith.com)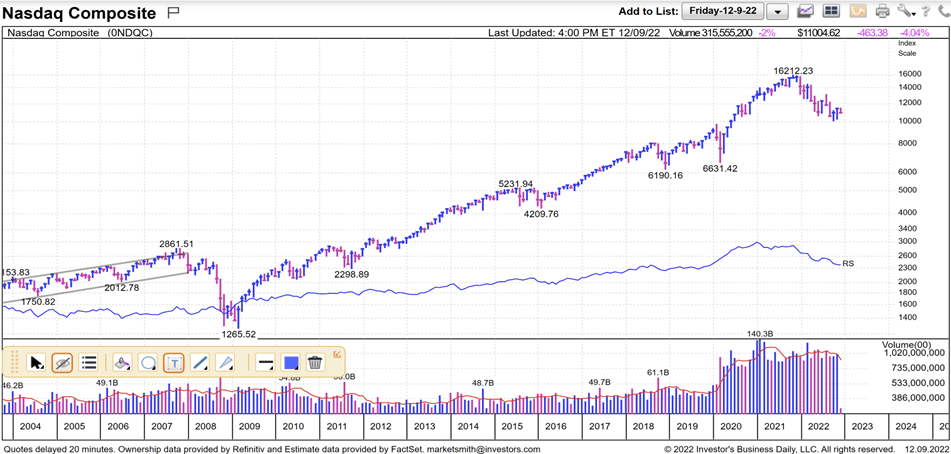
That last real bear market/primary downtrend in the Nasdaq racked up a (-56%) loss before it ended in March of 2009. Since then, the Nasdaq has gone from 1,265 in March of 2009 to 16,212 in November of 2021. That works out to a gain of 1,181%. That was then, this is now, however.
This current bear market in the Nasdaq is now at a magnitude of (-38.3%) so far. Can it go lower from here? Yes. Can the Nasdaq hold the 10,000 area and start to move back to its old highs? Yes, but it’s unlikely. It all depends on which way earnings go from here. But, for now, this is still not a good environment (rising interest rates) for longer duration and higher PE growth stocks.
As interest rates rise, PE multiples contract and those areas of the market like semiconductors, software, social media, electric vehicles, artificial intelligence, etc. suffer the most. While they’re much more glamorous and exciting areas to invest in, they can also get mauled in a hostile Fed environment like this. If you don’t believe me, just ask Cathie Wood of ARK Funds.
Her high PE (in most cases no PE), long-duration innovation fund is down a gut-wrenching 77.5% in this extremely hostile environment due to the type of stocks that she invests in.
Chart of ARKK (Stockcharts.com)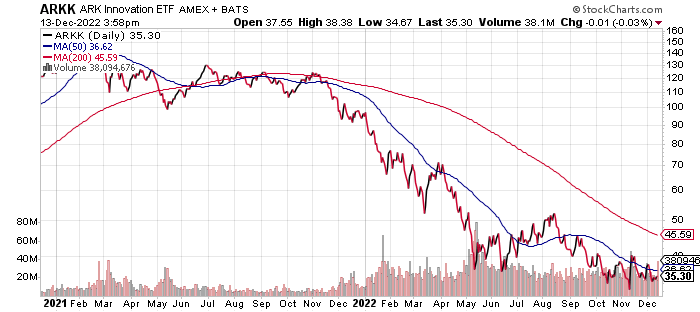
Now let’s look at a chart of the Dow (DIA):
Long-term chart of the DJIA (Marketsmith.com)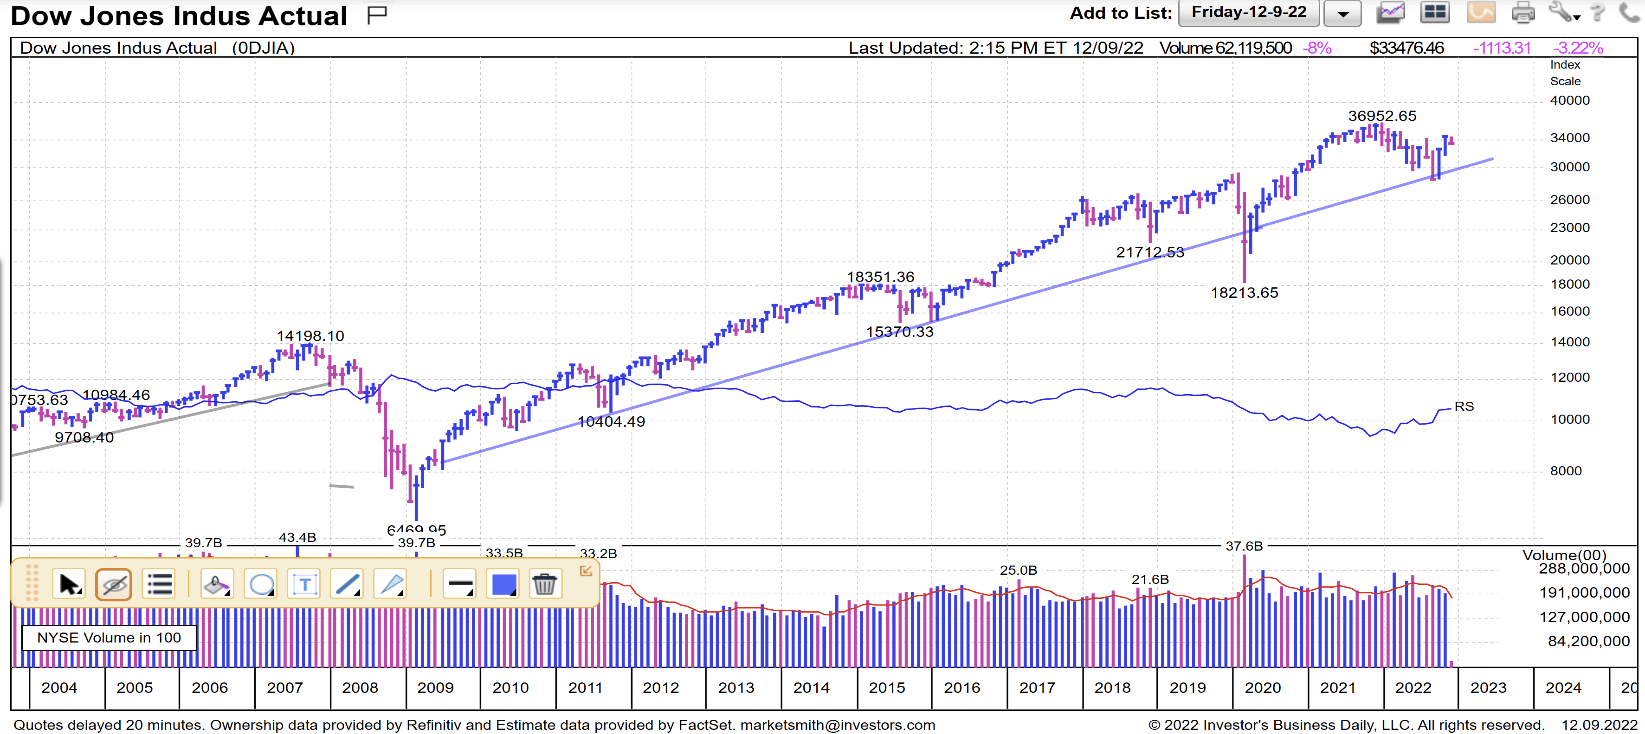
The DJIA is still in a Primary Uptrend that began back in March of 2009 with one short bear market during the COVID year of 2020. Can the DJIA break down below its current trendline and begin a primary downtrend? Yes. Can the DJIA continue in its primary uptrend and eventually hit new all-time highs? Yes. Once again, it all depends on which way earnings go from here.
Except for the extraordinary COVID year of 2020, earnings for the S&P 500 have been growing every year since 2009. This also applies to the Nasdaq and the DJIA. This earnings growth has fueled this long bull market.
Annual S&P 500 Earnings Growth (Gunderson Capital Mgt. Inc. )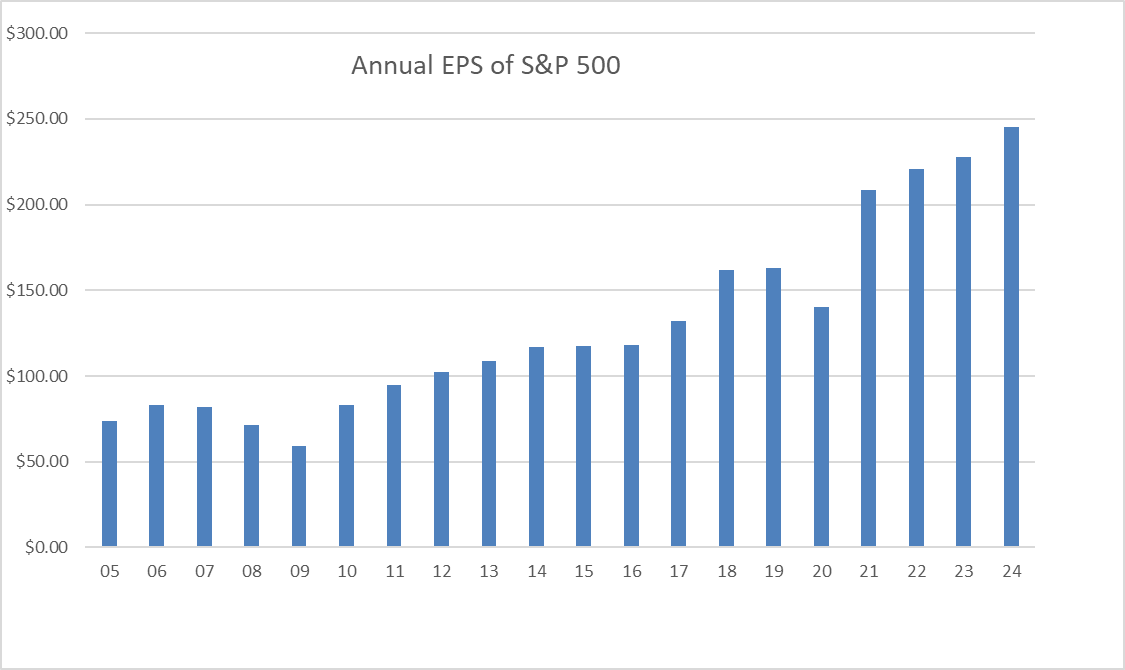
The last time that DJIA and S&P 500 earnings contracted was way back in 2007-2009. That contraction in earnings also fueled the last real bear market for these indexes. It should be noted that earnings estimates for 2008 began falling in late 2007 as the debt crisis began to worsen. That was a harbinger of a coming earnings contraction and accompanying bear market.
S&P 500 earnings and estimates finally bottomed in March 2009. Earnings ended up at $59.34 per share for the S&P 500 in 2009. As I stated earlier, they have been growing ever since. When we finally add in the earnings from the fourth quarter of 2022, we should come up with about $221 per share for this year.
That computes to total growth in earnings of 272% during that time. The S&P 500 has gone up 623% during that same period of time. Along the way, we also had sizeable multiple (PE ratio) expansion due to a falling interest rate environment. The forward.
Now the question is: Where do earnings go from here? Not only do markets and stocks follow earnings, but they also follow earnings expectations. As of now, our estimates for the S&P 500 are at $227 per share next year and $247 per share in 2024. We update these numbers every week as part of our weekly newsletter that we send out to our premium subscribers.
These earnings estimates and accompanying multiple are critical to developing our Macro Outlook each week and in the makeup of the five portfolios that we provide along with our service.
Now, let’s go back to a comparison of the long-term charts of the Nasdaq vs. the DJIA. This is a very important study. Why is the DJIA only down around 7.0% this year, while the Nasdaq is down about 30%?
Here’s the reason for this large disparity in returns between the two indexes.
There’s quite a difference between the 30 stocks that make up the Dow Jones Industrial Average vs. the 100 stocks that make up the Nasdaq Composite. In general, the stocks that make up the DJIA tend to be larger, slower-growing, more mature, shorter duration, lower PE ratio, and dividend-paying stocks.
The Nasdaq, on the other hand, generally consists of faster-growing, younger, longer-duration, and higher PE stocks. Some pay a dividend yield much most do not.
One could also say that in general, the Nasdaq stocks tend to be more growth oriented, while the DJIA stocks tend to be more value oriented. Value investing has been unpopular in recent years as the Nasdaq was ascending to 16,000 and leaving the DJIA and S&P 500 in its wake. The tide has finally turned this past year, however, and the tide may be coming in for value stocks for the next several years.
Why is this?
Much of the loss in the indexes this year has not been because of a drop in earnings growth. In fact, we will once again have record earnings this year, $221 per share from $208 per share last year. If indexes follow earnings, then why didn’t they hit new highs this past year? The biggest reason is that we saw a huge multiple contraction in 2022. This was caused by a sharp reversal from falling interest rates to a new, rising interest rate environment.
Consider that the S&P 500 began the year with a forward PE multiple of 23X. This was way outside of the normal boundaries which have been more in the 16-18X range. The market closed Friday at a forward PE ratio of 17.5X. The multiple has contracted by 24% this year while earnings have expanded by just 5%. The Nasdaq with its higher PE ratios is obviously going to get hit harder by shrinking multiples than the DJIA with its lower PE ratios.
With interest rates having more than doubled this year, and poised to go higher still, I would expect this favoritism towards lower PE ratios (value) vs. higher PE ratios (growth) to continue in 2023. As I previously stated, I update my latest Macro Forecast for 2023 and 2024 in the Macro Outlook section of this week’s newsletter (For Clients and Subscribers Only).
Interest Rate Chart (Stockchart.com)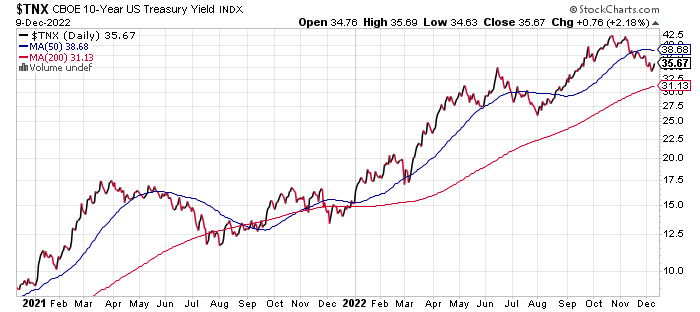
My current 12-month target price of the S&P 500 is 4,200. With just a 4.2% upside potential for the S&P 500 over the next 12 months, this means that investors will have to identify sectors and individual stocks that can deliver alpha above and beyond the indexes.
We continue to favor lower PE, dividend-paying stocks that are still growing their earnings. We mentioned our three most recent buys in our last article.
The risks to our target price and thesis on the overall market are a deep recession, continue inflation, and geopolitical events.
Be the first to comment