


If there is one place our articles belong, it is in the trending section.
MCCAIG/iStock via Getty Images
Get ready for charts, images, and tables because they are better than words. The ratings and outlooks we highlight here come after Scott Kennedy’s weekly updates in the REIT Forum. Your continued feedback is greatly appreciated, so please leave a comment with suggestions.
In this article I want to help investors with an understanding how to pick between similar shares. However, first I know investors are going to want a handful of picks for shares that are currently looking pretty cheap. The NAV estimates I’m referencing when we highlight these picks are our estimates from late June, but they aren’t reflecting the very end of the quarter. We take a little extra time to really drill in on the end-of-quarter values as part of our process for preparing for the earnings announcements.
Note: Prices are as of the July 4th weekend. On 7/5/2022 price movements were relatively small and do not change our outlook on any of these stocks. The three shares we mentioned all rallied, but it was only 2.33% for MFA and less than 1% for the two BDCs.
PSEC
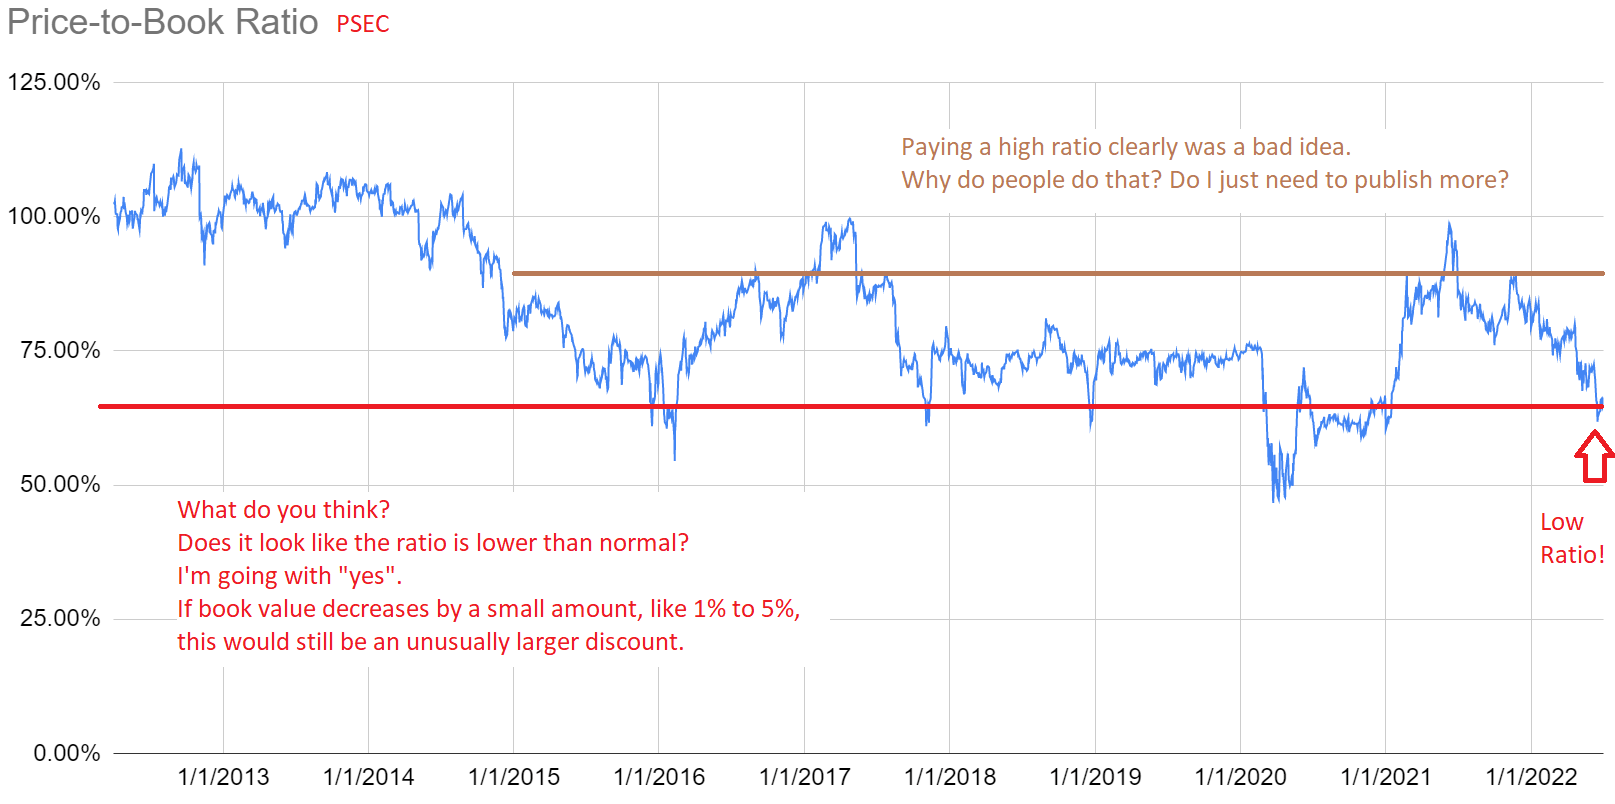
Prospect Capital (PSEC) is one of the higher-risk BDCs in our view, but it is cheap enough to be attractive. Shares trade at a price-to-NAV ratio of about .67 and a dividend yield of 10.3%. The BDC has gone in and out of favor with investors over the years. That resulted in some swings in the price-to-book ratio, but .67 is low enough to give investors some upside to go along with the yield. What about buying PSEC when the price-to-book ratio is high and just hoping for the best? I hate that idea. No. The risk/reward is only attractive at a big discount. Let’s look at the historical range for price-to-trailing book value:
The REIT Forum
Does it make sense now? Is anyone still confused about the idea? Let me simplify it. Paying less than 70% of book value leads to gains. Paying around 90% of book value or more leads to much weaker returns. When shares travel from a .70x to a .90x ratio, assuming no change in book value, the share price would increase by 28%. That’s a BIG increase to returns.
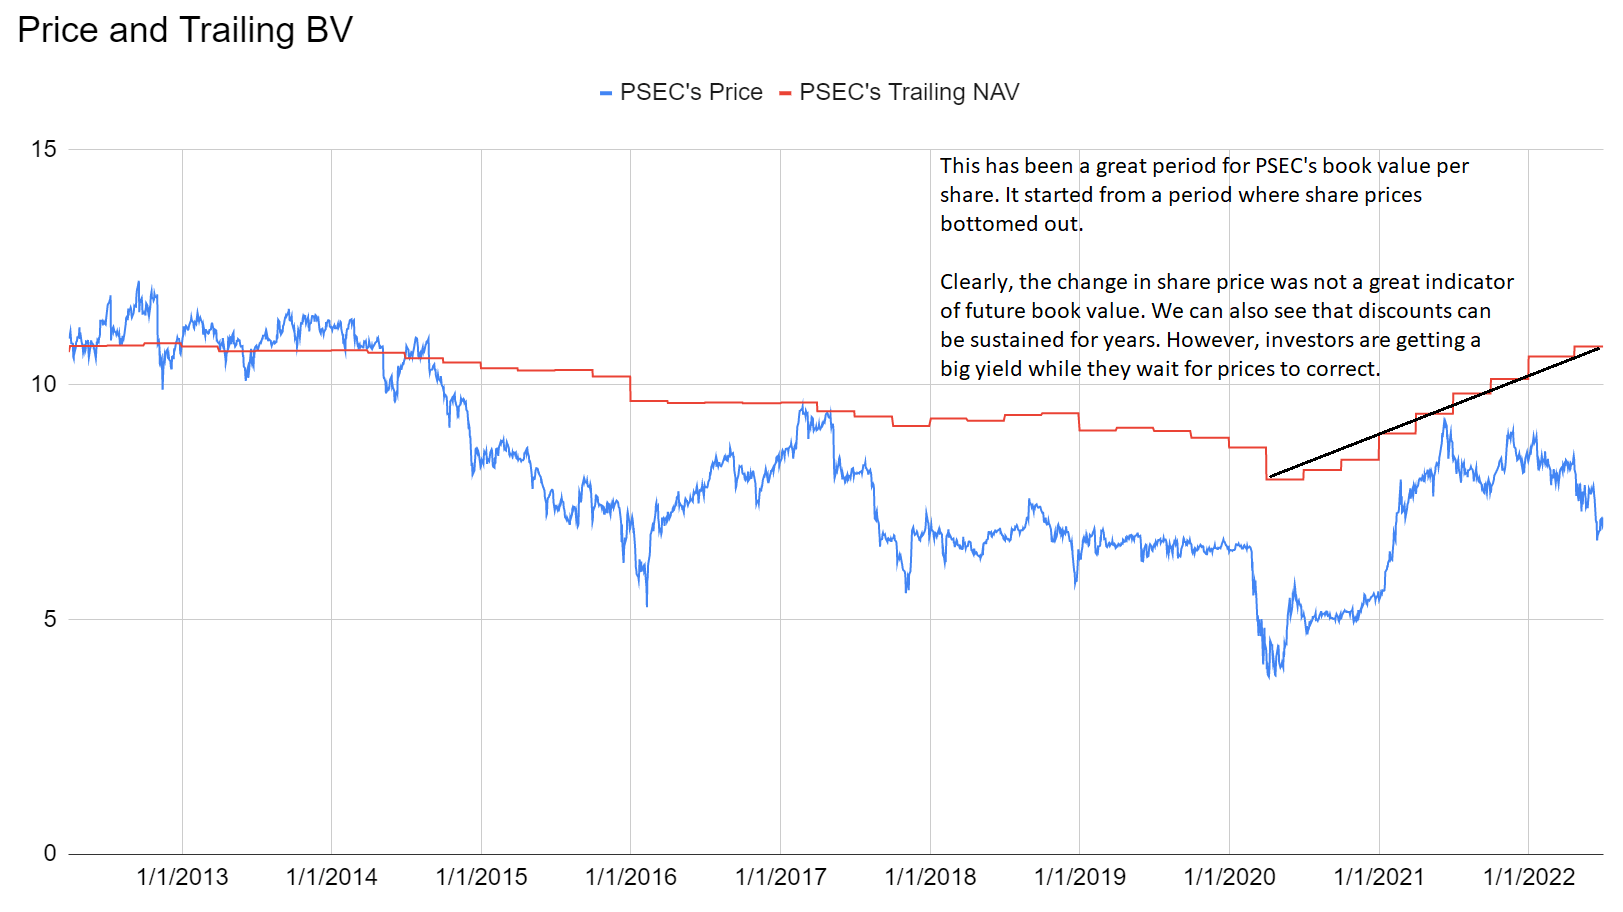
Some investors believe a falling share price indicates that book value is about to plunge. While plunging book value is one factor that can cause a share price to plunge, it sure hasn’t been a good theory here:
The REIT Forum
Share prices simply have not been a great predictor of future book value. However, book value has been pretty effective at indicating a ceiling for share prices.
SLRC
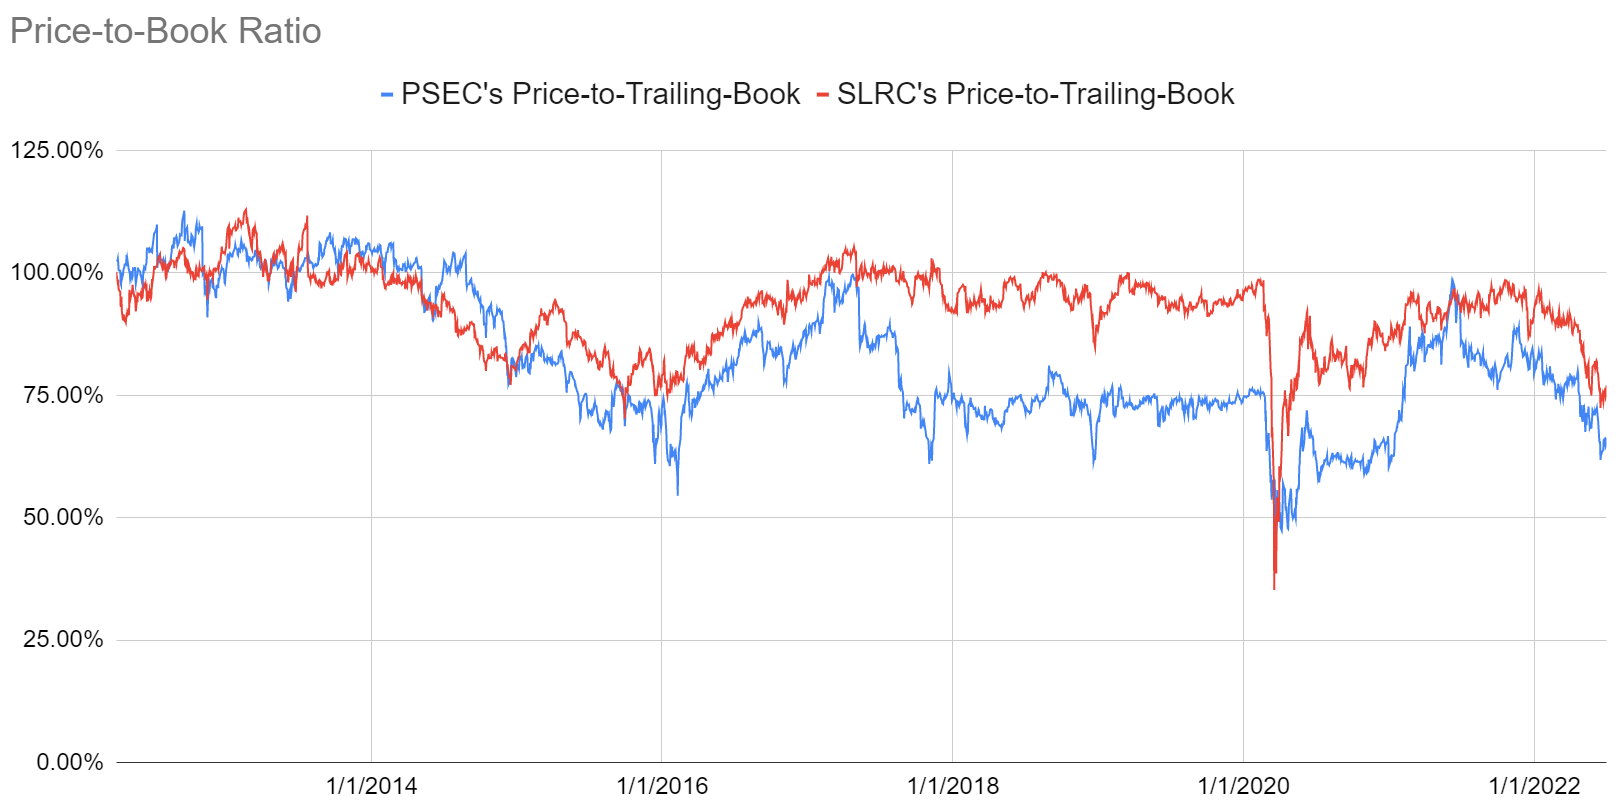
SLR Investment Corp. (SLRC) trades at a higher ratio, about .79 using our estimates. However, it carries a 10.9% dividend yield, and we find shares quite attractive at this valuation. They carry a bit less risk, which merits a higher price-to-NAV ratio. In SLRC’s case, a .79 ratio is quite attractive.
As you can see from this chart, over the last 6 years SLRC usually traded at a higher price-to-book ratio than PSEC:
The REIT Forum
The current ratio is almost the lowest it has gone outside of March and April 2020.
MFA
MFA Financial (MFA) also gets a quick reference. Price-to-estimated-book is around .66. That’s higher than the .62 price-to-trailing book value. Since both formulas use the same share price, you can tell that our estimate for book value is clearly down on the quarter. To be clear, we are estimating declines in book value during Q2 2022 for most of the mortgage REITs. This was another hard quarter for the fundamentals, but it wasn’t as bad for the fundamentals as it was for the share prices.
As of preparing this article, the major mortgage REIT ETFs are down about 20% year-to-date with about 75% of that decline occurring in Q2 2022 (April and June specifically). While we are projecting declines in BV, the projected declines are generally smaller than the price declines. That’s important because it means a much lower price-to-book ratio.
Why are BVs down? Part of the hit to book value simply comes from rates moving higher quickly, but we also some widening of spreads. That’s very favorable for reinvesting and it gives the mortgage REITs a much better position for performing on book value in the second half of the year. Ironically, when spreads are already wide and mortgage REITs can earn more from each dollar of book value, the price-to-book ratio is often lower. When spreads are tight, investors tend to pile in and push price-to-book ratios up too high. That’s why you can see such a large swing in the valuation.
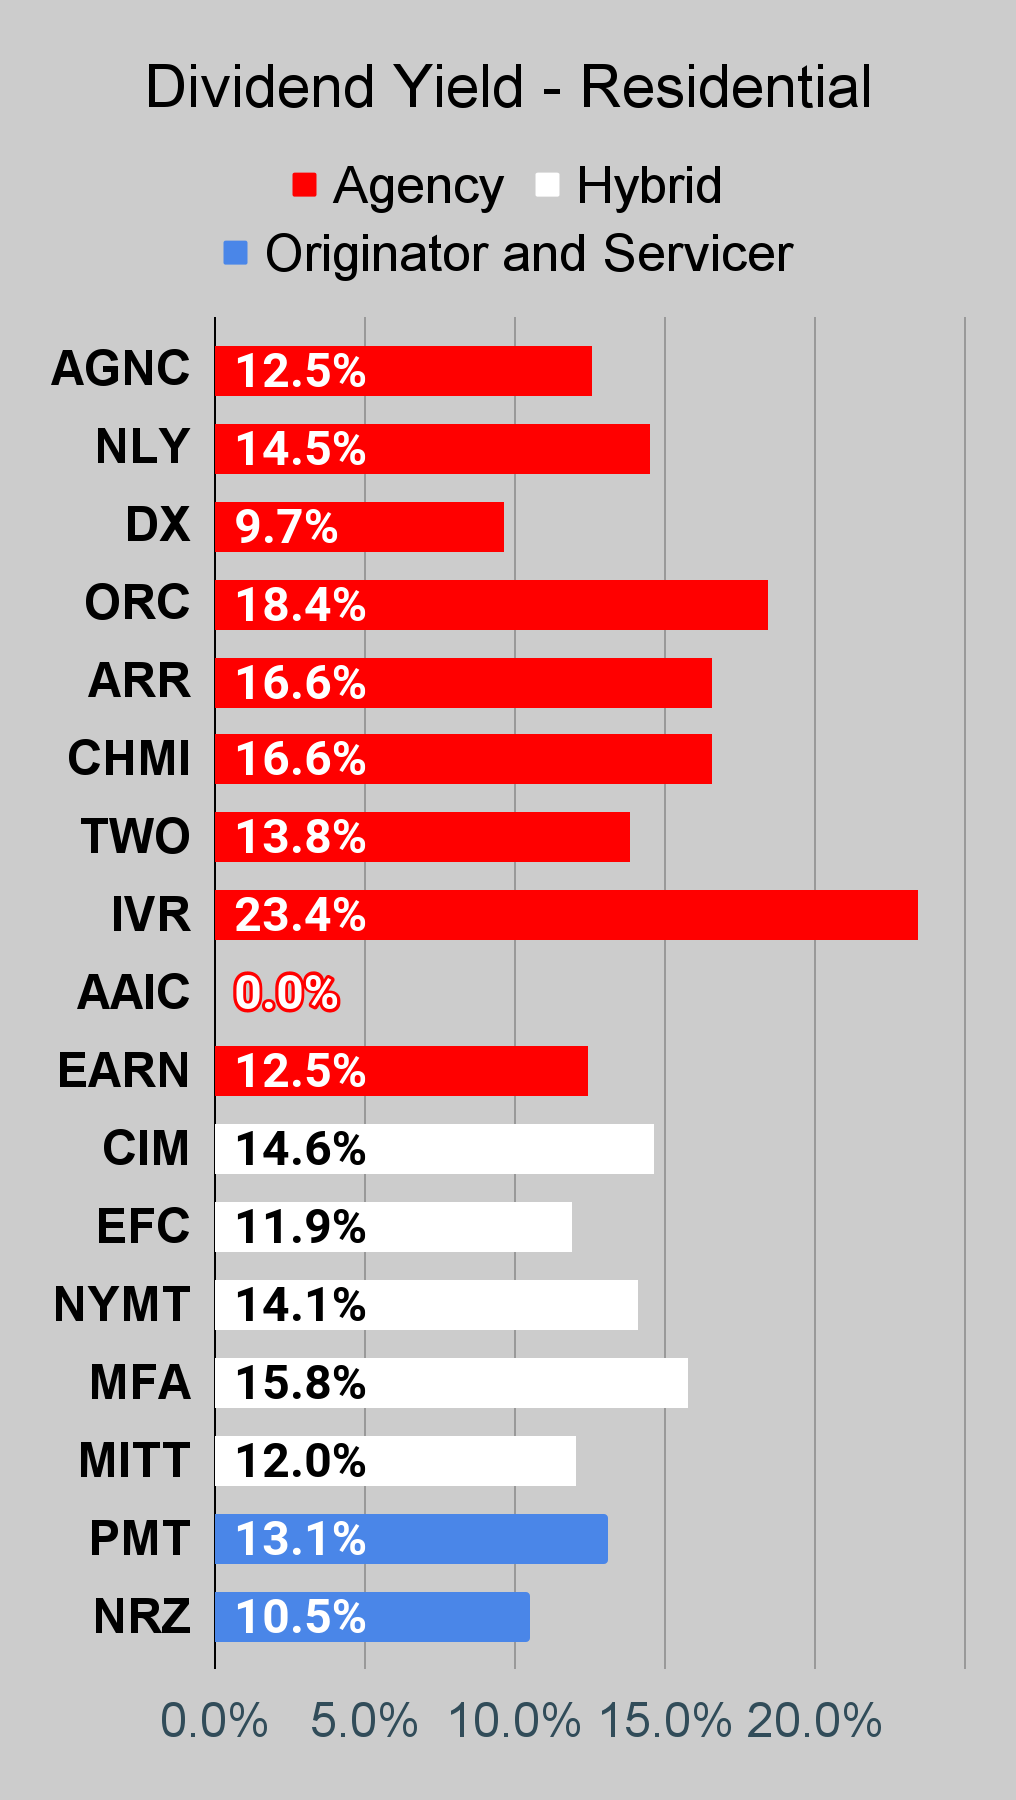
Due to MFA trading at such a large discount to projected NAV, shares carry a 15.8% dividend yield. That’s absurdly high. However, the same dividend rate only represents a 10.5% yield on book value, which isn’t uncommon. You can’t expect a mortgage REIT to earn 15.8% on book value. However, doing around 10% to 11% is much more reasonable. That’s part of why the difference between share price and book value is so important.
For anyone who reads that as “close your eyes and buy the biggest yield”, go dollar cost average into an index. I am absolutely not advocating chasing yields. We approach these positions with careful due diligence, which is critical to our record of success.
The rest of the charts in this article may be self-explanatory to some investors. However, if you’d like to know more about them, you’re encouraged to see our notes for the series.
Stock Table
We will close out the rest of the article with the tables and charts we provide for readers to help them track the sector for both common shares and preferred shares.
We’re including a quick table for the common shares that will be shown in our tables:
Let the images begin!
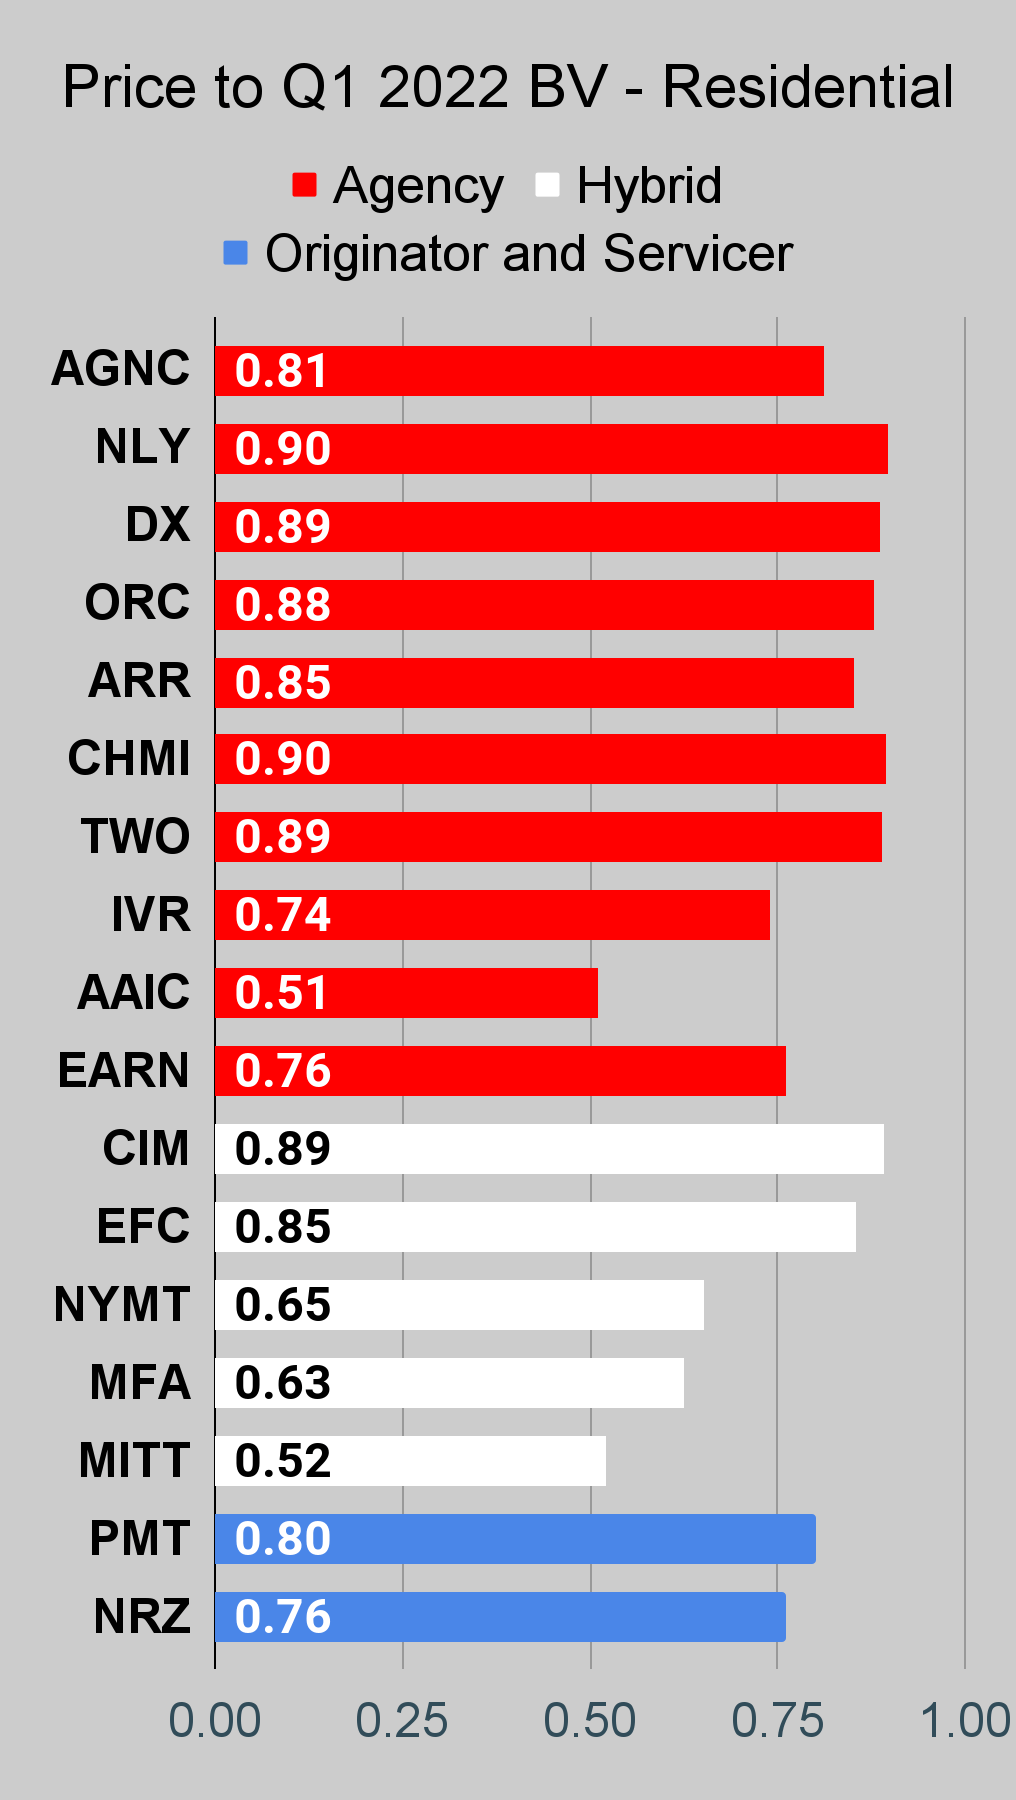
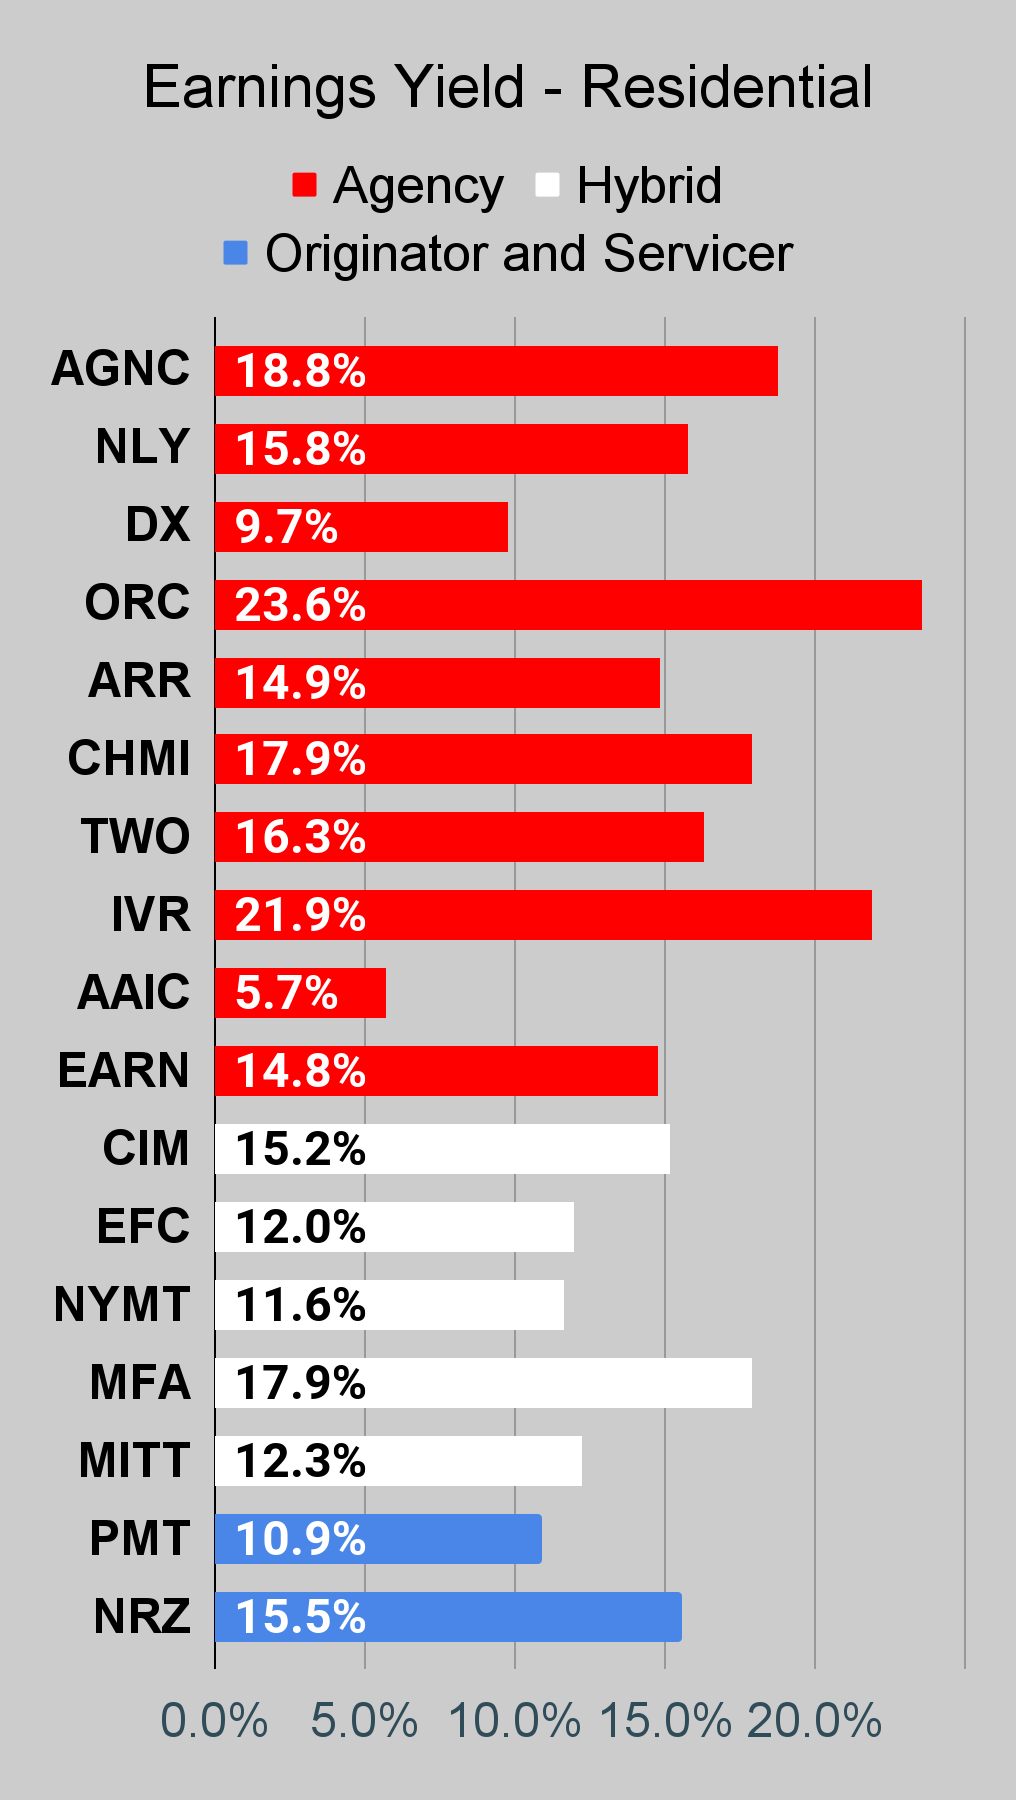
Residential Mortgage REIT Charts
Note: The chart for our public articles uses the book value per share from the latest earnings release. Current estimated book value per share is used in reaching our targets and trading decisions. It is available in our service, but those estimates are not included in the charts below.
 The REIT Forum |
 The REIT Forum |
 The REIT Forum |
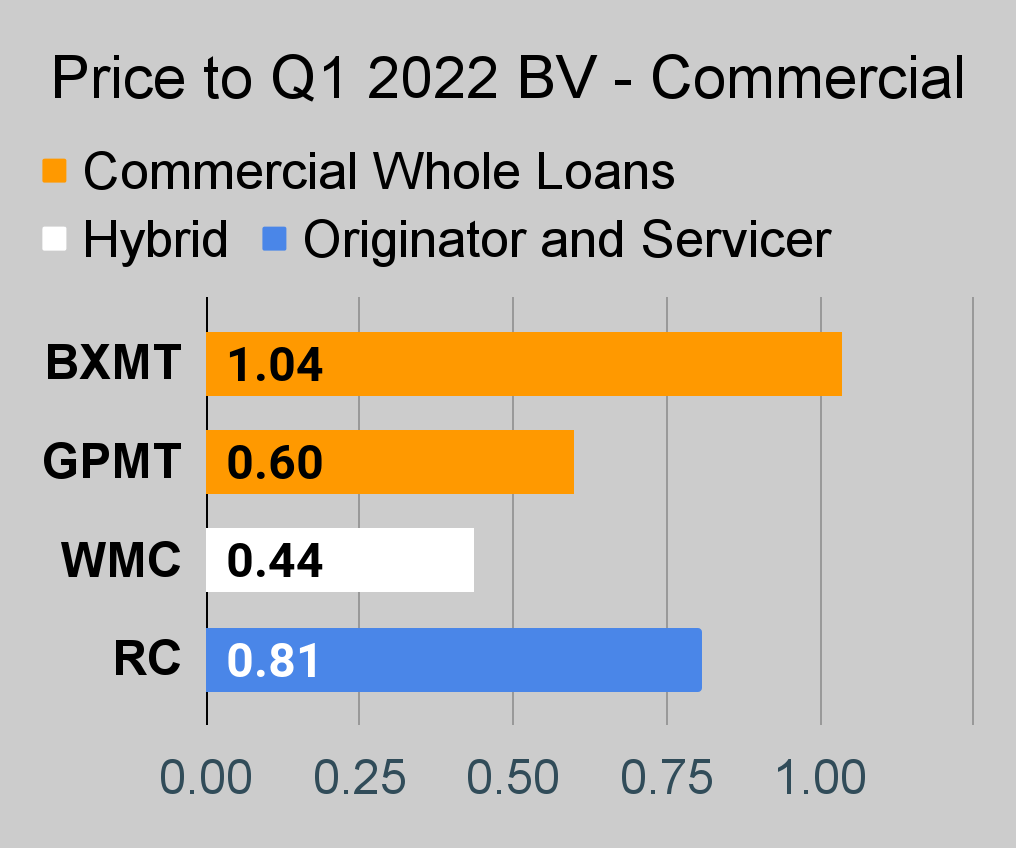
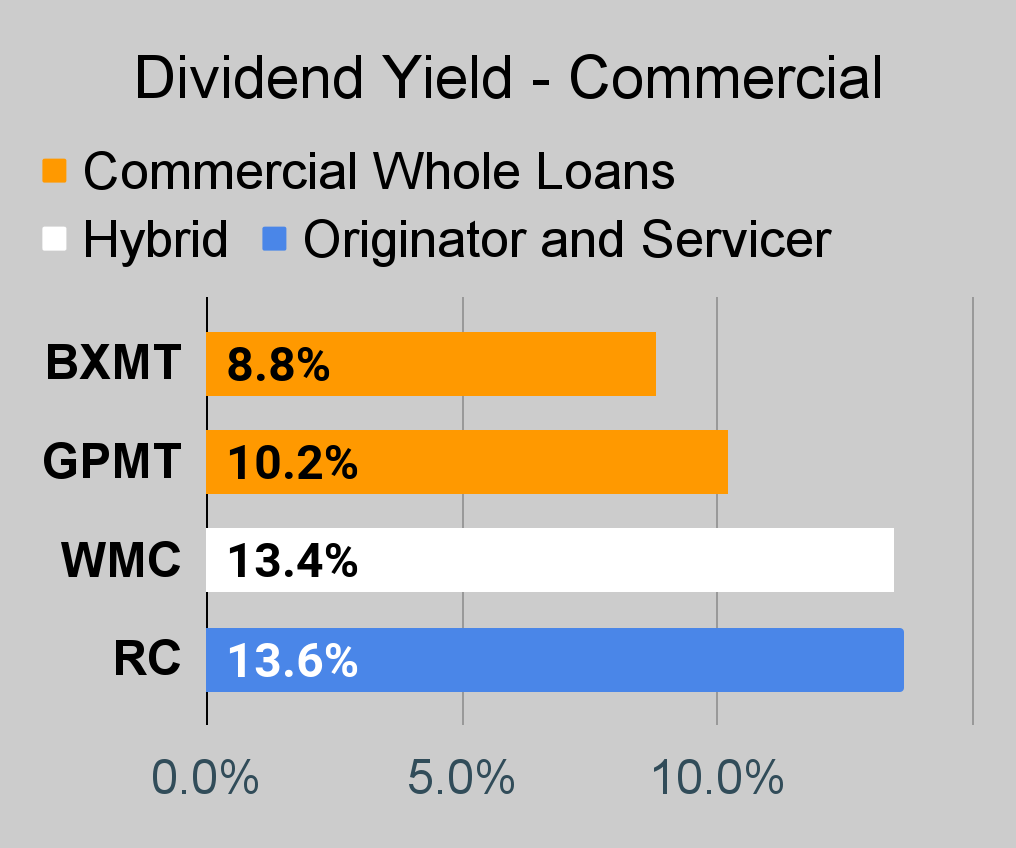
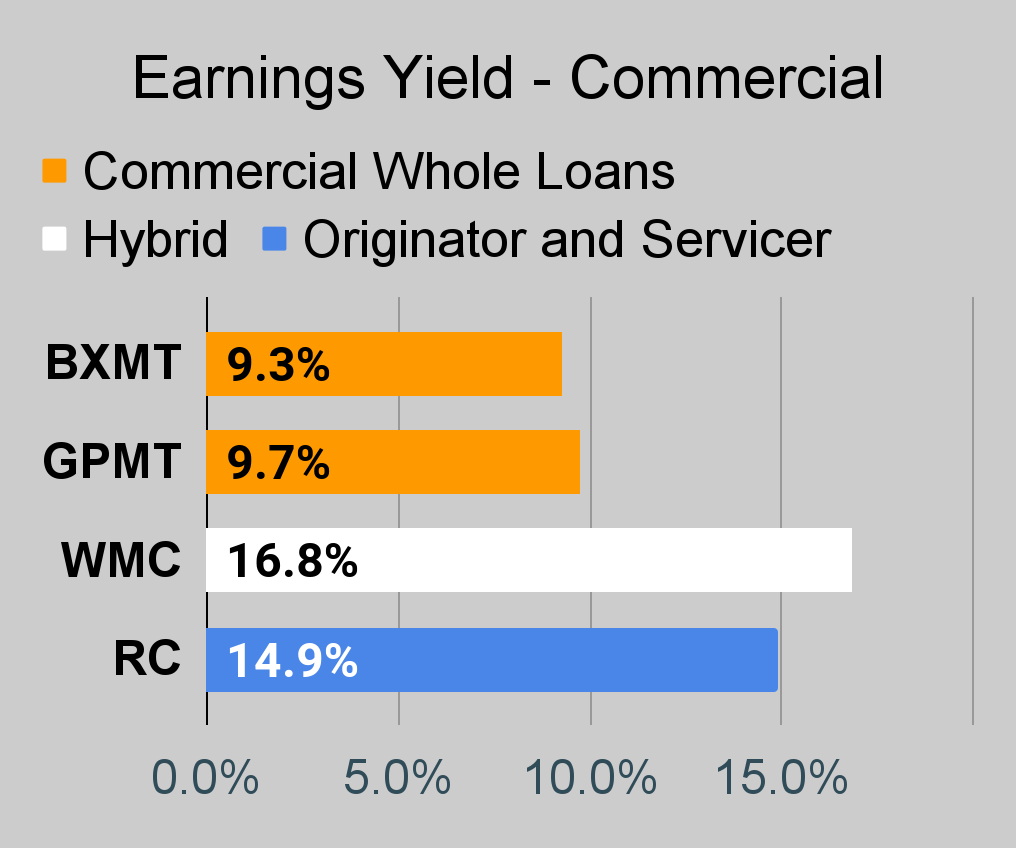
Commercial Mortgage REIT Charts
 The REIT Forum |
 The REIT Forum |
 The REIT Forum |
BDC Charts
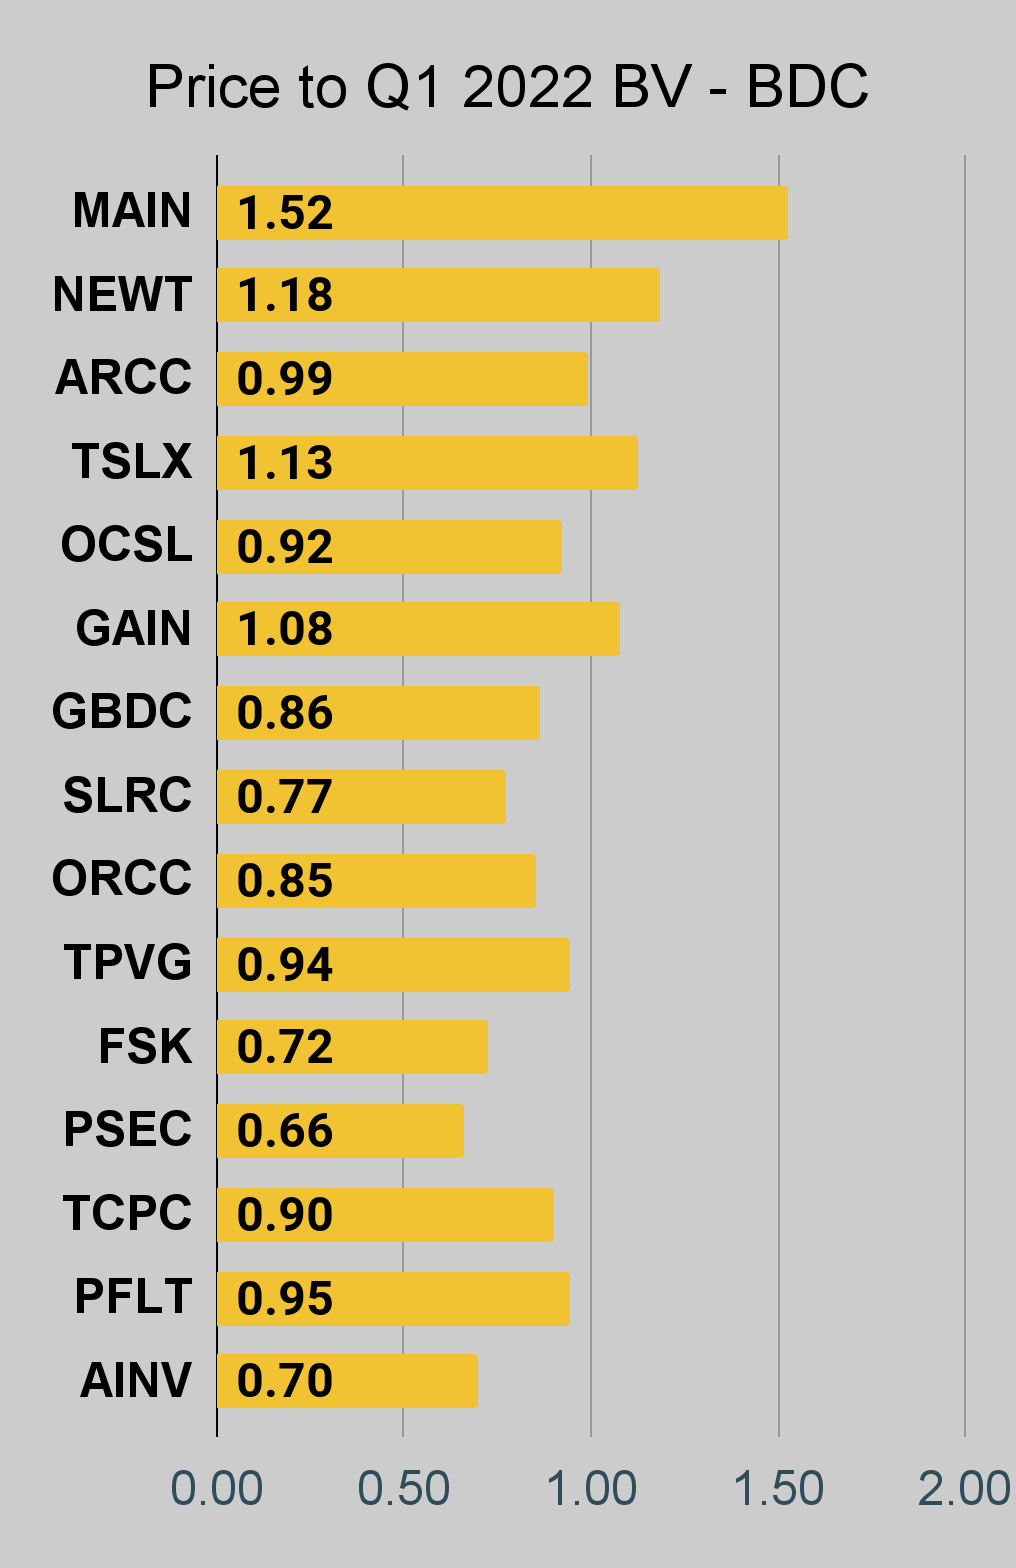 The REIT Forum |
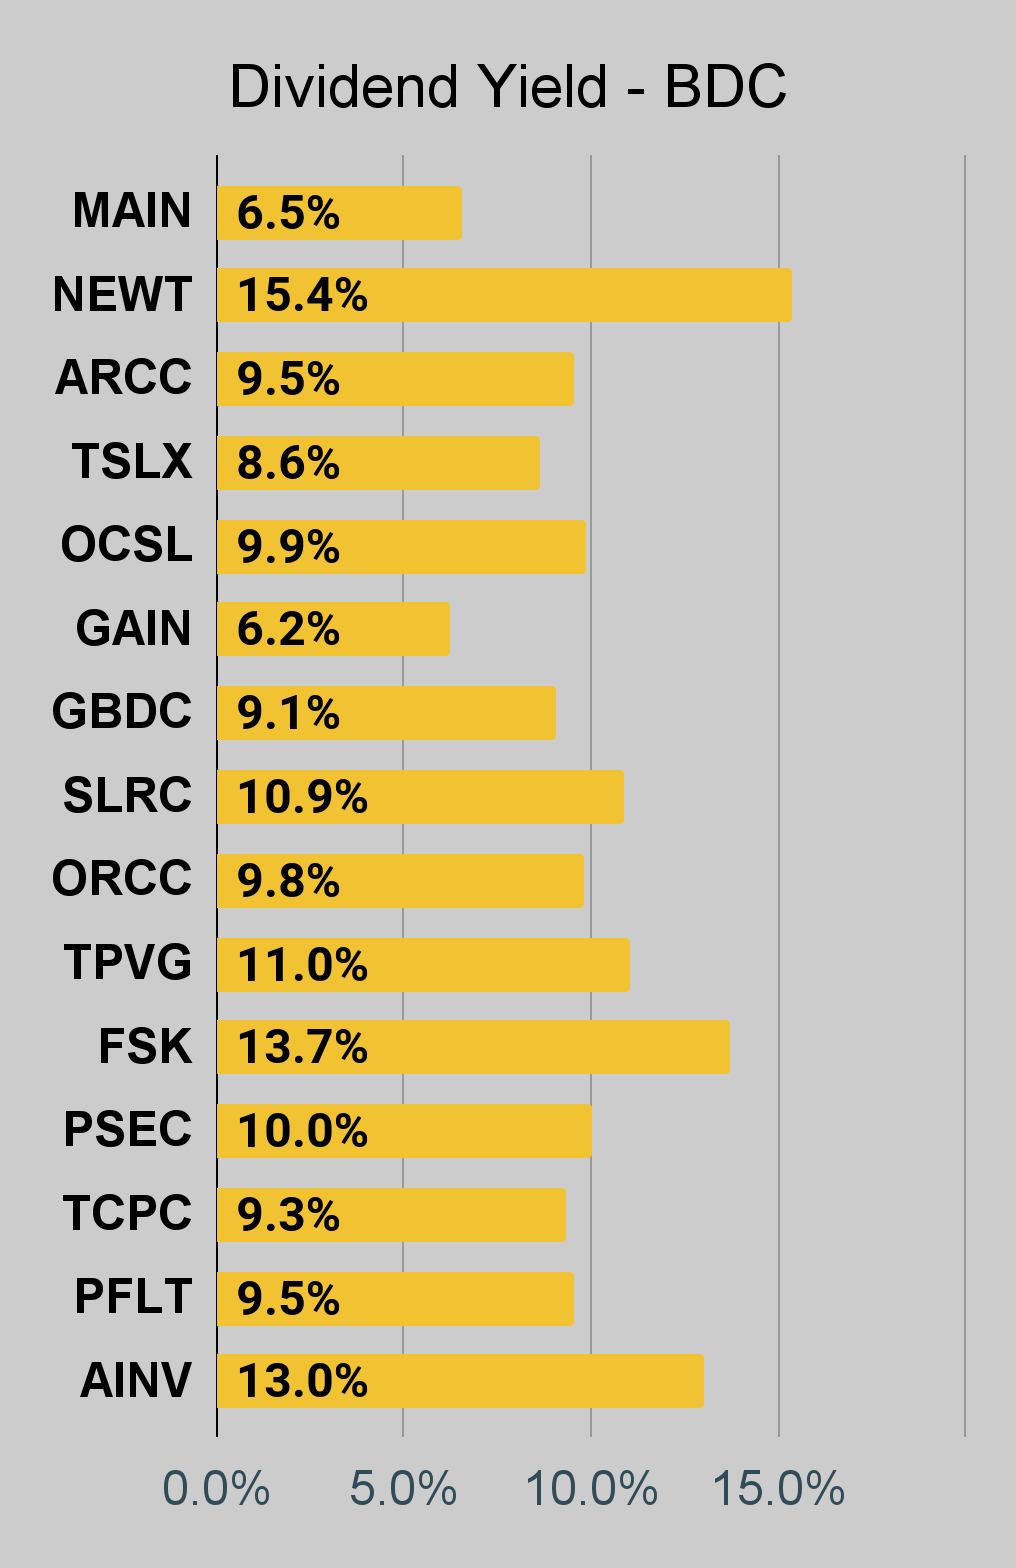 The REIT Forum |
 The REIT Forum |
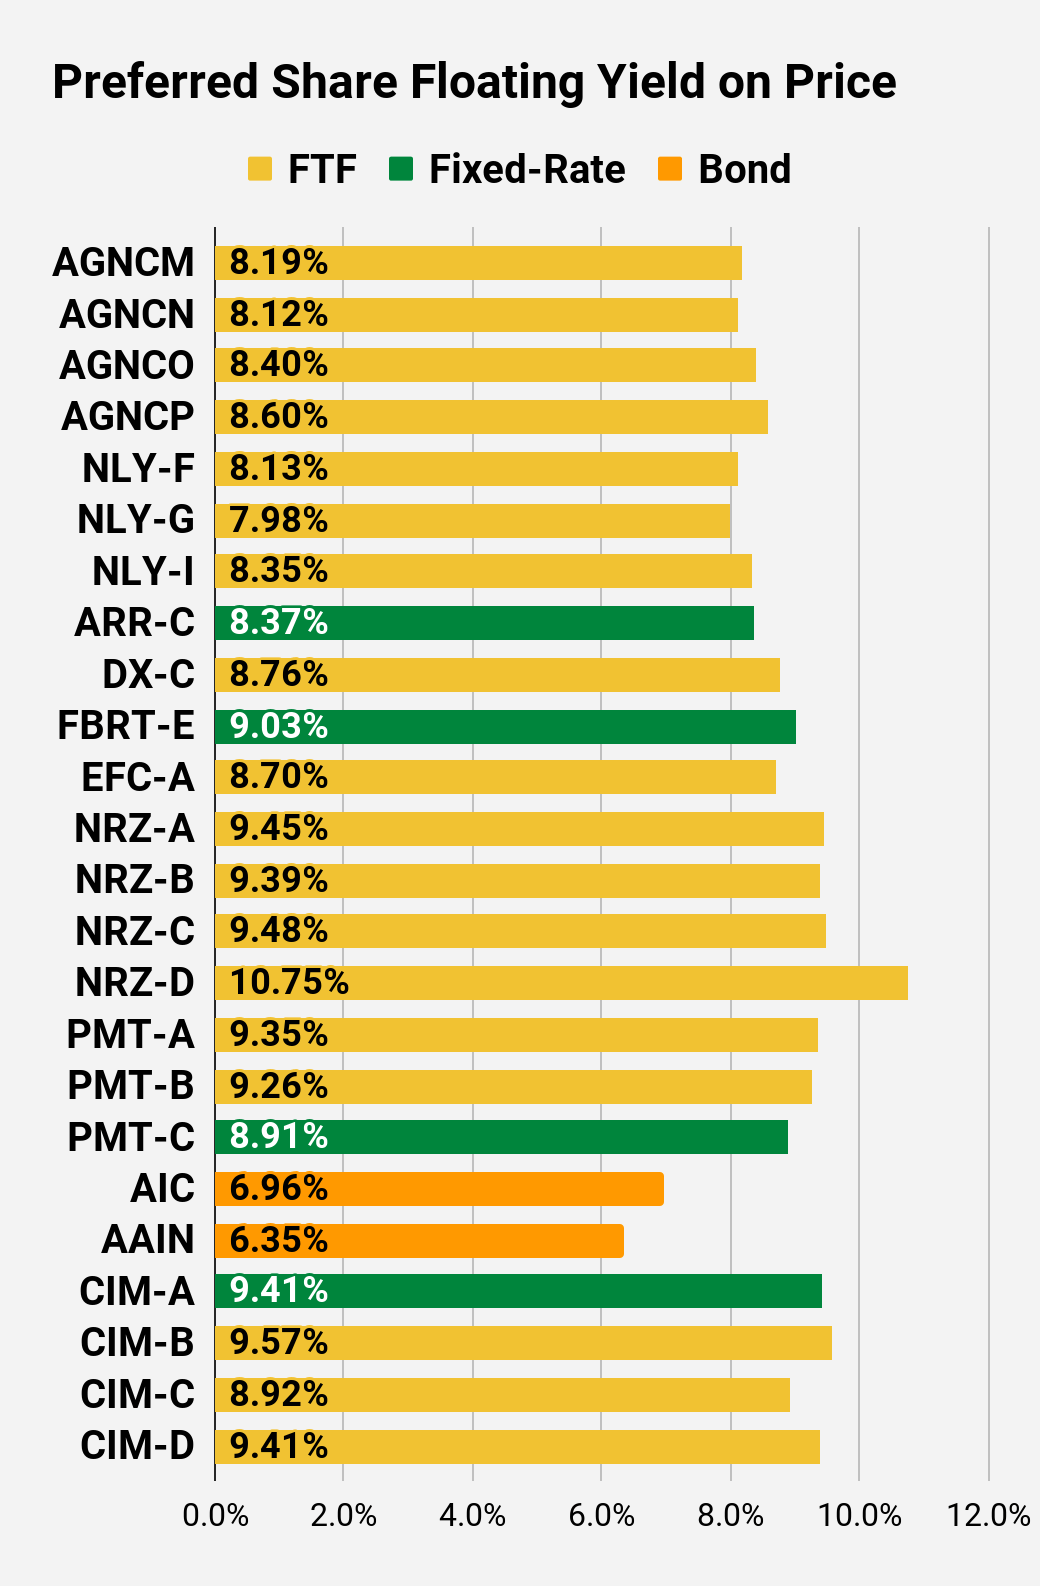
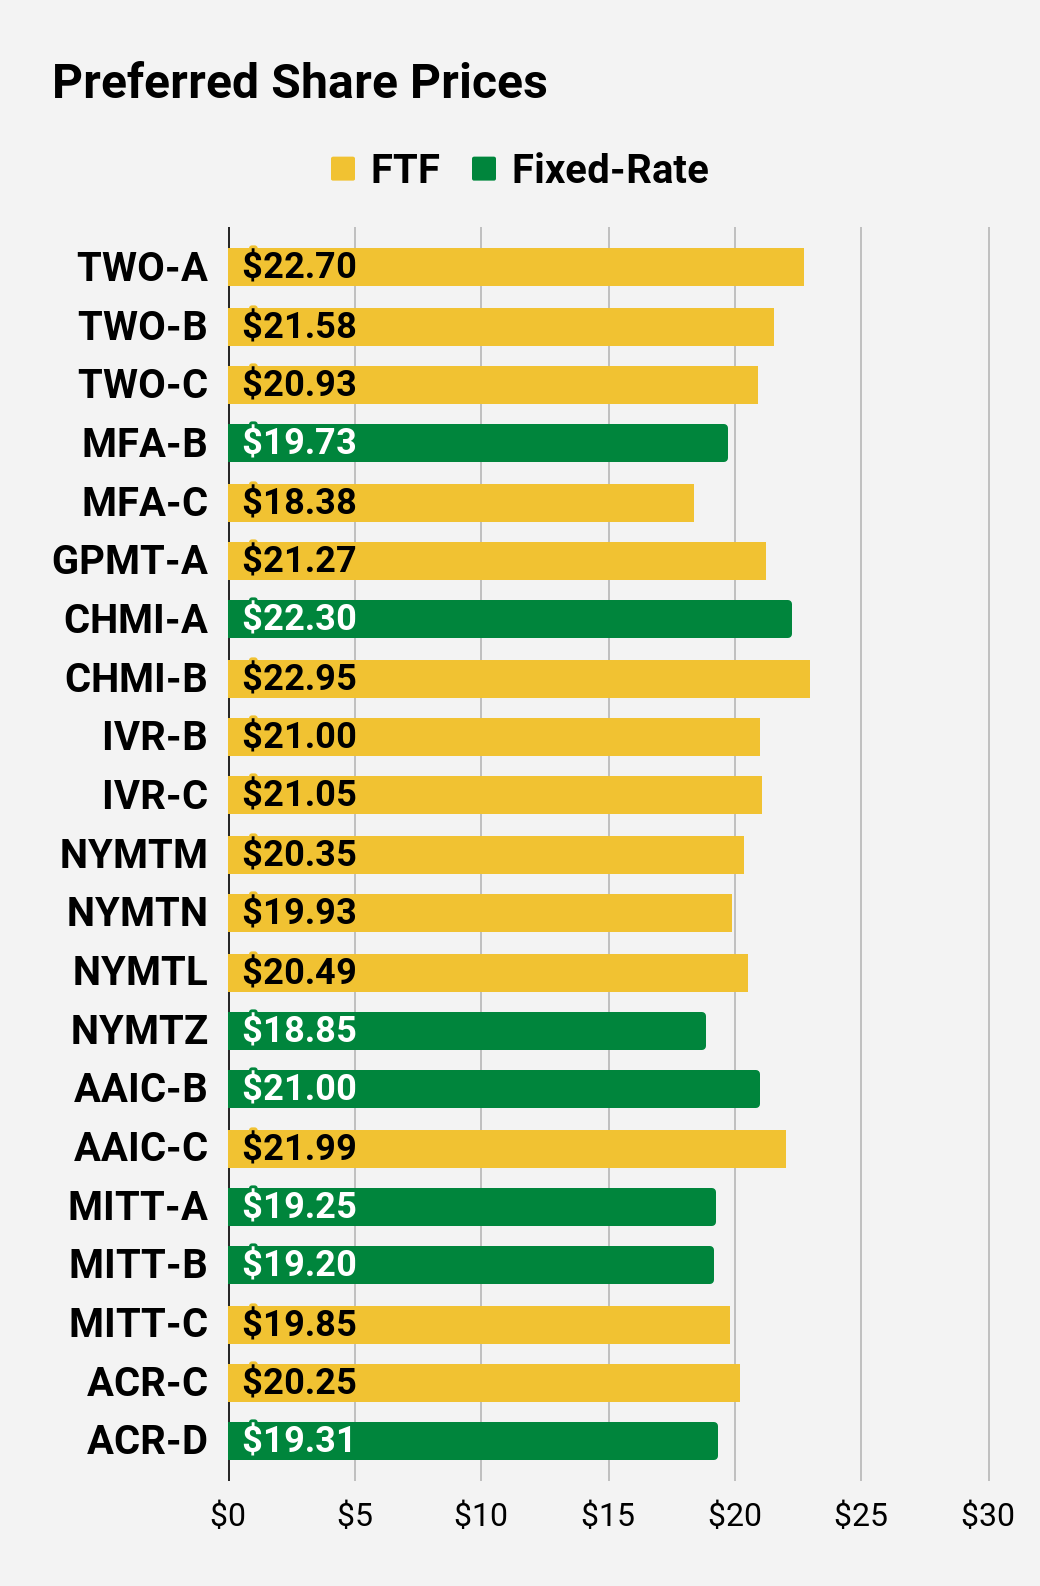
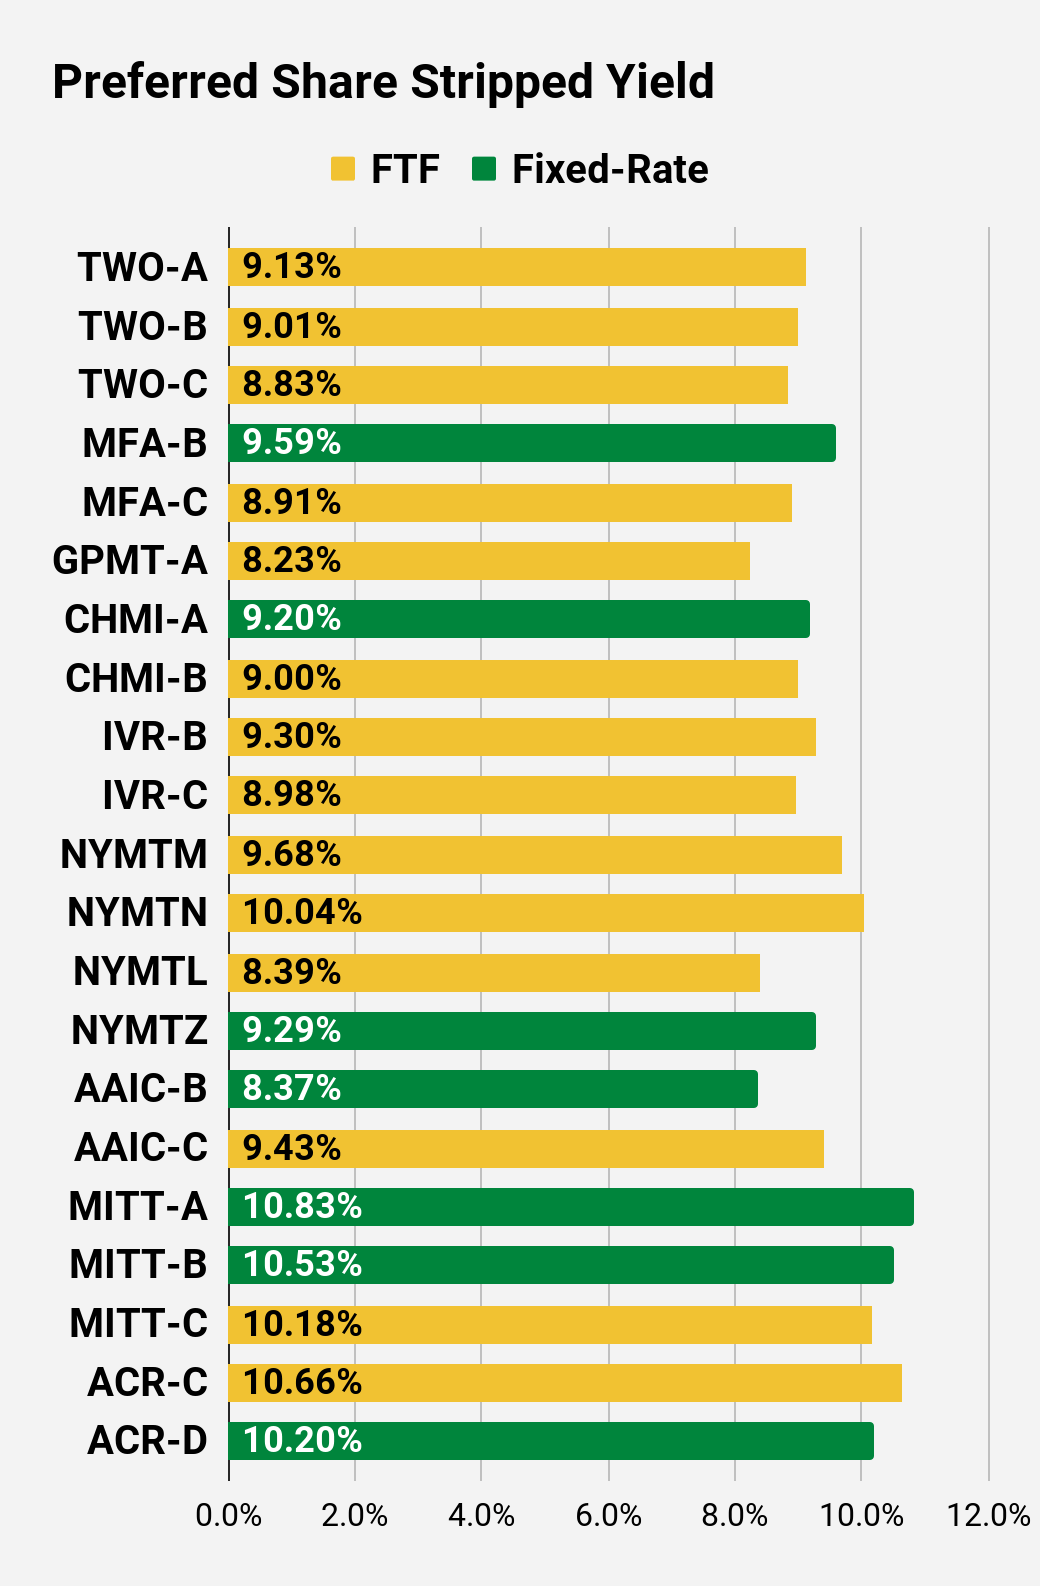
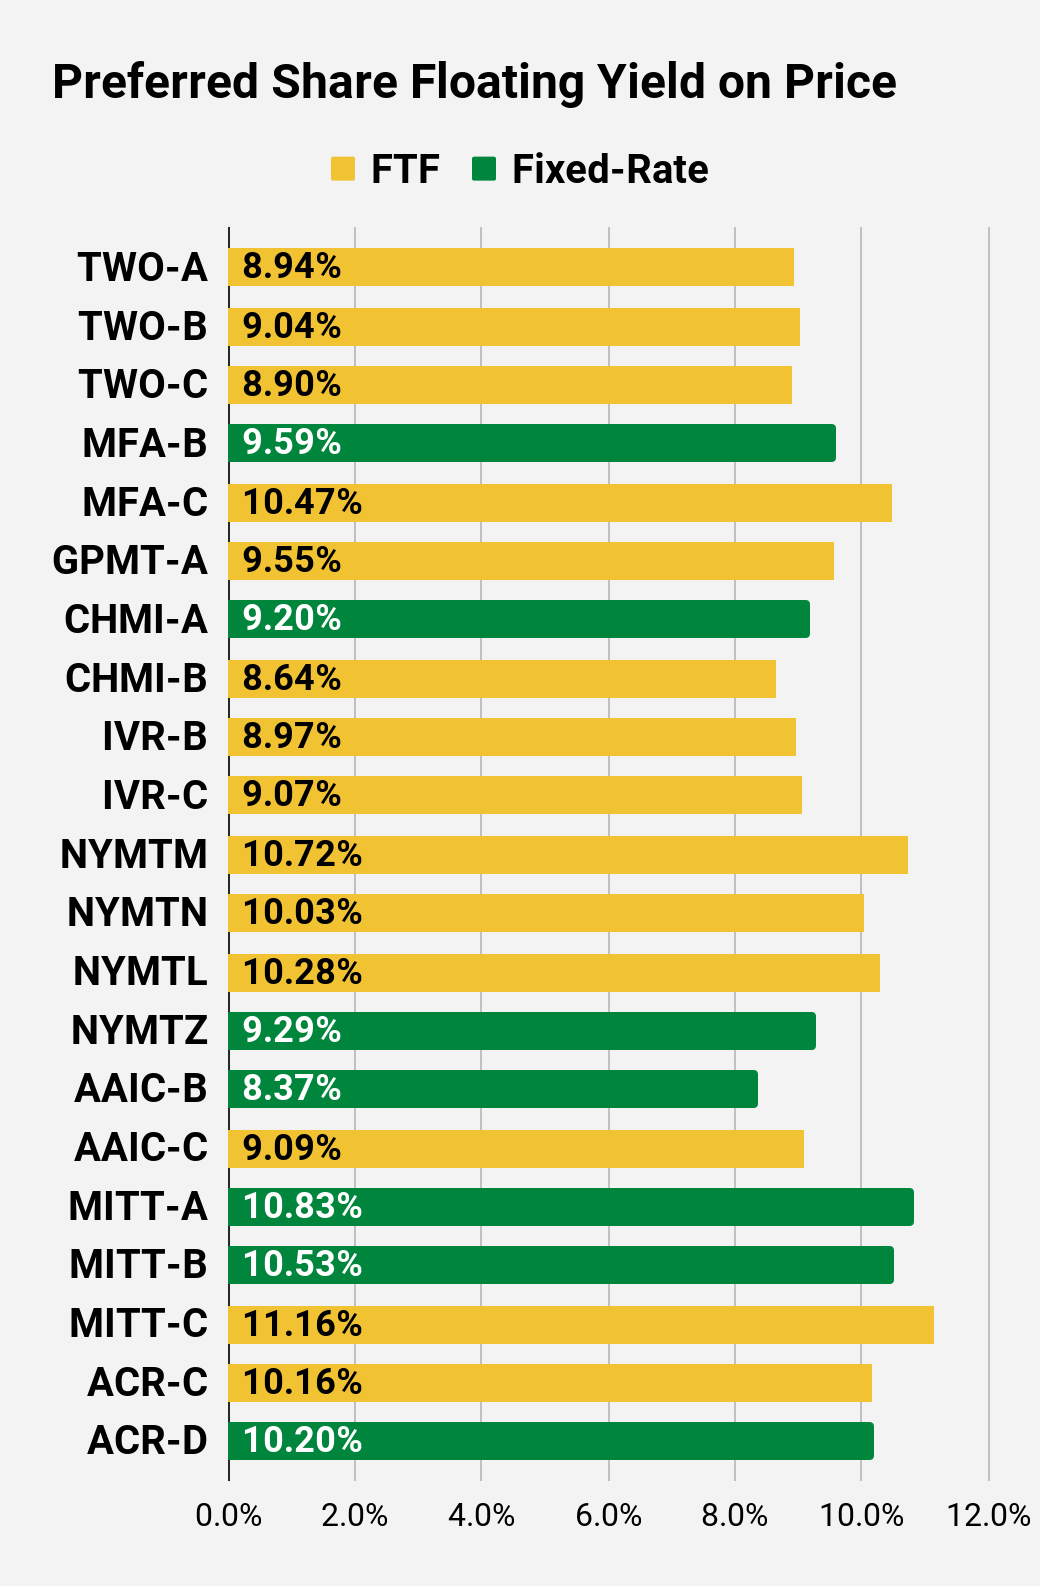
Preferred Share Charts
 The REIT Forum |
 The REIT Forum |
 The REIT Forum |
 The REIT Forum |
 The REIT Forum |
 The REIT Forum |
Preferred Share Data
Beyond the charts, we’re also providing our readers with access to several other metrics for the preferred shares.
After testing out a series on preferred shares, we decided to try merging it into the series on common shares. After all, we are still talking about positions in mortgage REITs. We don’t have any desire to cover preferred shares without cumulative dividends, so any preferred shares you see in our column will have cumulative dividends. You can verify that by using Quantum Online. We’ve included the links in the table below.
To better organize the table, we needed to abbreviate column names as follows:
- Price = Recent Share Price – Shown in Charts
- BoF = Bond or FTF (Fixed-to-Floating)
- S-Yield = Stripped Yield – Shown in Charts
- Coupon = Initial Fixed-Rate Coupon
- FYoP = Floating Yield on Price – Shown in Charts
- NCD = Next Call Date (the soonest shares could be called)
- Note: For all FTF issues, the floating rate would start on NCD.
- WCC = Worst Cash to Call (lowest net cash return possible from a call)
- QO Link = Link to Quantum Online Page
Second Batch:
Strategy
Our goal is to maximize total returns. We achieve those most effectively by including “trading” strategies. We regularly trade positions in the mortgage REIT common shares and BDCs because:
- Prices are inefficient.
- Long-term, share prices generally revolve around book value.
- Short-term, price-to-book ratios can deviate materially.
- Book value isn’t the only step in analysis, but it is the cornerstone.
We also allocate to preferred shares and equity REITs. We encourage buy-and-hold investors to consider using more preferred shares and equity REITs.
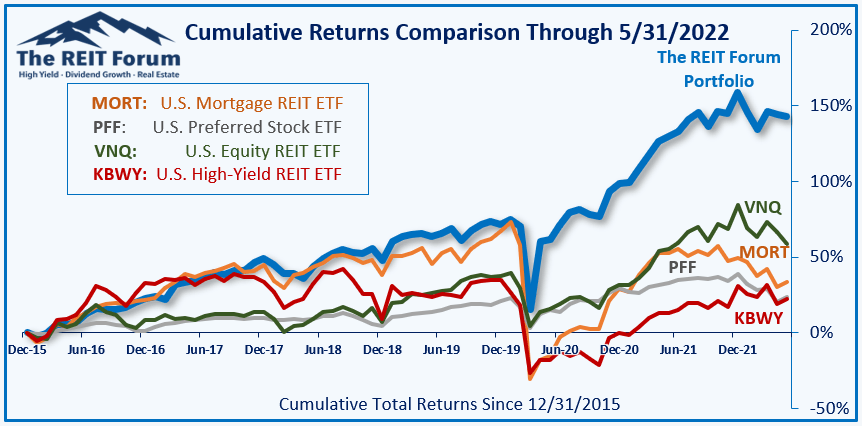
Performance
We compare our performance against 4 ETFs that investors might use for exposure to our sectors:
The REIT Forum
The 4 ETFs we use for comparison are:
|
Ticker |
Exposure |
|
One of the largest mortgage REIT ETFs |
|
|
One of the largest preferred share ETFs |
|
|
Largest equity REIT ETF |
|
|
The high-yield equity REIT ETF. Yes, it has been dreadful. |
When investors think it isn’t possible to earn solid returns in preferred shares or mortgage REITs, we politely disagree. The sector has plenty of opportunities, but investors still need to be wary of the risks. We can’t simply reach for yield and hope for the best. When it comes to common shares, we need to be even more vigilant to protect our principal by regularly watching prices and updating estimates for book value and price targets.
Ratings:
- Bullish on PSEC, SLRC, and MFA
Be the first to comment