

Khosrork
My fellow Dividend King, Chuck Wilton, recently brought this article to my attention.
Bank of America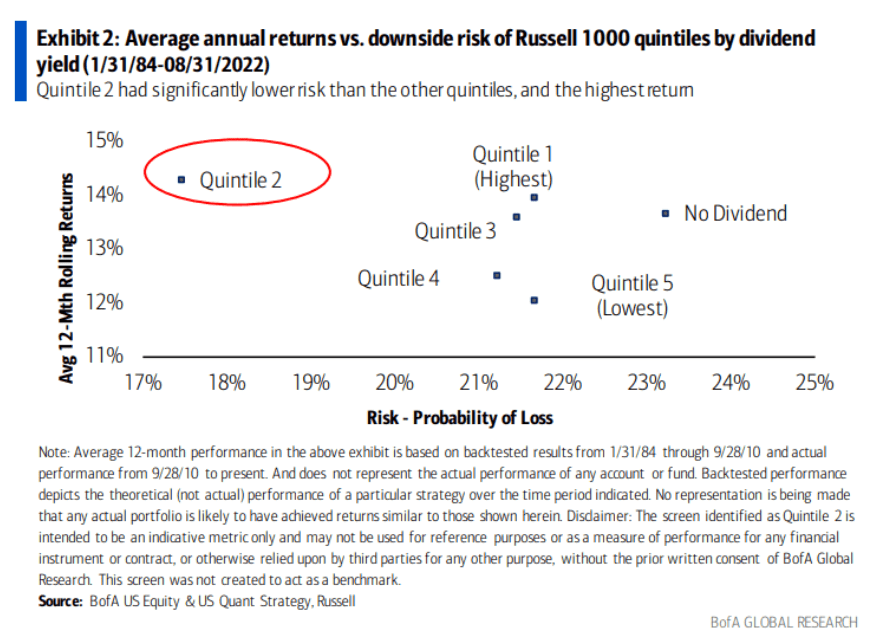
This research, which finds that 2nd quintile dividend yielders perform the best over time, and with the lowest negative volatility, is corroborated by other research.
WisdomTree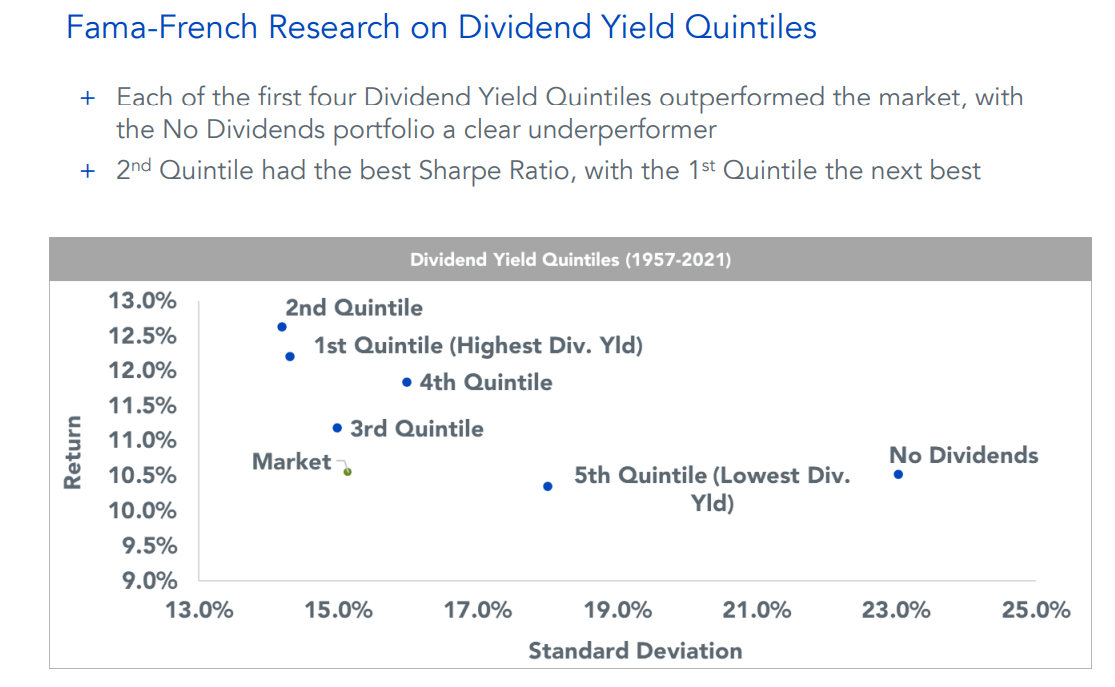
Since 1957, 2nd quintile yielding dividend stocks have delivered the lowest volatility and the highest returns, just as they have since 1984.
Why is this? Because the 2nd quintile in dividend yield tends to be the “sweet spot” for dividend blue-chips.
Companies that yield a lot, paying out most of their cash flow as dividends, are slower-growing mature businesses. They pay out high dividends because management doesn’t have any way to reinvest into strong growth at high returns on capital.
Companies with no dividends historically perform poorly and with high volatility. Why? Because their management teams often embark on destructive empire-building. And because they don’t pay dividends, they lack the reliable income investor base that tends to smooth out returns in corrections and bear markets.
- For example, dividend aristocrat investors are in it for the safe and growing yield
- and are some of the last to panic sell when times get rough
2nd quintile dividend stocks are the sweet spot, often super-powered blue-chips, because:
- they have a consistent track record of disciplined capital allocation
- including consistently growing dividends
- but retain enough cash flow to grow the business at a faster rate
What is the 2nd quintile in terms of yield? According to Bank of America 2.8% to 3.5% is the dividend sweet spot.
So for this article, I wanted to highlight two of my favorite bear market sweet spot high-yield dividend blue-chips.
Let’s take a look why Broadcom (AVGO) and Comcast (CMCSA) are two incredible long-term buying opportunities you might want to consider in these turbulent times.
Broadcom: The Berkshire Hathaway Of Chip Makers
Further Reading
- 4 Reasons To Buy Broadcom Before This Bear Market Ends
- a deep dive look at AVGO’s investment thesis, growth potential, risk profile, valuation, and total return potential
Investment Thesis Summary
AVGO investor presentation
Good M&A is hard, and great M&A skill is very rare on Wall Street. But Broadcom’s CEO Hock Tan is a mad genius at putting together reasonably priced deals. He almost never fails to deliver on synergistic cost savings, and the result has been absolutely spectacular for investors.
Total Returns Since September 2009
Portfolio Visualizer Premium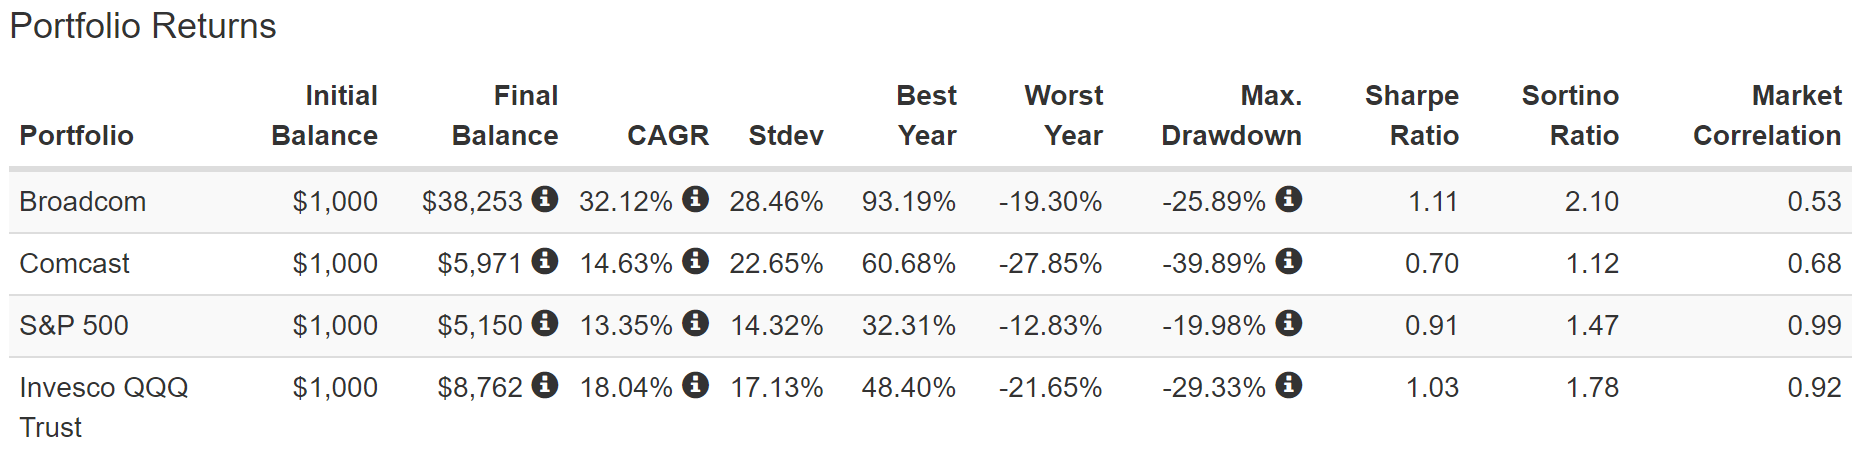
Even with the current bear market, AVGO is up 38X, running circles around the S&P and Nasdaq.
Portfolio Visualizer Premium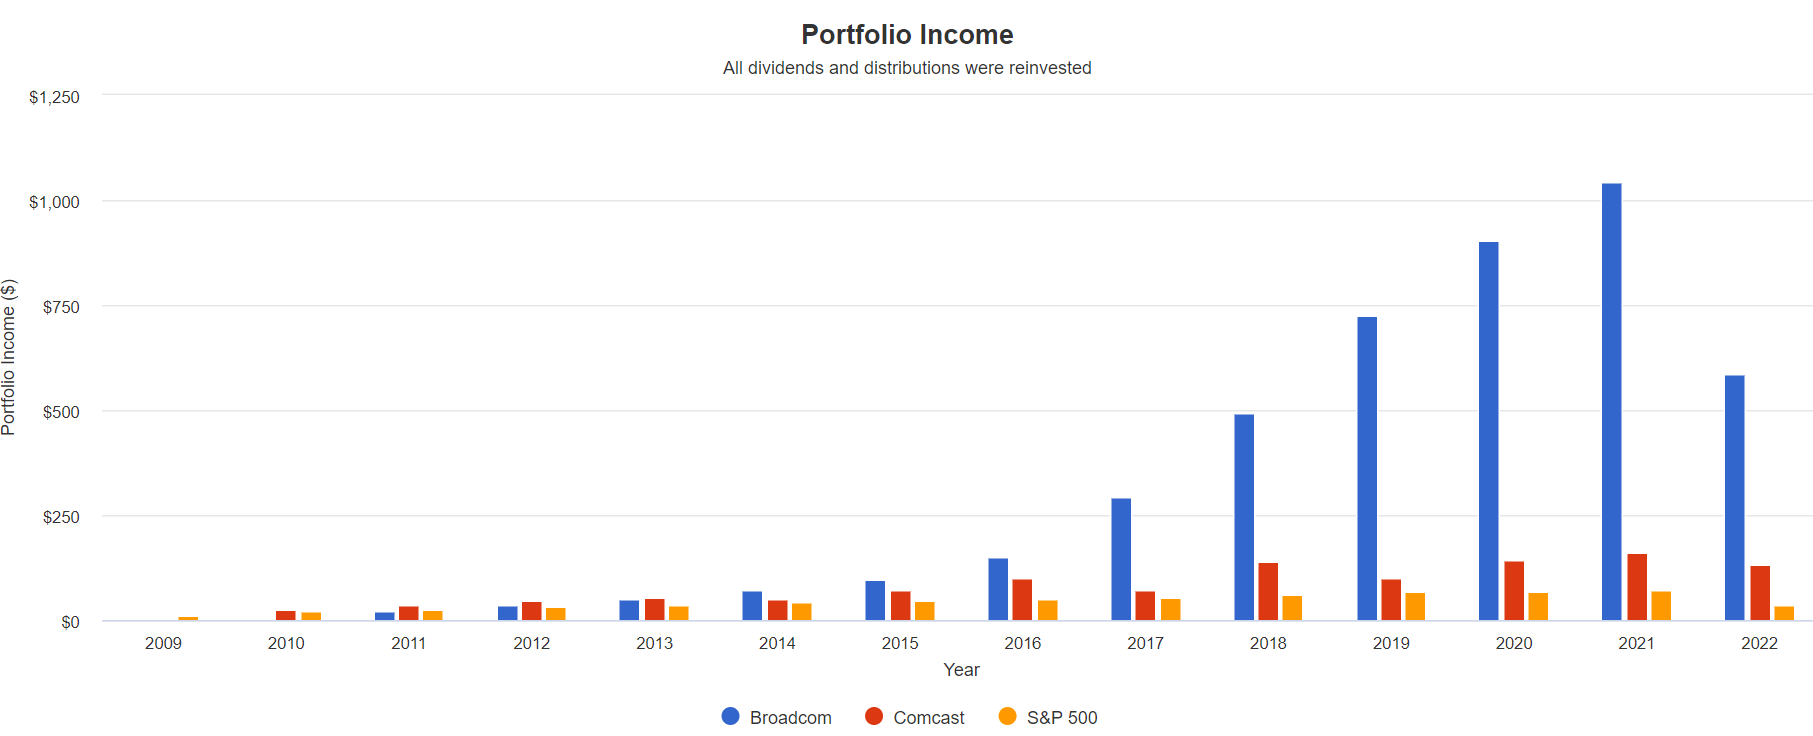
Investors who bought Broadcom in 2009 now enjoy a yield on cost of over 110%. Every year they are getting their original investment back in dividends that continue to grow at double-digits.
And management thinks it can continue buying reasonably priced software companies and achieve 10+% CAGR growth for years to come.
With the acquisition of VMware (VMW), 50% of AVGO’s sales will be from recurring software subscriptions, giving it the steadiest cash flow in the chip industry.
And with steadier cash flow comes higher long-term multiples, which can help drive market and Nasdaq crushing 15+% CAGR returns for the foreseeable future.
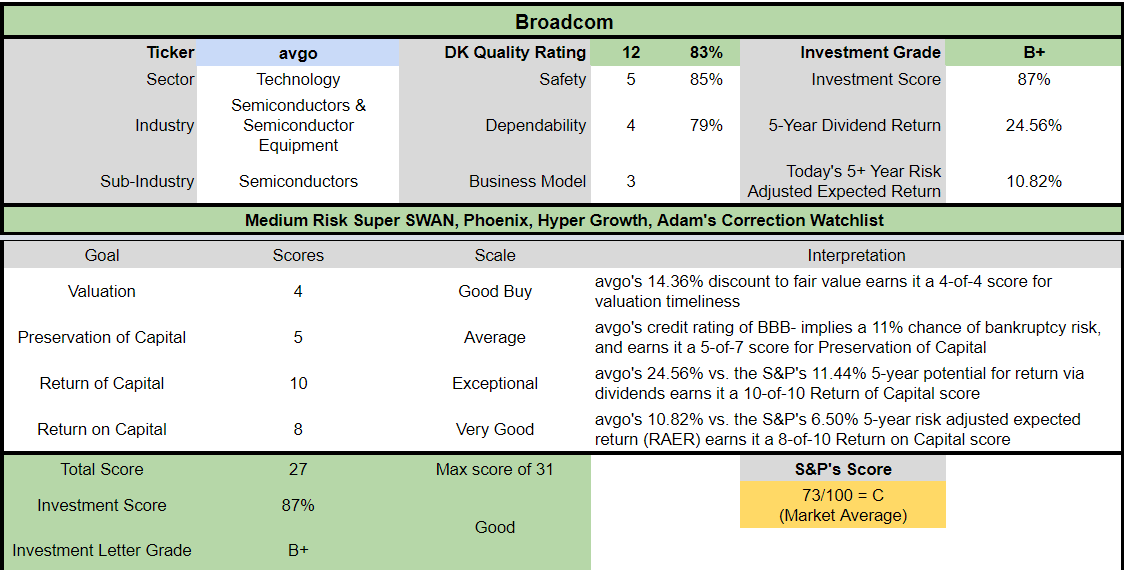
Reasons To Potentially Buy Broadcom Today
| Metric | Broadcom |
| Quality | 83% 12/13 Super SWAN (Sleep Well At Night) Chip Maker |
| Risk Rating | Medium Risk |
| DK Master List Quality Ranking (Out Of 500 Companies) | 188 |
| Quality Percentile | 63% |
| Dividend Growth Streak (Years) | 11 |
| Dividend Yield | 3.2% |
| Dividend Safety Score | 85% very safe |
| Average Recession Dividend Cut Risk | 0.5% |
| Severe Recession Dividend Cut Risk | 1.8% |
| S&P Credit Rating |
BBB- Positive Outlook |
| 30-Year Bankruptcy Risk | 11.0% |
| Consensus LT Risk-Management Industry Percentile |
59% Average, Bordering On Above-Average |
| Fair Value | $596.26 |
| Current Price | $511.58 |
| Discount To Fair Value | 14% |
| DK Rating |
Potentially Good Buy |
| PE | 13.4 |
| Cash-Adjusted PE | 11.5 |
| Growth Priced In | 6.0% |
| Historical PE Range | 21 to 22 |
| LT Growth Consensus/Management Guidance | 15.2% |
| PEG Ratio | 0.76 |
| 5-year consensus total return potential |
12% to 23% CAGR |
| Base Case 5-year consensus return potential |
15% CAGR (2X better than the S&P 500) |
| Consensus 12-month total return forecast | 32% |
| Fundamentally Justified 12-Month Return Potential | 20% |
| LT Consensus Total Return Potential | 18.4% |
| Inflation-Adjusted Consensus LT Return Potential | 16.2% |
| Consensus 10-Year Inflation-Adjusted Total Return Potential (Ignoring Valuation) | 4.48 |
| LT Risk-Adjusted Expected Return | 11.46% |
| LT Risk-And Inflation-Adjusted Return Potential | 9.24% |
| Conservative Years To Double | 7.79 |
(Source: Dividend Kings Zen Research Terminal)
Broadcom 2024 Consensus Total Return Potential
(Source: FAST Graphs, FactSet Research)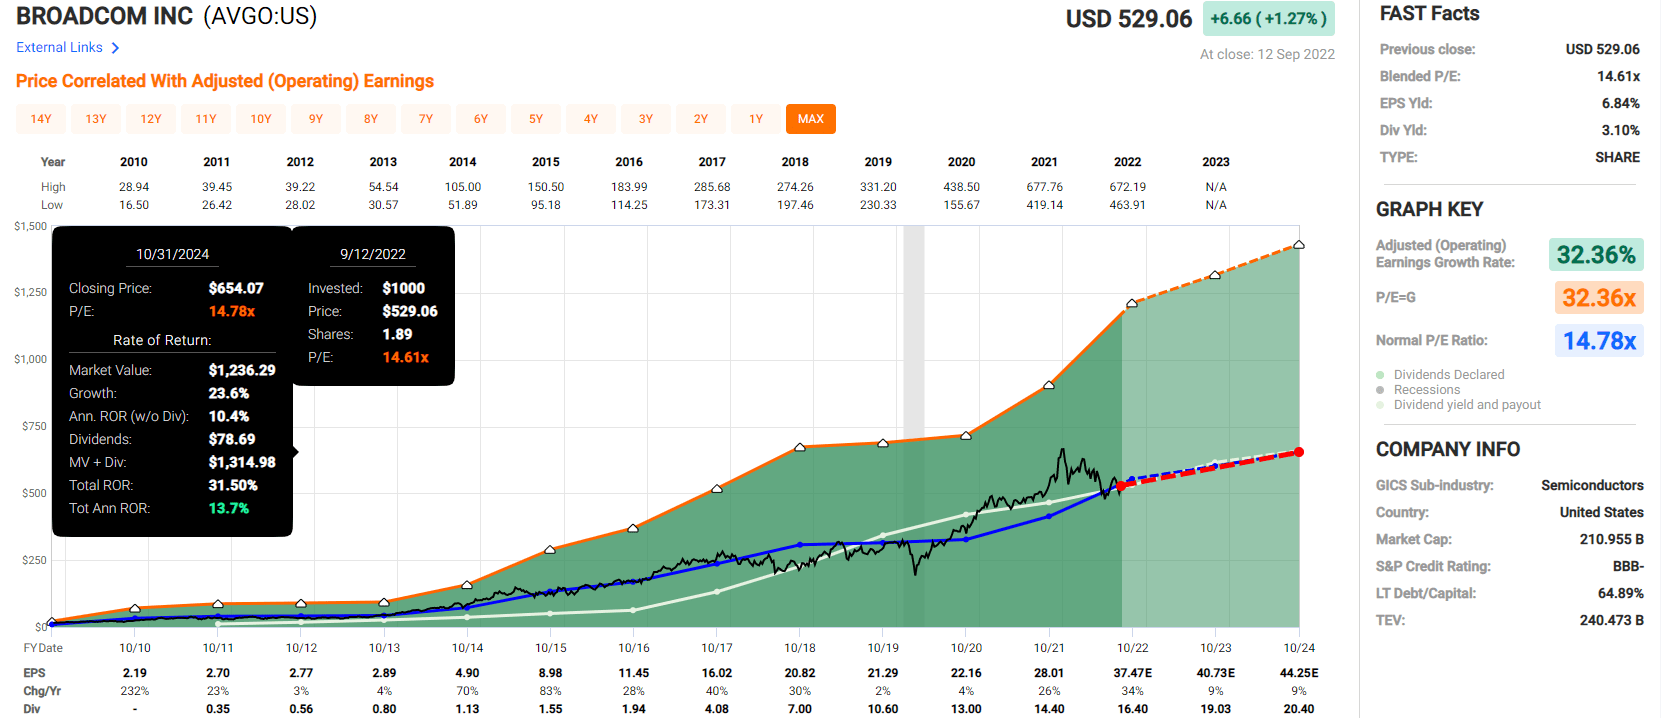
Broadcom 2027 Consensus Total Return Potential
(Source: FAST Graphs, FactSet Research)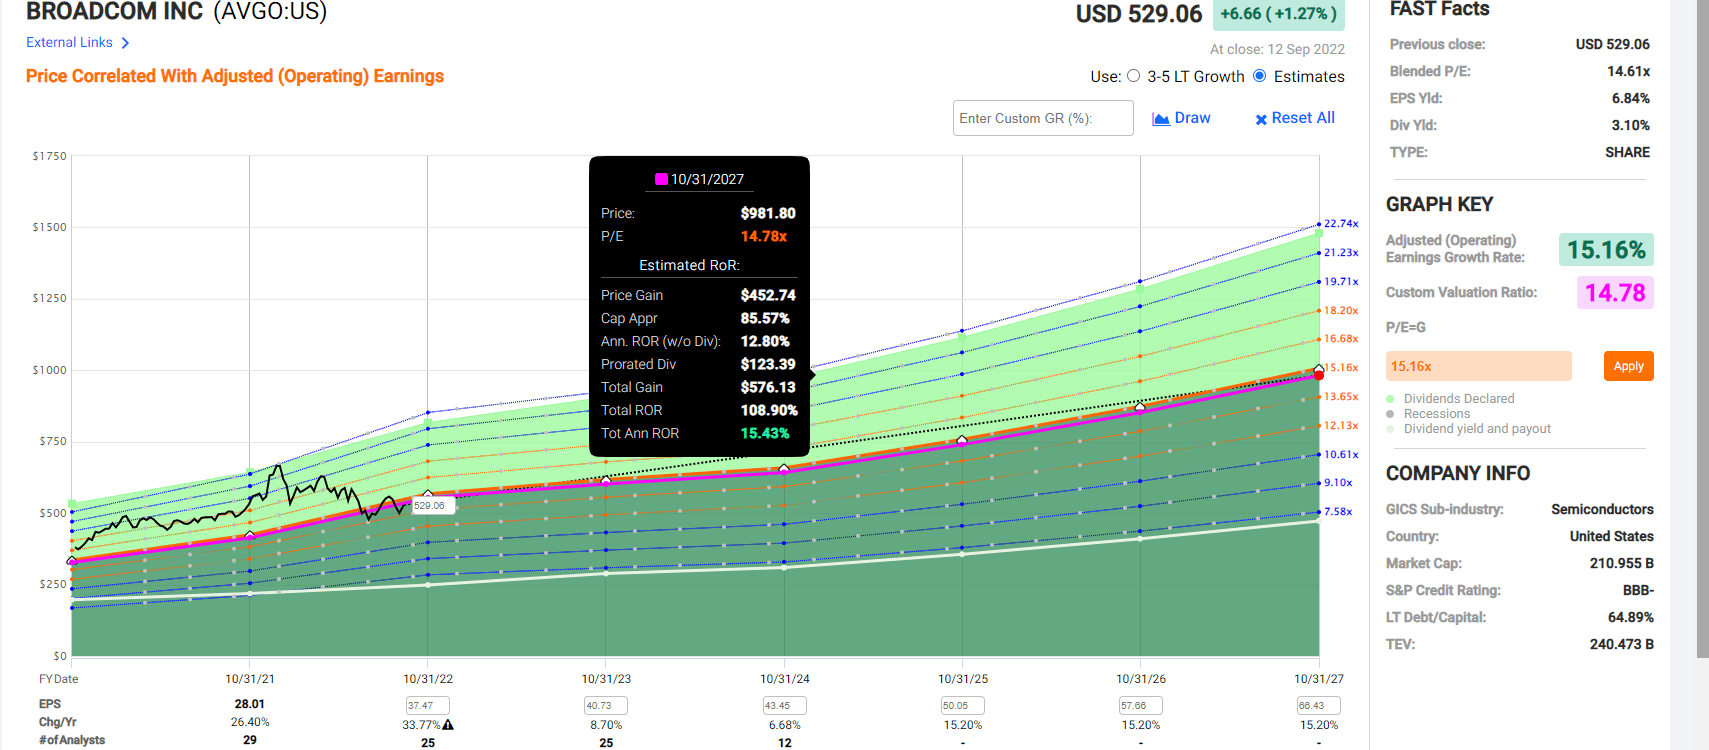
If AVGO grows as expected and returns to historical fair value then it could more than double in the next five years, delivering almost 16% annual returns.
Now compare that to the S&P 500.
S&P 500 2024 Consensus Total Return Potential
(Source: FAST Graphs, FactSet)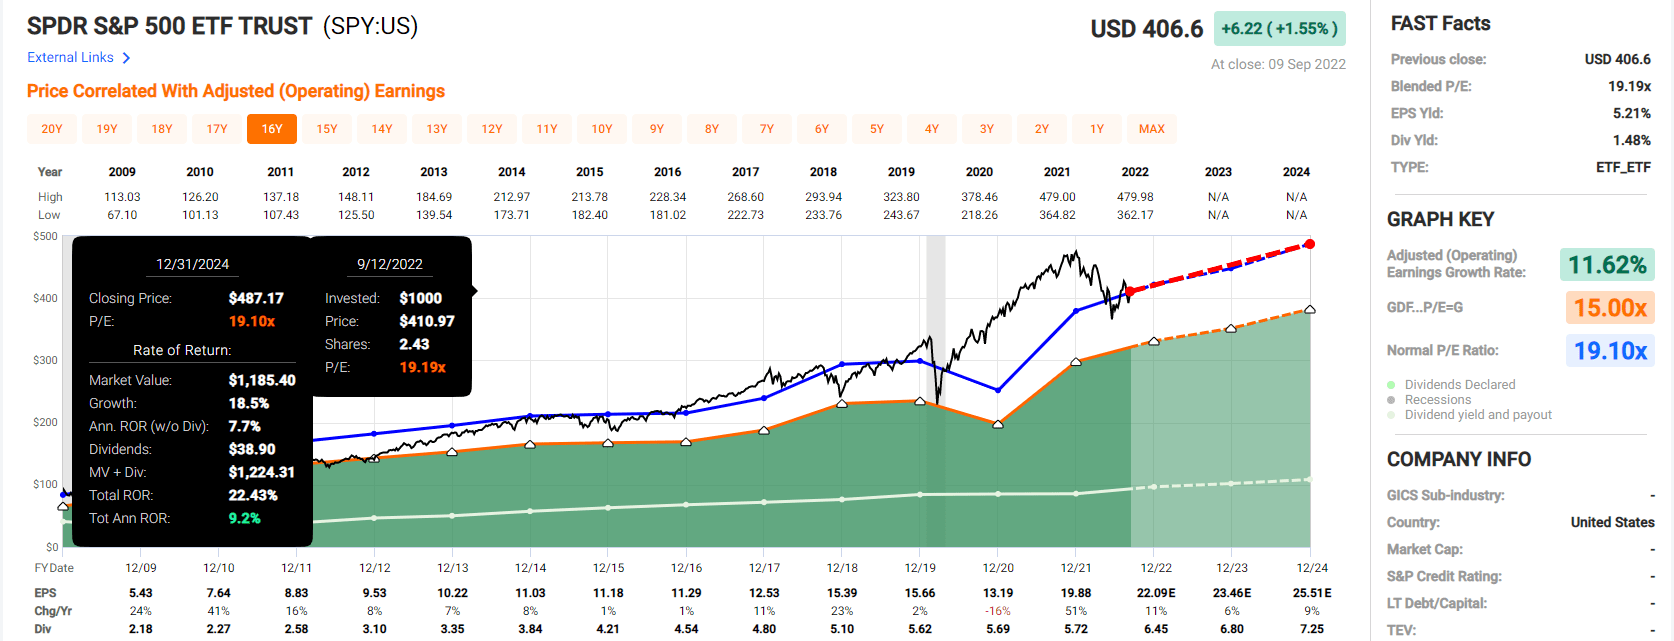
Over the next 2.5 years, analysts think FRT could 2.5X the market’s returns.
S&P 500 2027 Consensus Total Return Potential
| Year | Upside Potential By End of That Year | Consensus CAGR Return Potential By End of That Year | Probability-Weighted Return (Annualized) |
Inflation And Risk-Adjusted Expected Returns |
| 2027 | 48.76% | 8.27% | 6.20% | 3.80% |
(Source: DK S&P 500 Valuation & Total Return Tool)
Over the next five years, analysts expect 8% annual returns from the S&P 500, about 2.0X less than they expect from AVGO.
And over the long-term? Just take a look.
| Investment Strategy | Yield | LT Consensus Growth | LT Consensus Total Return Potential | Long-Term Risk-Adjusted Expected Return | Long-Term Inflation And Risk-Adjusted Expected Returns | Years To Double Your Inflation & Risk-Adjusted Wealth |
10-Year Inflation And Risk-Adjusted Expected Return |
| Broadcom | 3.2% | 15.2% | 18.4% | 12.9% | 10.6% | 6.8 | 2.74 |
| High-Yield (SCHD) | 3.4% | 8.7% | 12.1% | 8.5% | 6.2% | 11.7 | 1.82 |
| Dividend Aristocrats | 2.4% | 8.6% | 11.0% | 7.7% | 5.4% | 13.4 | 1.69 |
| S&P 500 | 1.7% | 8.5% | 10.2% | 7.1% | 4.9% | 14.8 | 1.61 |
| Nasdaq | 0.9% | 11.8% | 12.7% | 8.9% | 6.6% | 10.9 | 1.89 |
(Source: DK Research Terminal, FactSet, Morningstar, YCharts)
Analysts think AVGO can deliver hyper-growth long-term, resulting in Buffett-like 18% annual returns.
That’s not just better than the dividend aristocrats and S&P 500; it’s better than SCHD and even more than the Nasdaq.
Inflation-Adjusted Consensus Return Potential: $1,000 Initial Investment
| Time Frame (Years) | 7.9% CAGR Inflation-Adjusted S&P 500 Consensus | 8.7% Inflation-Adjusted Dividend Aristocrats Consensus | 16.1% CAGR Inflation-Adjusted AVGO Consensus | Difference Between Inflation-Adjusted AVGO Consensus And S&P Consensus |
| 5 | $1,461.18 | $1,516.17 | $2,110.32 | $649.14 |
| 10 | $2,135.06 | $2,298.77 | $4,453.45 | $2,318.39 |
| 15 | $3,119.71 | $3,485.33 | $9,398.19 | $6,278.48 |
| 20 | $4,558.47 | $5,284.36 | $19,833.19 | $15,274.72 |
| 25 | $6,660.75 | $8,012.00 | $41,854.35 | $35,193.60 |
| 30 | $9,732.58 | $12,147.56 | $88,326.04 | $78,593.45 |
(Source: DK Research Terminal, FactSet)
Even if AVGO only grows as expected for a few years, it could deliver incredible income and wealth compounding. And if it can grow as expected for longer than 15 years? Then it’s an inflation-adjusted 10-bagger… or better.
| Time Frame (Years) | Ratio Dividend Aristocrats/S&P Consensus | Ratio Inflation And Inflation-Adjusted AVGO Consensus vs. S&P consensus |
| 5 | 1.04 | 1.44 |
| 10 | 1.08 | 2.09 |
| 15 | 1.12 | 3.01 |
| 20 | 1.16 | 4.35 |
| 25 | 1.20 | 6.28 |
| 30 | 1.25 | 9.08 |
(Source: DK Research Terminal, FactSet)
AVGO Investment Decision Score
DK Dividend Kings Automated Investment Decision Tool
AVGO is a very reasonable high-yield hyper-growth tech option for anyone comfortable with its risk profile.
- 14% discount vs. 3% market premium = 17% better valuation
- 3.2% yield vs. 1.6% yield (2X the yield and a much safer yield at that)
- 80% higher long-term consensus annual return potential
- Almost 2X better risk-adjusted expected return over the next five years
- 2.5X more income over the next five years
Comcast: A Table Pounding Dividend Blue-Chip Buy
Further Reading
Investment Thesis Summary
There are two things to know about Comcast. First, its core subscriber base is shrinking, just like tobacco companies.
FactSet Research Terminal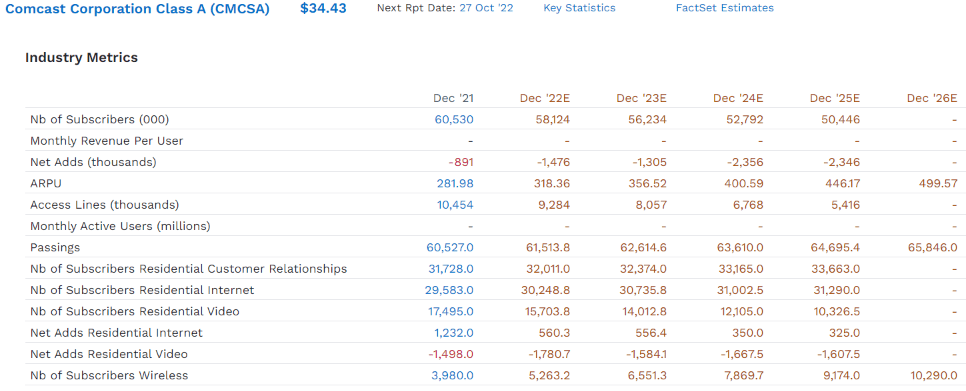
Between 2021 and 2025, analysts expect Comcast to lose 10 million subscribers to cord-cutting.
Like Tobacco companies, CMCSA is diversifying into new businesses, including wireless internet.
And like tobacco companies, CMCSA’s plan is to maximize revenue per subscriber, which analysts expect to rise from $282 per year to $500 by 2026.
And just like tobacco companies, a lot of people hate Comcast (including many of its customers). And like tobacco companies, Comcast is dirt cheap right now.
FAST Graphs, FactSet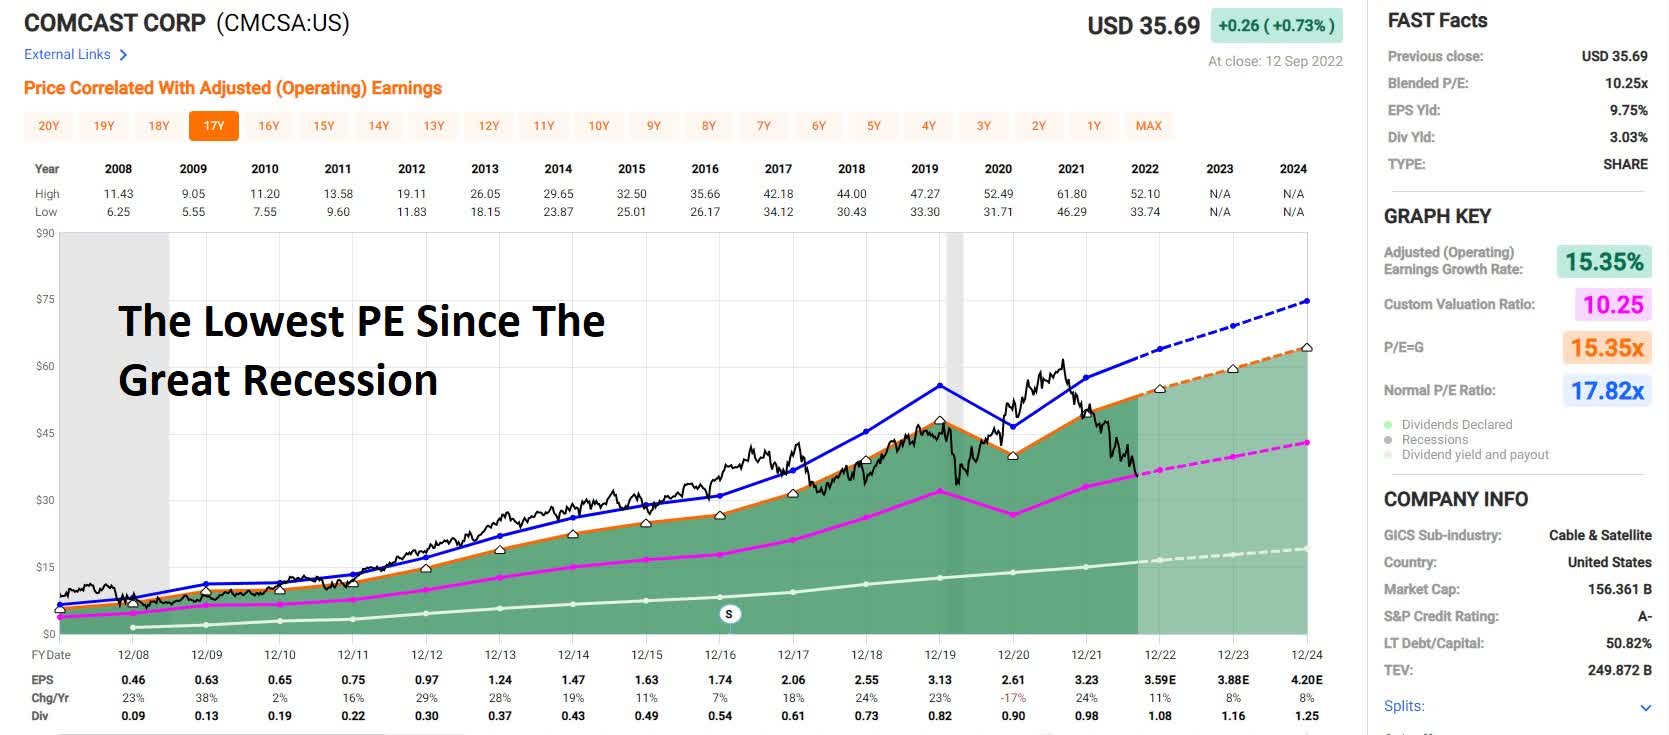
Comcast is now trading at literally Great Recession low valuations.
And do you know what management’s plan is to deal with this outrageously low valuation?
Like tobacco companies, it plans to buy back a lot of stock.
Comcast Stock Buyback Consensus Forecast
| Year | Consensus Buybacks ($ Millions) | % Of Shares (At Current Valuations) | Market Cap |
| 2022 | $12,252 | 8.1% | $151,898 |
| 2023 | $12,075 | 7.9% | $151,898 |
| 2024 | $13,688 | 9.0% | $151,898 |
| 2025 | $13,731 | 9.0% | $151,898 |
| 2026 | $15,481 | 10.2% | $151,898 |
| 2027 | $16,000 | 10.5% | $151,898 |
| Total 2022 through 2027 | $83,227 | 54.8% | $151,898 |
| Annualized Rate | 12.5% | Average Annual Buybacks | $13,871 |
| 1% Buyback Tax | $832 | Average Annual Buyback Tax | $139 |
(Source: FactSet Research Terminal)
Analysts expect CMCSA to buy back $83 billion in stock in the next 5.5 years, an annual rate of $14 billion per year.
Combine that with literally the Great Recession valuation, and this is a deep-value blue-chip that could cut its share count in half within a few years.
Think Comcast’s plan to raise prices, cut costs, and buy back stock can’t work? Well, it’s worked pretty well for big tobacco for the last 34 years.
Rolling Returns Since August 1988
Portfolio Visualizer Premium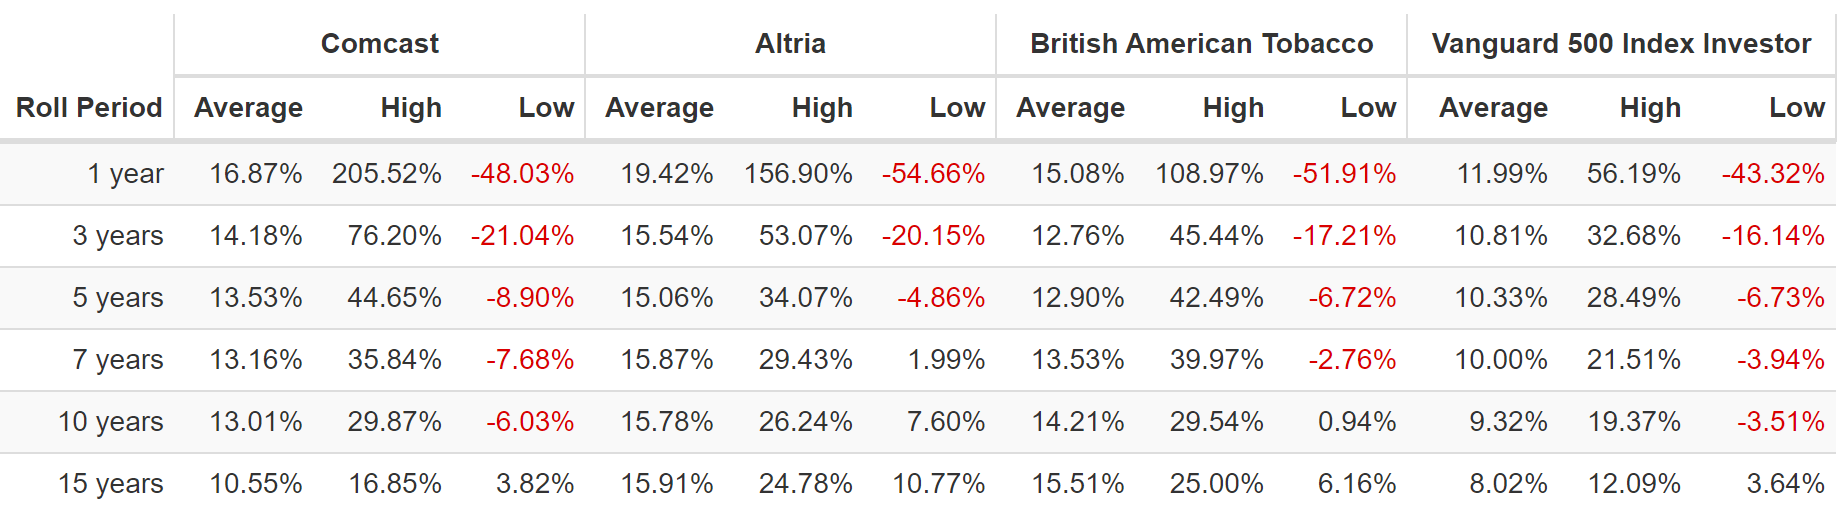
Comcast has averaged 17% annual returns for the last 34 years, similar to MO and BTI, all of which have crushed the S&P 500 despite being some of the most hated companies on earth.
- my only love for these blue-chips is their incredible dividends and long-term returns
- companies don’t have to be popular or loved to help you retire in safety and splendor
Reason To Potentially Buy Comcast
| Metric | Comcast |
| Quality | 86% 12/13 Super SWAN (Sleep Well At Night) Telecom |
| Risk Rating | Low Risk |
| DK Master List Quality Ranking (Out Of 500 Companies) | 138 |
| Quality Percentile | 73% |
| Dividend Growth Streak (Years) | 14 |
| Dividend Yield | 3.1% |
| Dividend Safety Score | 93% very safe |
| Average Recession Dividend Cut Risk | 0.5% |
| Severe Recession Dividend Cut Risk | 1.35% |
| S&P Credit Rating |
A- Positive Outlook |
| 30-Year Bankruptcy Risk | 2.5% |
| Consensus LT Risk-Management Industry Percentile |
60% Average, Above-Average |
| Fair Value | $63.47 |
| Current Price | $34.34 |
| Discount To Fair Value | 46% |
| DK Rating |
Potentially Ultra Value Buy |
| PE | 9.6 |
| Cash-Adjusted PE | 6.7 Anti-Bubble Blue-Chip |
| Growth Priced In | -3.6% |
| Historical PE Range | 17.5 to 18 |
| LT Growth Consensus/Management Guidance | 12.5% |
| PEG Ratio | 0.54 (Growth At A Wonderful Price) |
| 5-year consensus total return potential |
25% to 27% CAGR |
| Base Case 5-year consensus return potential |
26% CAGR (5X better than the S&P 500) |
| Consensus 12-month total return forecast | 43% |
| Fundamentally Justified 12-Month Return Potential | 88% |
| LT Consensus Total Return Potential | 15.6% |
| Inflation-Adjusted Consensus LT Return Potential | 13.4% |
| Consensus 10-Year Inflation-Adjusted Total Return Potential (Ignoring Valuation) | 3.51 |
| LT Risk-Adjusted Expected Return | 10.65% |
| LT Risk-And Inflation-Adjusted Return Potential | 8.43% |
| Conservative Years To Double | 8.54 |
(Source: Dividend Kings Zen Research Terminal)
Comcast is trading at just 6.6X cash-adjusted earnings, pricing in -3.6% growth, but it’s actually growing at 12.5% CAGR.
What could that mean for short-term profits? Analysts expect a 43% total return from Comcast in the next year. It’s so undervalued, 45% historical discount, that it could soar by 88% and merely return to fair value.
Comcast 2024 Consensus Total Return Potential
(Source: FAST Graphs, FactSet Research)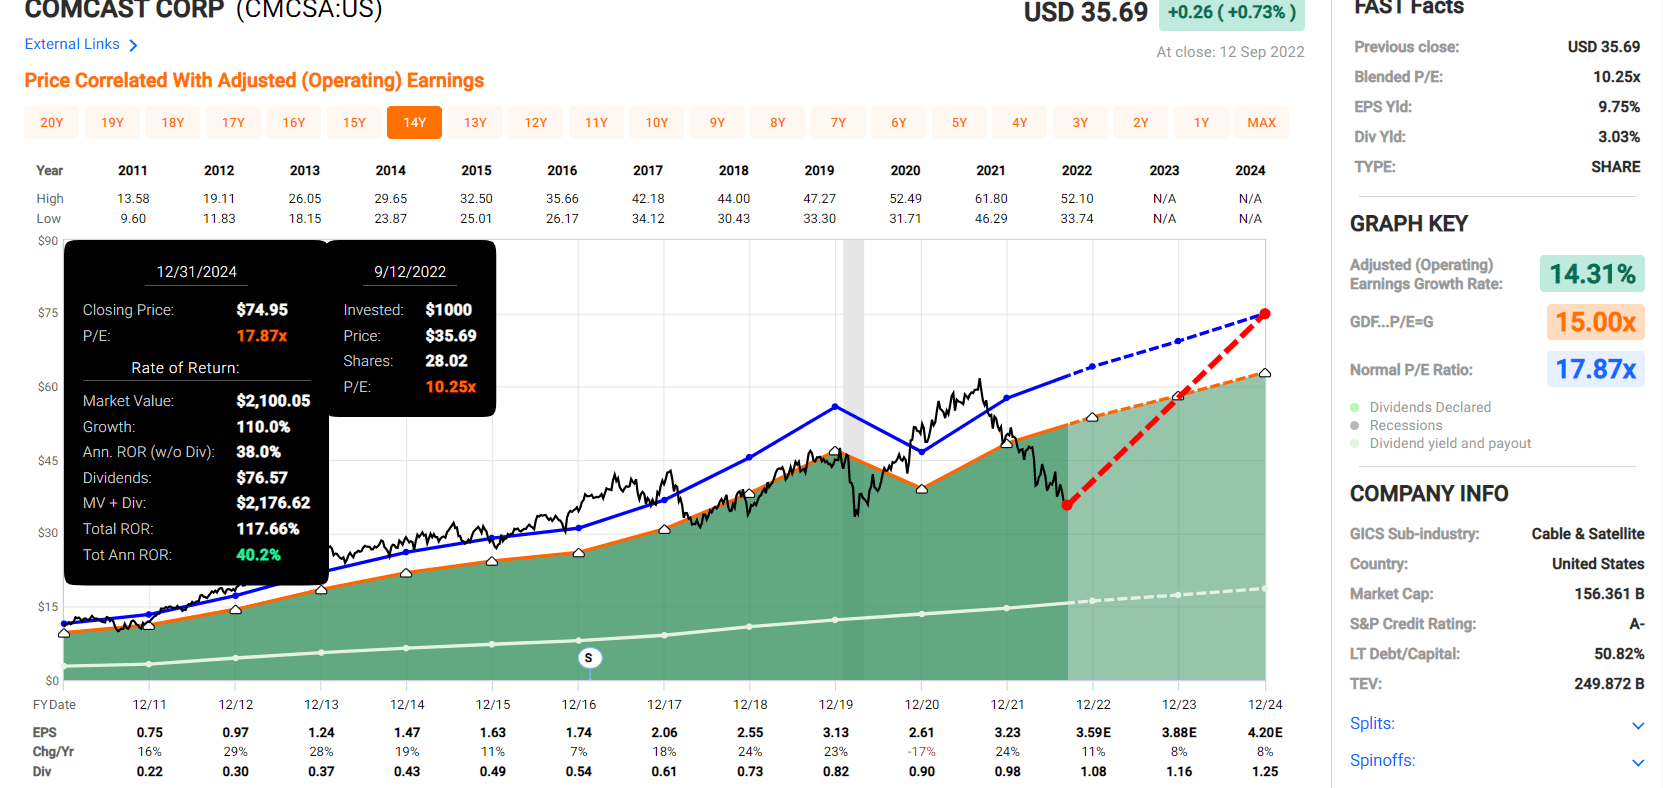
CMCSA, at Great Recession low valuations, can potentially deliver 118% total returns in less than three years, 40% CAGR total returns that would put even Warren Buffett to shame.
Comcast 2027 Consensus Total Return Potential
(Source: FAST Graphs, FactSet Research)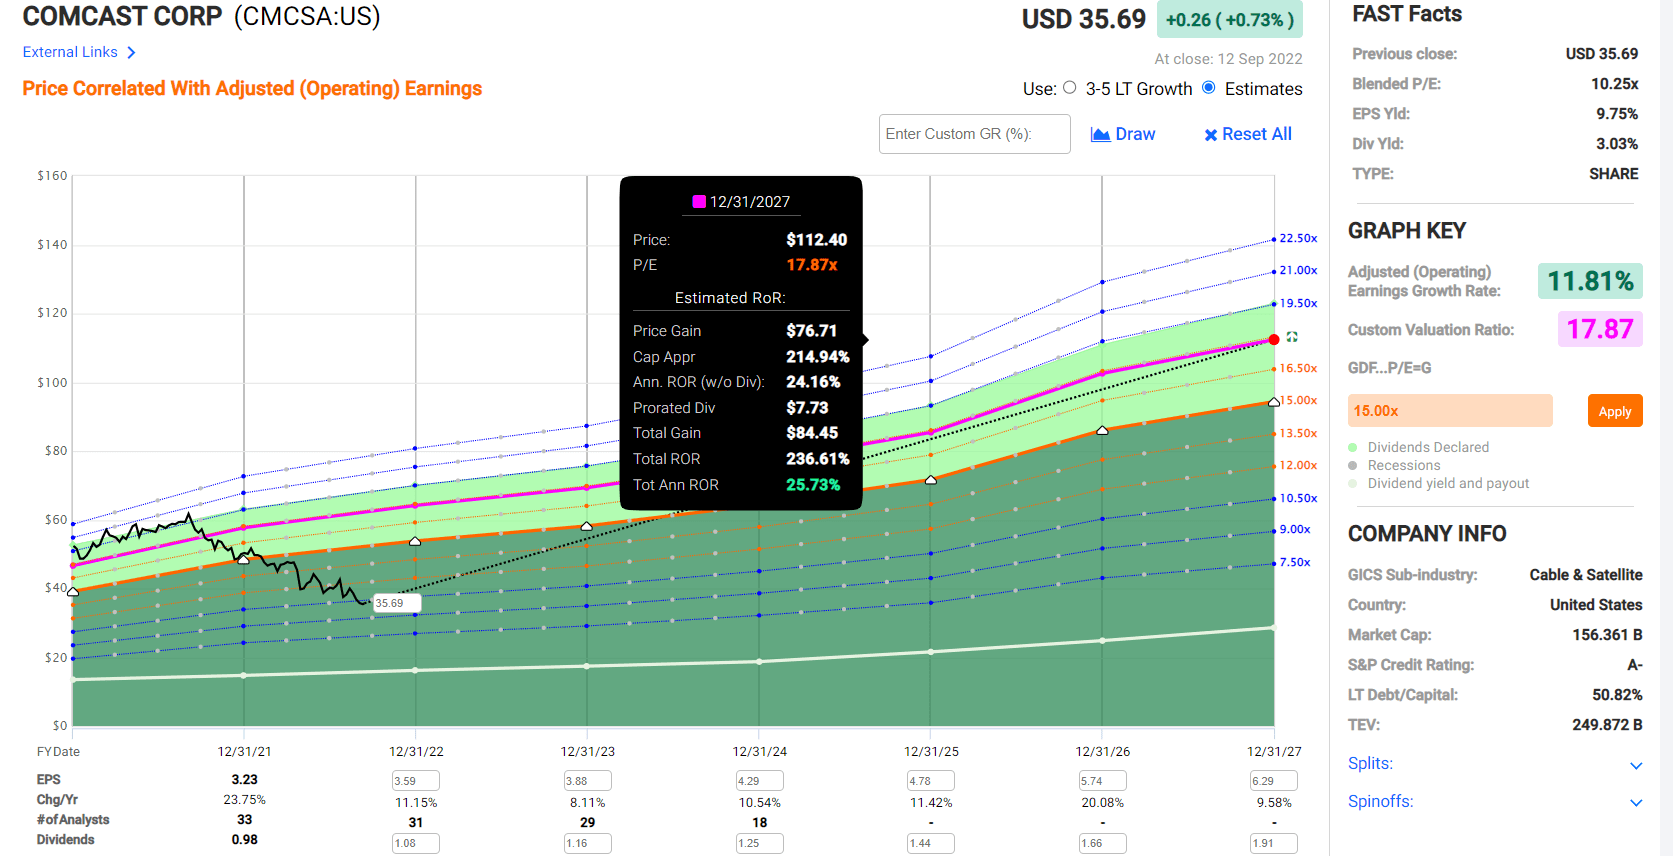
If Comcast grows as analysts expect over the next five years, a modest 12% CAGR, it could deliver Buffett-like 26% annual returns, or nearly 5X more than the S&P 500.
| Investment Strategy | Yield | LT Consensus Growth | LT Consensus Total Return Potential | Long-Term Risk-Adjusted Expected Return | Long-Term Inflation And Risk-Adjusted Expected Returns | Years To Double Your Inflation & Risk-Adjusted Wealth |
10-Year Inflation And Risk-Adjusted Expected Return |
| Comcast | 3.1% | 12.5% | 15.6% | 10.9% | 8.6% | 8.3 | 2.29 |
| High-Yield (SCHD) | 3.4% | 8.7% | 12.1% | 8.5% | 6.2% | 11.7 | 1.82 |
| Dividend Aristocrats | 2.4% | 8.6% | 11.0% | 7.7% | 5.4% | 13.4 | 1.69 |
| S&P 500 | 1.7% | 8.5% | 10.2% | 7.1% | 4.9% | 14.8 | 1.61 |
| Nasdaq | 0.9% | 11.8% | 12.7% | 8.9% | 6.6% | 10.9 | 1.89 |
(Source: DK Research Terminal, Morningstar, FactSet, YCharts)
For decades Comcast has been hated by many of its customers. And for decades, it’s beaten the Nasdaq, S&P 500, and dividend aristocrats.
Guess what? Under management’s current plan, analysts expect it to keep making long-term dividend growth investors rich.
What if Comcast never returns to historical fair value? It doesn’t have to. Any company growing at 12.5% with a 3.1% yield will deliver 15.6% CAGR returns as long as its PE remains stable.
- Comcast can trade at 6.6X cash-adjusted earnings forever and still make investors fabulously rich
Inflation-Adjusted Consensus Return Potential: $1,000 Initial Investment
| Time Frame (Years) | 7.9% CAGR Inflation-Adjusted S&P 500 Consensus | 8.7% Inflation-Adjusted Dividend Aristocrats Consensus | 13.1% CAGR Inflation-Adjusted CMCSA Consensus | Difference Between Inflation-Adjusted CMCSA Consensus And S&P Consensus |
| 5 | $1,461.18 | $1,516.17 | $1,851.42 | $390.24 |
| 10 | $2,135.06 | $2,298.77 | $3,427.76 | $1,292.70 |
| 15 | $3,119.71 | $3,485.33 | $6,346.22 | $3,226.51 |
| 20 | $4,558.47 | $5,284.36 | $11,749.52 | $7,191.05 |
| 25 | $6,660.75 | $8,012.00 | $21,753.30 | $15,092.54 |
| 30 | $9,732.58 | $12,147.56 | $40,274.49 | $30,541.91 |
(Source: DK Research Terminal, FactSet)
Remember that this assumes zero multiple expansion, just Comcast trading at Great Recession low valuations forever and growing as expected.
| Time Frame (Years) | Ratio Dividend Aristocrats/S&P Consensus | Ratio Inflation And Inflation-Adjusted CMCSA Consensus vs. S&P consensus |
| 5 | 1.04 | 1.27 |
| 10 | 1.08 | 1.61 |
| 15 | 1.12 | 2.03 |
| 20 | 1.16 | 2.58 |
| 25 | 1.20 | 3.27 |
| 30 | 1.25 | 4.14 |
(Source: DK Research Terminal, FactSet)
How does potentially quadrupling the market over 30 years sound? How about doing so with the margin of safety of an A-rated anti-bubble blue-chip? And how about doing all that while drowning in very safe dividends that grow every year.
Portfolio Visualizer Premium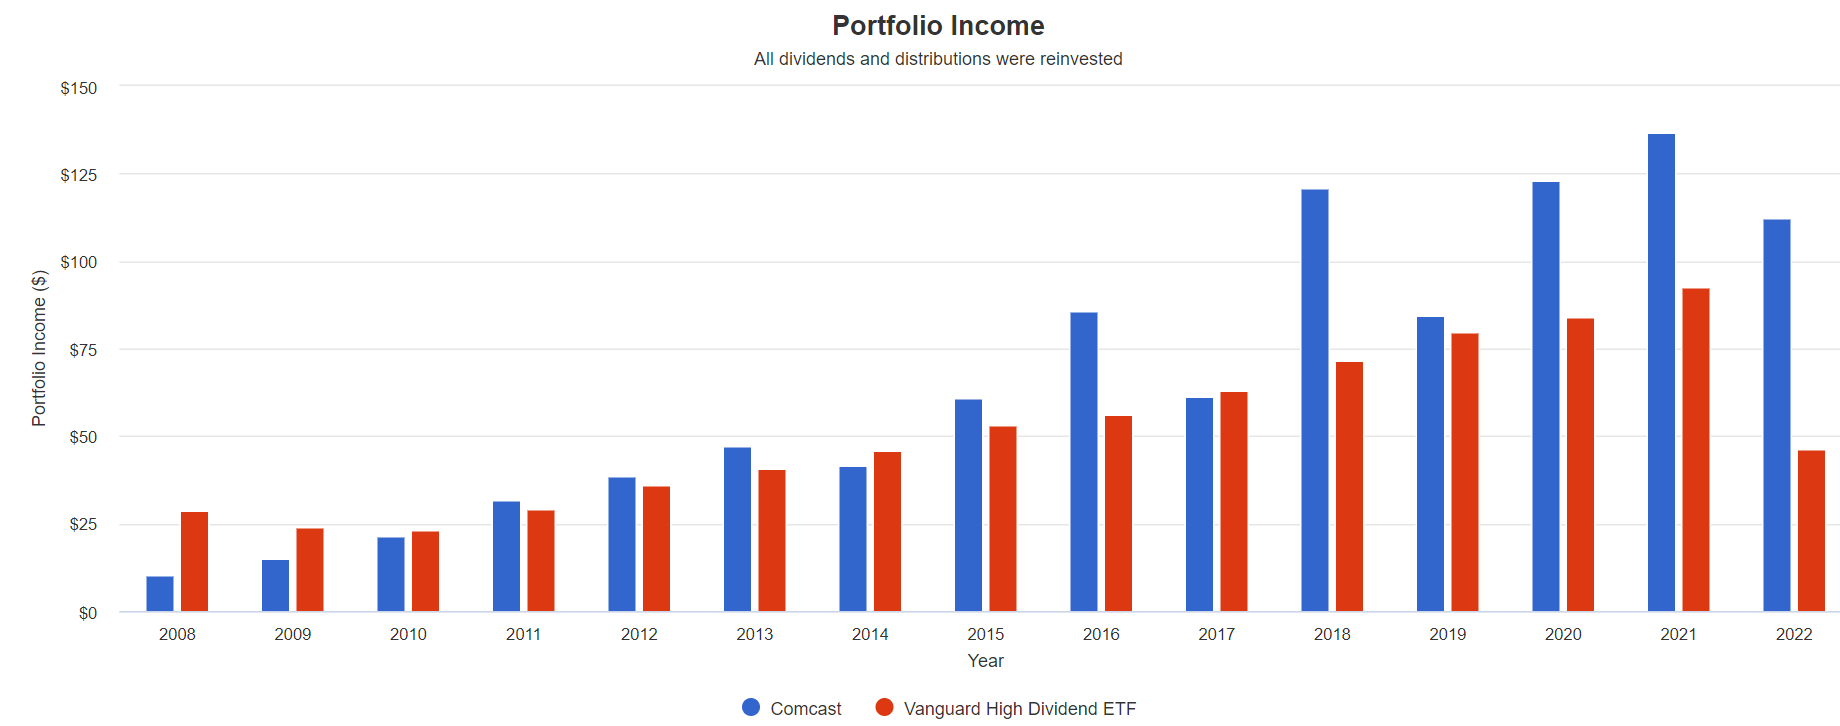
Anyone who bought Comcast in 2008 when it yielded just 1% now has a 22.4% yield on cost and has enjoyed 25% annual income growth for the last 14 years.
- 15% or so annual income growth is what analysts expect in the future
Comcast Investment Decision Score
DK (Source: Dividend Kings Automated Investment Decision Tool)
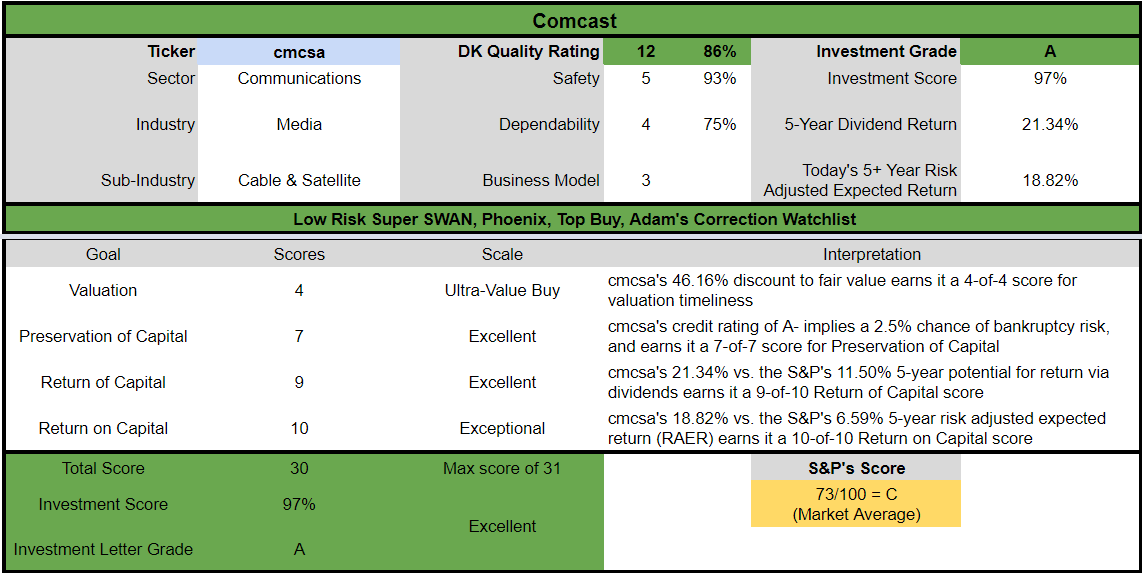
CMCSA is an excellent high-yield fast-growth Ultra Value option for anyone comfortable with its risk profile.
- 46% discount vs. 3% market premium = 49% better valuation
- 3.1% yield vs. 1.6% yield (2.6X the yield and a much safer yield at that)
- 50% higher long-term annual consensus return potential
- 3X better risk-adjusted expected return over the next five years
- 2X more income over the next five years
Bottom Line: Broadcom and Comcast Are 2 Super Powered High-Yield Blue-Chip Bargains You Don’t Want To Miss
I know that now might seem like a scary time to be recommending any blue-chips. This bear market has many investors despairing, and that’s understandable.
This Too Shall Pass
Charlie Bilello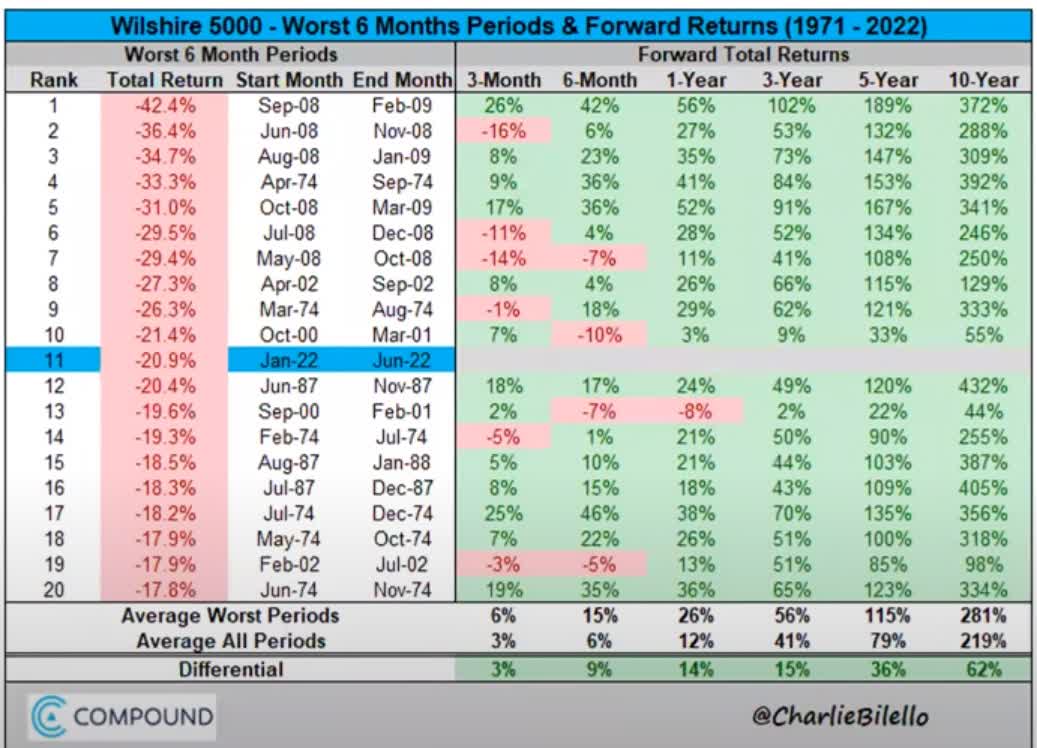
Stocks will recover gloriously from this bear market, and when they do, companies like Broadcom and Comcast are likely to lead the way to new record highs.
These are dividend growth super stocks, right in the 2nd quintile sweet spot that maximizes returns and income growth for patient long-term investors.
I can’t tell you when either of them will bottom.
- over 30+ years, 97% of stock returns are a function of pure fundamentals, not luck
- in the short term; luck is 33X as powerful as fundamentals
- in the long term, fundamentals are 33X as powerful as luck
What I can tell you about AVGO and CMCSA is that they have impeccable fundamentals, very safe dividends, and double-digit growth potential for as far as the eye can see.
Buying blue-chip bargains like these in a bear market is the easiest way to not just earn exceptional returns in the medium-term, but also take charge of your financial destiny.
Because when you buy super-powered dividend blue-chip bargains like these and own them for the long-term within a diversified and prudently risk-managed portfolio, you never have to pray for luck; you’ll make your own.
Be the first to comment