

LIgorko/iStock via Getty Images
Who likes cheese?
I’m not talking about cheese pizza, cheeseburgers, or cheesecake, although I love all three.
I’m talking about money.
It’s a well-known fact that many Americans use the “cheese” term when referring to money. According to Business Insider, the cheese term originated at the end of World War II.
“Welfare packages included a hearty lump of cheese – so to receive your cheese meant to receive your benefits.”
So, in my article I’m referring to money, and to continue along with the cheese theme, let me explain the concept of the value trap. According to Investopedia (emphasis added):
“A value trap is a stock or other investment that appears to be cheaply priced because it has been trading at low valuation metrics, such as multiples in terms of price to earnings (P/E), price to cash flow (P/CF), or price to book value (P/B) for an extended time period.
A value trap can attract investors who are looking for a bargain because they seem inexpensive relative to historical valuation multiples of the stock or relative to those of industry peers or the prevailing market multiple.
The danger of a value trap presents itself when the stock continues to languish or drop further after an investor buys into the company.”
Now, let me be clear, my team and I work hard to avoid investing in value traps, yet as hard as we work, we have not been perfect with our picks. As Investopedia points out:
“Identifying value traps can be tricky, but a careful fundamental analysis of the stock can reveal what is a trap and what is a good investment opportunity.”
Oftentimes the demise of a company can be traced to a long-lasting change in the cash-generating power of the business model.
In the real estate investment trust (“REIT”) sector, that’s one of the reasons we look at the historical earning history of the company, using Funds from Operations (“FFO”).
When the earnings stream is in a consistent state of decline, we can determine whether or not the business is sustainable.
Another way we can define a value trap is based on the dividend yield.
Many of you are familiar with the term “sucker yield,” which simply means that the high yield is too good to be true.
We always recommend looking at other metrics beside just the yield, and one of the best ways to evaluate the safety of the dividend is to consider the payout ratio.
For REITs, always use Adjusted Funds from Operations (“AFFO”), designed to be a closer proxy for actual normalized cash flows per share:
AFFO = FFO – Straight-Lined Rents – Recurring Capital Expenditure (Capex) + Equity-Based Compensation + Lease Intangibles + Deferred Financing Cost.
Whenever the company is paying out a large percentage of profits in dividends, it may not be able to cover unexpected costs. Nine times out of 10, when a company cuts its dividend, the share price tumbles.
The typical result is that investors looking for an extra 5% in yield end up losing 25% to 50% or more when the stock price collapses.
One of the most important things we look at Wide Moat Research is catalysts, because that is what attracts new investors, that results in price appreciation.
One challenging sector we cover is cannabis.
As most know, the sentiment surrounding the “weed” sector has been negative for all of 2022, and this means that most investors are running from it, regardless of the overall cheapness of the shares.
Some may argue cannabis REITs like Innovative Industrial (IIPR) and NewLake Capital (OTCQX:NLCP) are value traps; however, we take the position that the business model is intact, and that these landlords should continue to generate steady dividend growth.
Yahoo Finance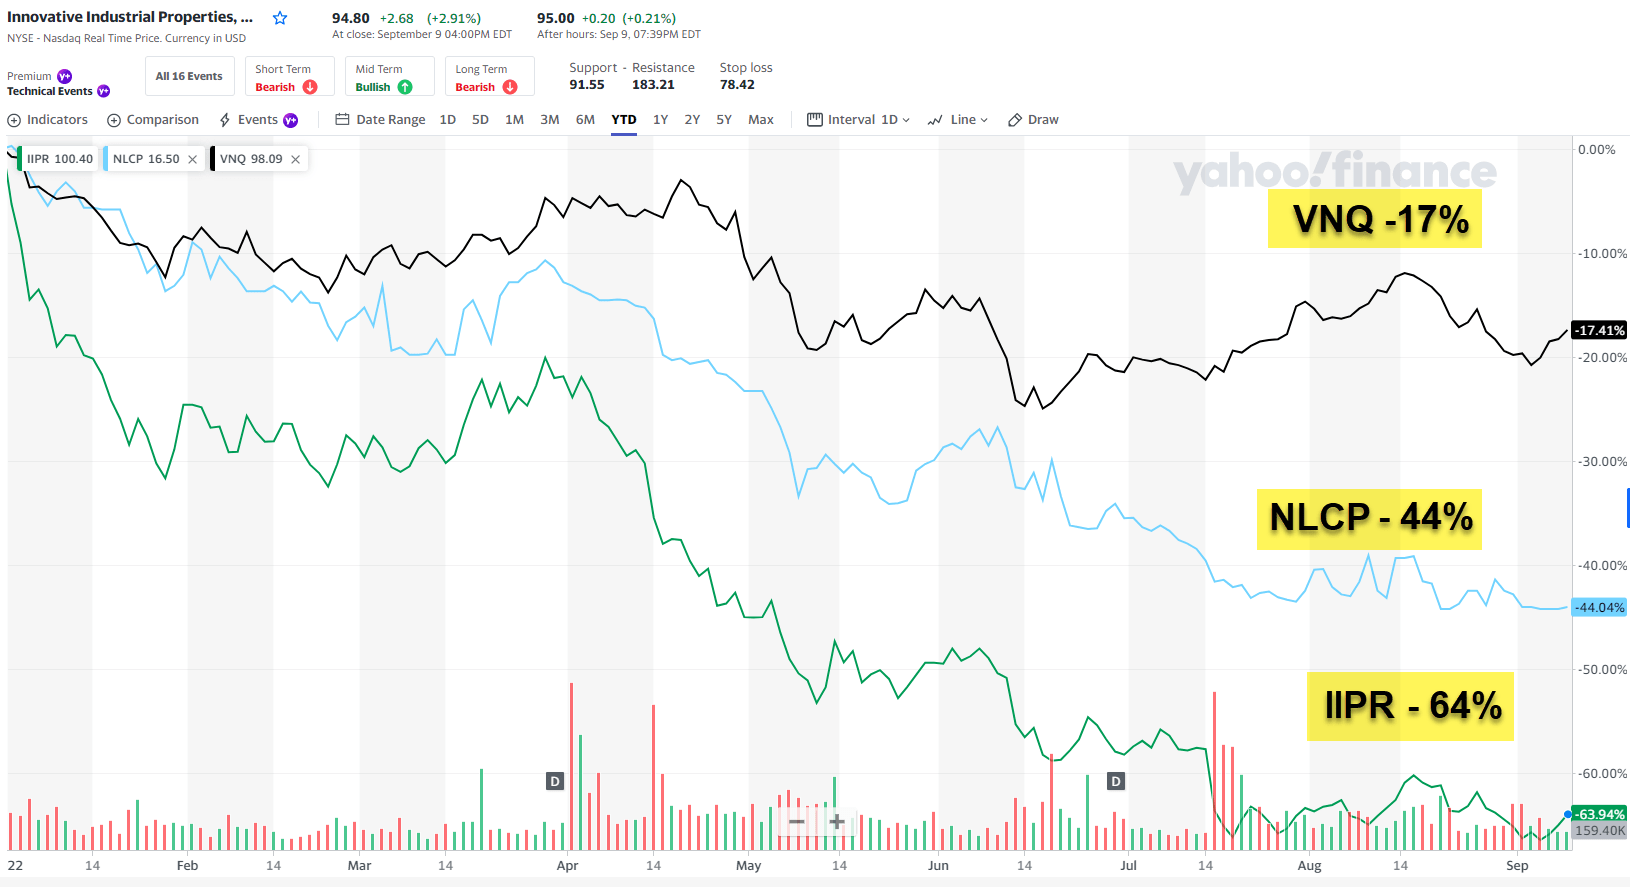
Another challenging sector that has seen a downward spiral is the office sector.
We tend to bifurcate the risk geographically, based on the premise that New York City is a riskier region than sunbelt markets.
Our view is that Mr. Market has placed a wider discount on office REIT shares and that eventually they will rebound to a “new norm” – whatever that means.
Yahoo Finance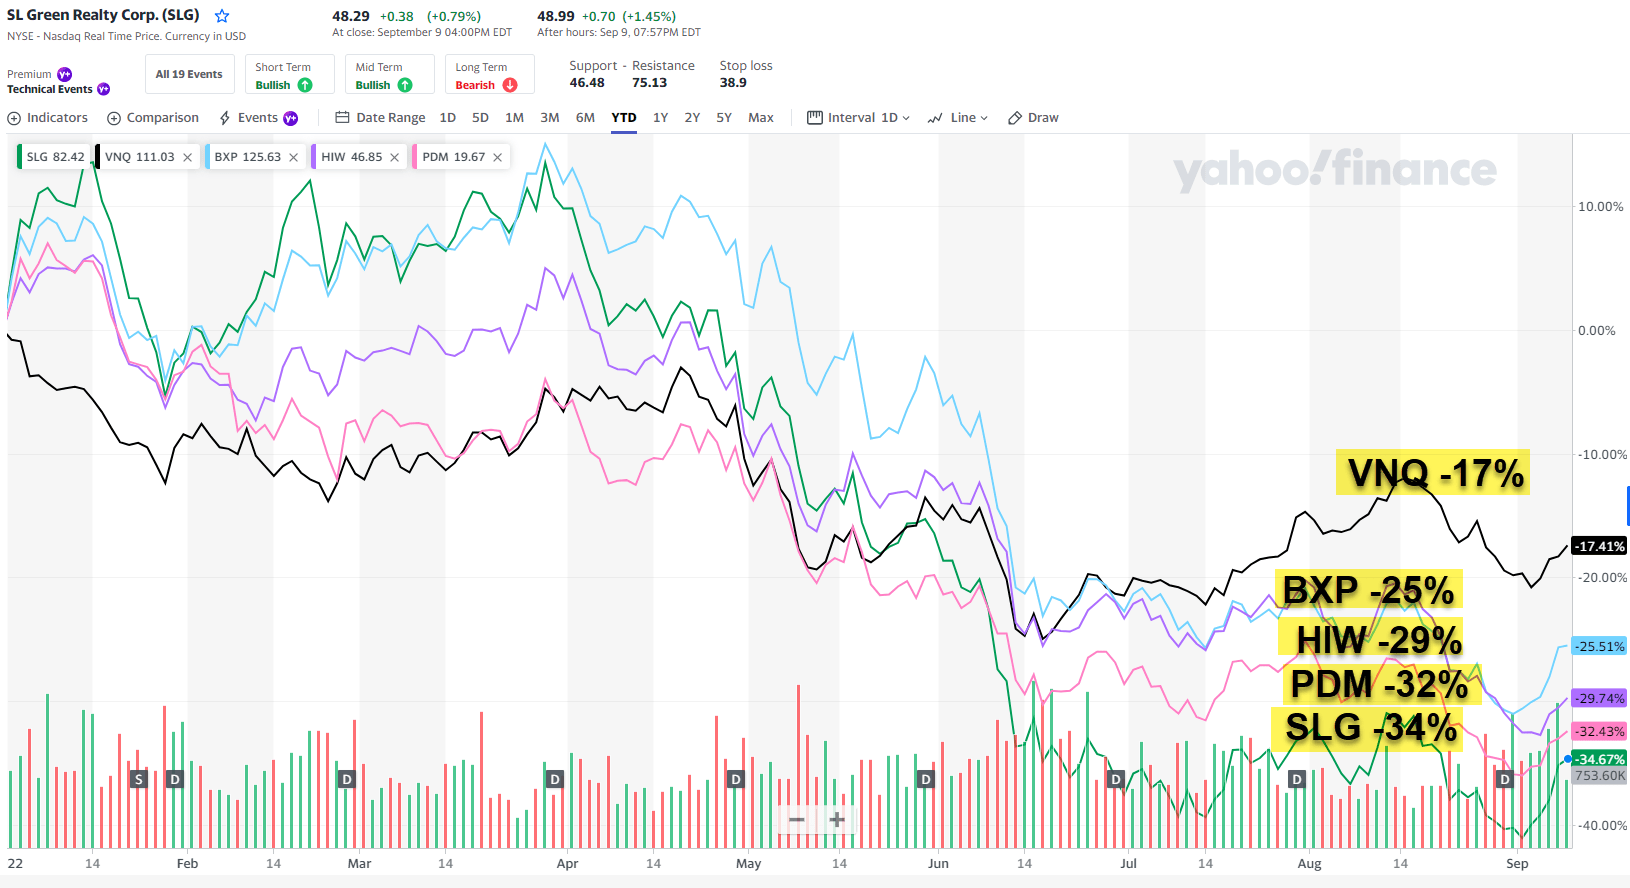
Another category we’re watching closely is the mall sector, recognizing that oversupply of retail space, and specifically the number of department stores across the U,S,, has put tremendous pressure on the landlords.
Several mall REITs have been crushed, notably Washington Prime and CBL, and another remains in life support, Pennsylvania REIT (PEI).
Yahoo Finance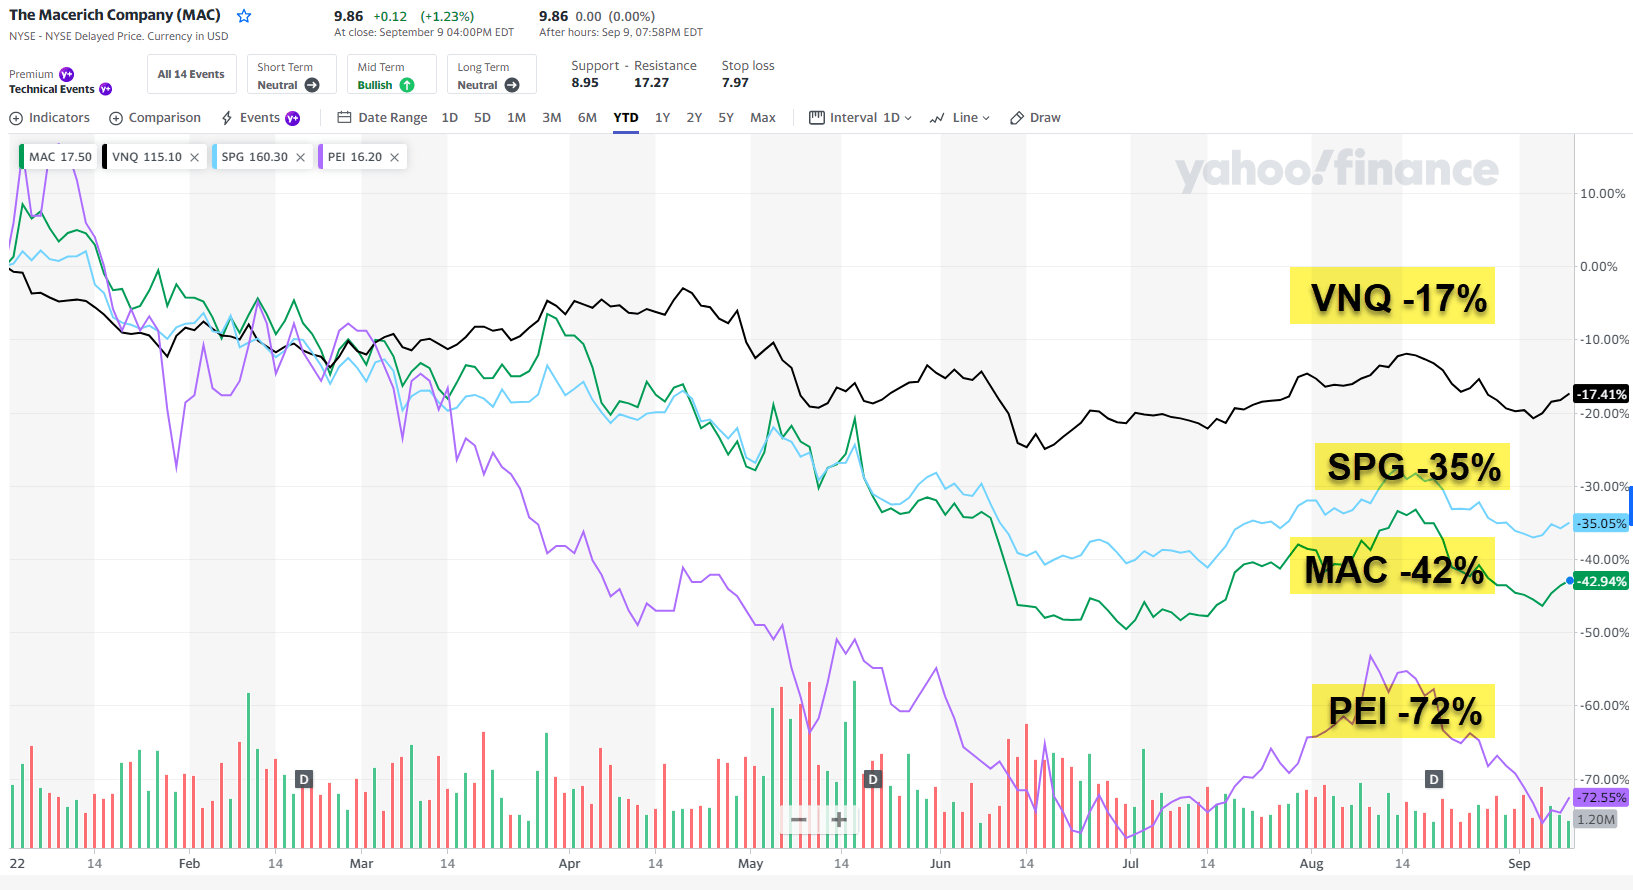
However, today I want to provide you with two REITs that we consider value traps, which means that the cheese (dividend yield) that looks especially tempting could turn into fool’s gold.
Too GOOD To Be True?
Gladstone Commercial Corporation (GOOD) is a net lease REIT that owns 136 properties in 27 states. The company has over 17 million square feet with a portfolio leased to 112 different tenants in 19 industries.
The company listed in 2003 (on Nasdaq) and has a current market capitalization of just $744 million. That’s right…this REIT is 19 years old and has a market cap of just $744 million.
To be clear, GOOD has grown its portfolio, adding 71 properties since 2011 and increasing square footage by over 10.2 million square feet (over 12 years). However, these acquisitions have just not moved the needle, and this is precisely why I view the company as a “value trap.”
FAST Graphs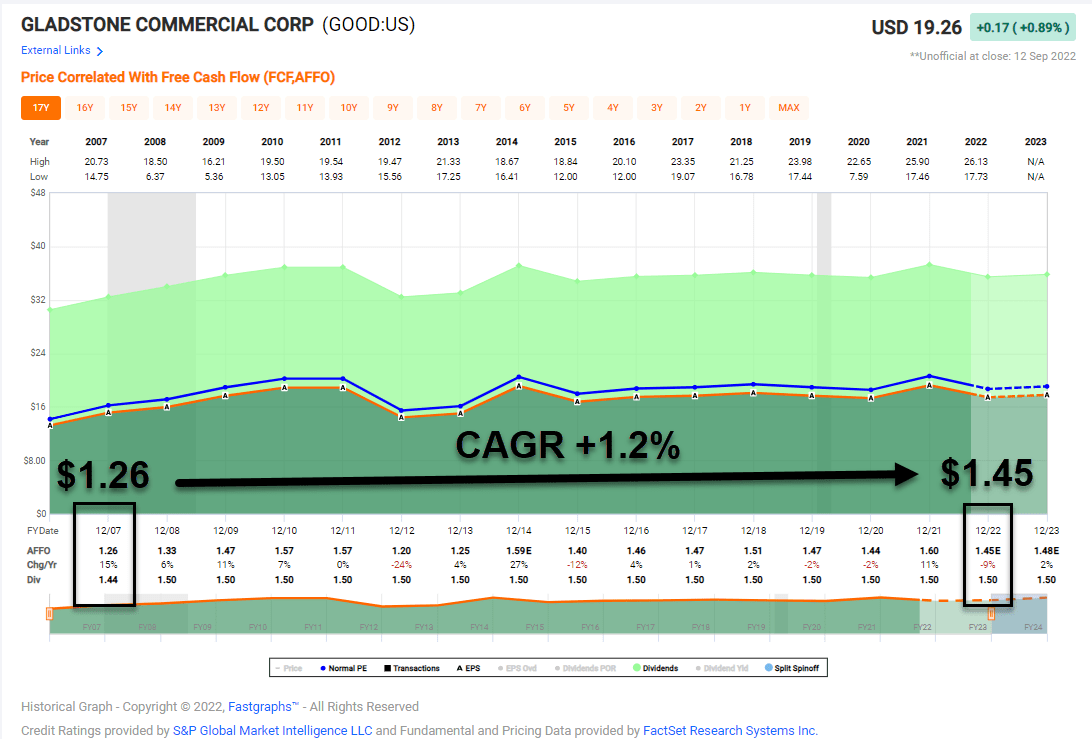
As you can see, AFFO per share, has grown by a meager 1.2% per year over 12 years. More importantly, the dividend has been flat, except for a head fake of sorts in which the company boosted its monthly dividend by .10% from $.12525 per share to $.125275 per share – or just over 1% on an annualized basis.
What’s wrong with this picture?
GOOD has higher leverage than most of its peers, with Net Total Debt / Gross Assets of 45% and Net Total Debt + Preferred / Enterprise Value of 55%. When you combine the elevated equity cost (GOOD’s AFFO yield is 7.8%), you have all of the necessary ingredient for a value trap.
I suspect the company’s cost of capital will remain elevated, as the portfolio has around 44% office exposure (52% industrial, 3% retail, and 1% MOB), and the average office REIT is trading at around 10.3x P/FFO. As viewed below, GOOD trades at 11.6x.
FAST Graphs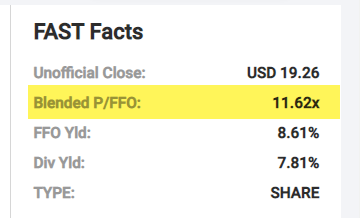
The average net lease REIT trades at 15.3x and the average Gaming REIT trades at 17.0x. The textbook example of a value trap is one where a stock trades cheaply, while earnings growth is flat to negative.
GOOD’s dividend yield is 7.8%, which may seem tempting for some, especially when it’s the allure of monthly distributions. However, the payout ratio – based on AFFO per share – is not covered in 2022, and this is especially troubling because of the company’s outsized office exposure (requires more cap ex when tenants turn over).
FAST Graphs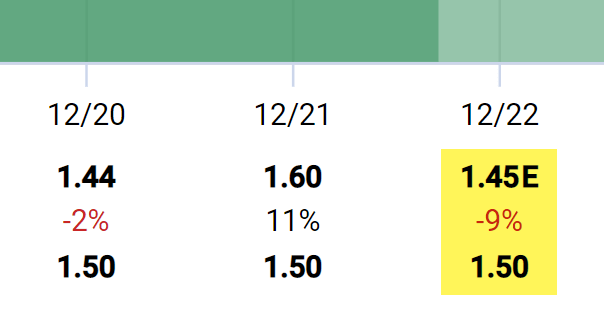
As viewed above, the estimated payout ratio (based on AFFO) in 2022 is 103%.
We recommend avoiding this value trap!
The Show Must Go On…But Will The Dividend?
Our next value trap is EPR Properties (EPR), another net lease REIT that appears to be losing appeal as more and more theaters continue to struggle.
I think most will agree that theaters aren’t dying any day soon, but clearly there are too many screens in the U.S. and we believe that over the next few years there will be a continued acceleration in the rationalization of space.
While EPR has come a long way from its 100% theater focus, we are of the opinion that the diversification has not happened fast enough and that many of the new investments are being forced because of unattractive cost of capital.
Recently, Regal owner Cineworld, the world’s second-largest theater chain, filed for bankruptcy and said it would implement a “a real estate optimization strategy in the US,” likely meaning theater closures.
Already, the U.S. market is saturated with 40,700 screens – a number that hasn’t changed much since 2019, the last pre-pandemic year.
Analysts at the Wall Street firm Moffet Nathanson contend the industry is in “dire need” of trimming back. “We expect to see a drop in U.S. screens as the business looks to normalize,” the analysts said in a note to clients.
I’m of the opinion that theaters aren’t in a death spiral, as I enjoy taking my kids to the big screen once or twice a year. However, my gripe with EPR has to do with the earnings visibility and how the company will generate growth without chasing yield.
EPR’s debt metrics are decent, with unsecured debt ratings of BBB- and zero outstanding on the $1 Billion revolver. And the payout ratio of 67% is far from a sucker yield, although the company was forced to cut the dividend drastically in 2020.
The equity multiple of 9.7% remains elevated, which means that the company is not able to compete with peers like VICI Properties (VICI) or Realty Income (O). Here’s a look at the equity cost for these peers:
FAST Graphs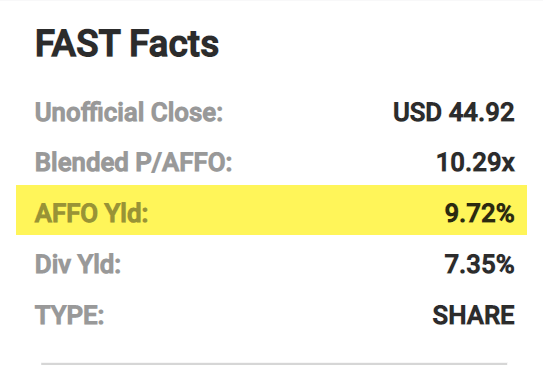
What this means is that instead of buying high quality properties at cap rates of 5% to 6%, EPR must acquire lower quality properties at much higher cap rates. It’s also worth noting that EPR has been forced to reset its dividend twice – in 2009 (during the Great Recession) and in 2020 (during the pandemic).
FAST Graphs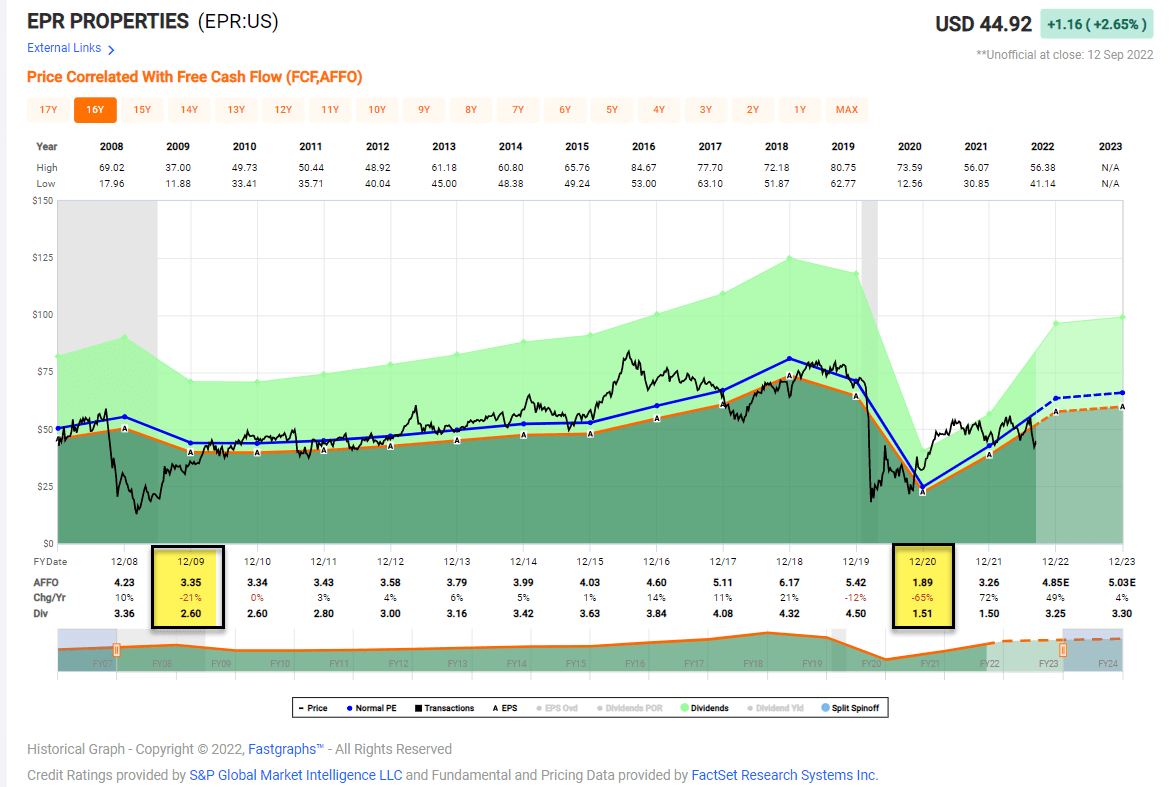
Don’t Take The Cheese, It’s A Trap
I know you’ve heard me say this before, and I’ll say it once again, don’t try to be too cute when it comes to your investments.
There are plenty of better options for income-oriented investors, and while the dividend yields may look tempting (GOOD yields 7.8% and EPR yields 7.4%), the long-term prospects are weak.
Why put hard-earned capital at risk, when you can own shares in higher quality REITs that generate superior total return prospects?
At iREIT on Alpha, we look for companies that create value by investing capital at rates of return that exceed their cost of capital.
The key difference between our recommendations and these two REITs is that our picks generate value by producing cash flows in excess of the cost of the investments being made.
Simply put, our picks achieve lower volatility because their cost of capital is much lower than these two value trap REITs. Our preferred picks strike the right balance between growth and ROIC, which is a critical ingredient to value creation.
iREIT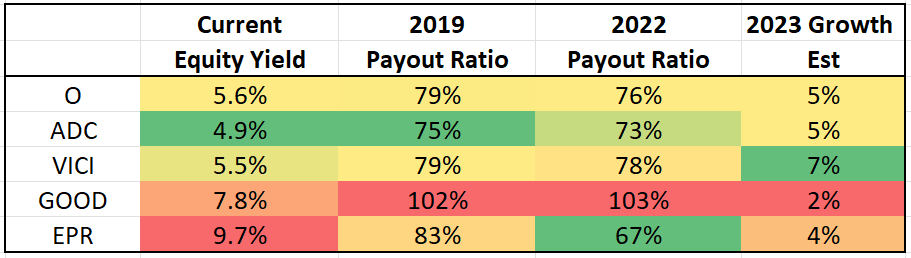
Be the first to comment