

Pgiam/iStock via Getty Images
This is an update of the article on the Master Sentiment Indicator (‘MSI’) written October 25th (here). Since that article we have developed the ST-MSI, which is a shorter term MSI.
Both the master sentiment indicator and the short-term master sentiment indicator suggest that prices will continue higher and that this is not a bear market rally. These two indicators are composites made from various sentiment indicators that have long term track records.
The master sentiment indicator is made from indicators that reflect long term views and are updated on a weekly basis. The short term MSI is composed of sentiment indicators that change daily. Both are based on the theory of contrary opinion, which holds that prices will move opposite what most investors expect once those expectations have reached an extreme.
In theory, the ST-MSI signals short to intermediate term price moves, while the MSI indicates bull or bear markets and intermediate term movements.
The MSI
The MSI (Master Sentiment Indicator) is composed of eight classic sentiment indicators fused together using our SK ranking system (the SK ranking system is explained at the end). These are the indicators that make up the MSI and we mathematically adjust each to reflect a long-term market view:
- 5% CBOE Total Puts and Calls Ratio
- 5% CBOE Equity Puts to Calls Ratio
- The CME Commitment of Traders data on the S&P futures
- Buying in the ProShares S&P 500 Inverse Fund (SH)
- NAAIM Exposure Index (National Association of Active Managers)
- Hulbert Rating Service (Stocks)
- Hulbert Rating Service (Nasdaq)
- The AAII Sentiment Survey
The chart below shows the multiple extreme readings of the MSI this year and over the last 15 years. The correlation with major market lows is phenomenal and we believe it better than any economic or financial metric in this regard.
It is normal, as the market rallies, to experience an easing of bearish sentiment. But we find it encouraging that after a six-week rally, we still have a negative reading of -6.4.
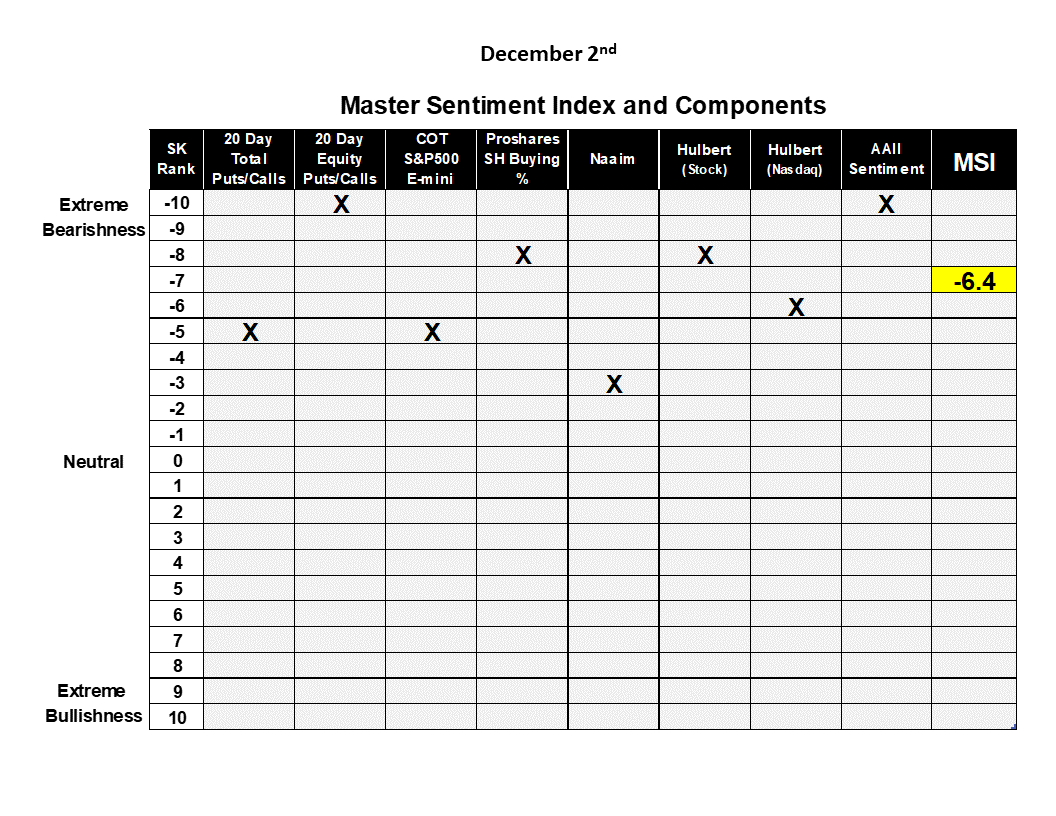
The table below the chart shows the SK ranking of each indicator that makes up the SMI.
The Master Sentiment Indicator and the SPY (Michael McDonald) MSI indicator component table (Michael McDonald)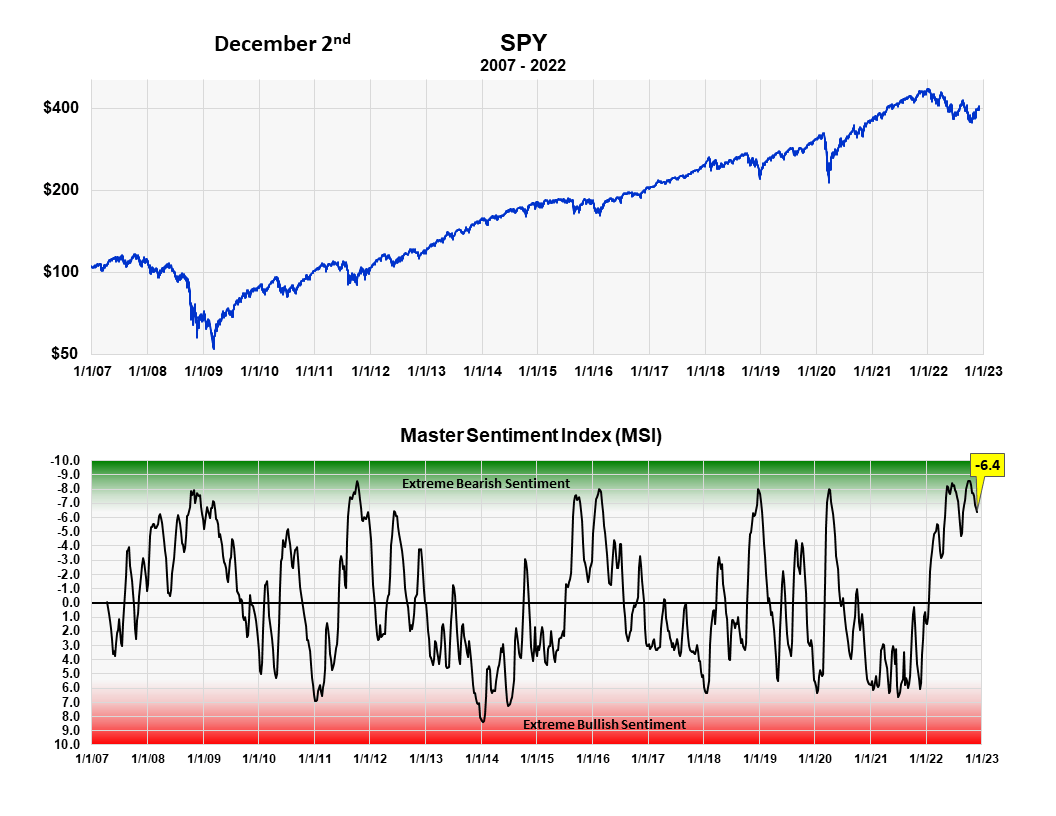
The ST-MSI
The ST-MSI (Short Term Master Sentiment Indicator) is composed of seven sentiment indicators that are calculated daily. We adjust the data of each to reflect a shorter-term view of the market. They’re combined into one indicator using our SK ranking system. The components that make up the ST-MSI are:
- Hulbert Rating Service (Stocks)
- Hulbert Rating Service (Nasdaq)
- VIX
- 20% Equity P/C
- 20% Total P/C
- ProShare Bull/Bear Purchase Ratio
- ProShare UltraPro Bull/Bear Purchase Ratio
The chart of the ST-MSI also shows the extreme readings reached this year and over the last seven years. Being a short-term sentiment indicator, it measures quick changes in investor outlook for the market.
Like the SMI it is normal to experience an easing of bearish sentiment as the market rallies. This time, as the graph shows, the ST-SMI is holding close to the extreme bearish levels with a reading of -5.1. In our opinion, this is also a positive sign for a continuation of the market to higher levels, and not the sign of a bear market rally.
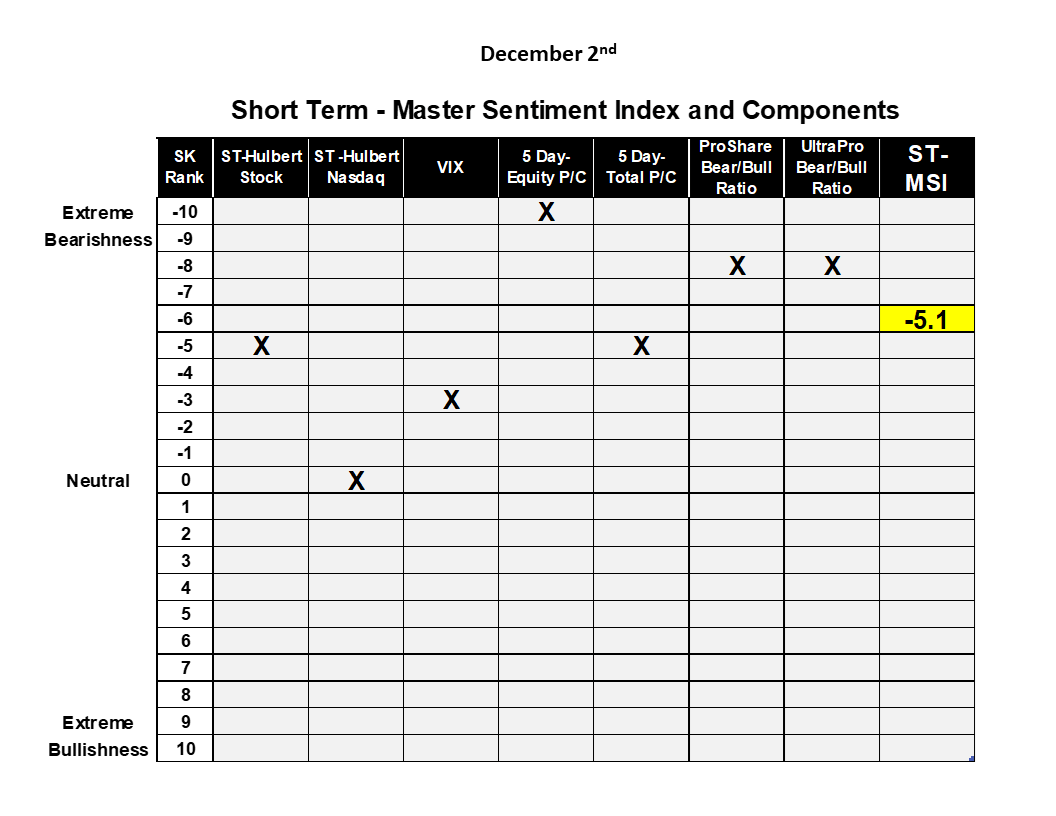
The table shows the SK ranking of each indicator that makes up the ST-SMI.
The ST-MSI plotted against SPY (Michael McDonald) the ST-MSI table of the components that make it up (Michael McDonald)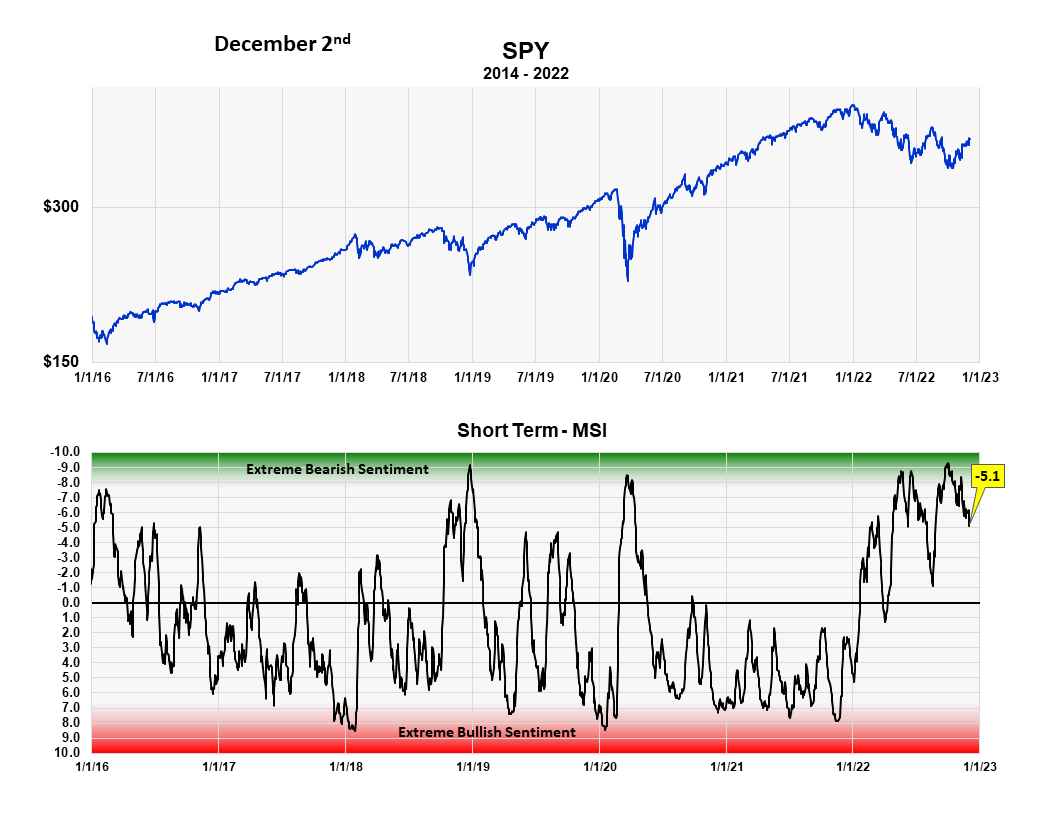
Combining Individual Sentiment Indicators to Form a Master Sentiment Index
The SK ranking system is as follows:
Combining multiple indicators to form one sentiment indicator is not easy. How do you combine a puts and calls ratio of 1.0 with a 40% Investors Intelligence bearish percent? Everything has to be mathematically consistent. We accomplished it in the following way.
We compute a moving average of each indicator that we believe reflexes a long-term value. We take each moving average back as far as history allows (the smallest time period being 17 years) and determined the range of values that contained the highest 5% of values. Then we determined the range of values that contained the next highest 5%. This procedure was continued in 5% increments down to the 5% band that contained the smallest values. This activity allows us to put every indicator on the same 21 range scale which is labeled 10 to -10.
We then added each indicator’s position number (10 to -10) and divided the total by the number of indicators in the composite. Out comes a composite number between 10 and -10 that represents the average bracket value of all the sentiment indicators.
Summary
After the six-week rally, we believe the continuing high rankings of the two master sentiment indicators suggest this is a sustainable market advance and not a bear market rally.
Be the first to comment