

Deagreez
After four straight weeks of gains, largely based on a collective market delusion about a Fed pivot that every Fed official has spent a month denying, the market is starting to wake up to reality.
CME Group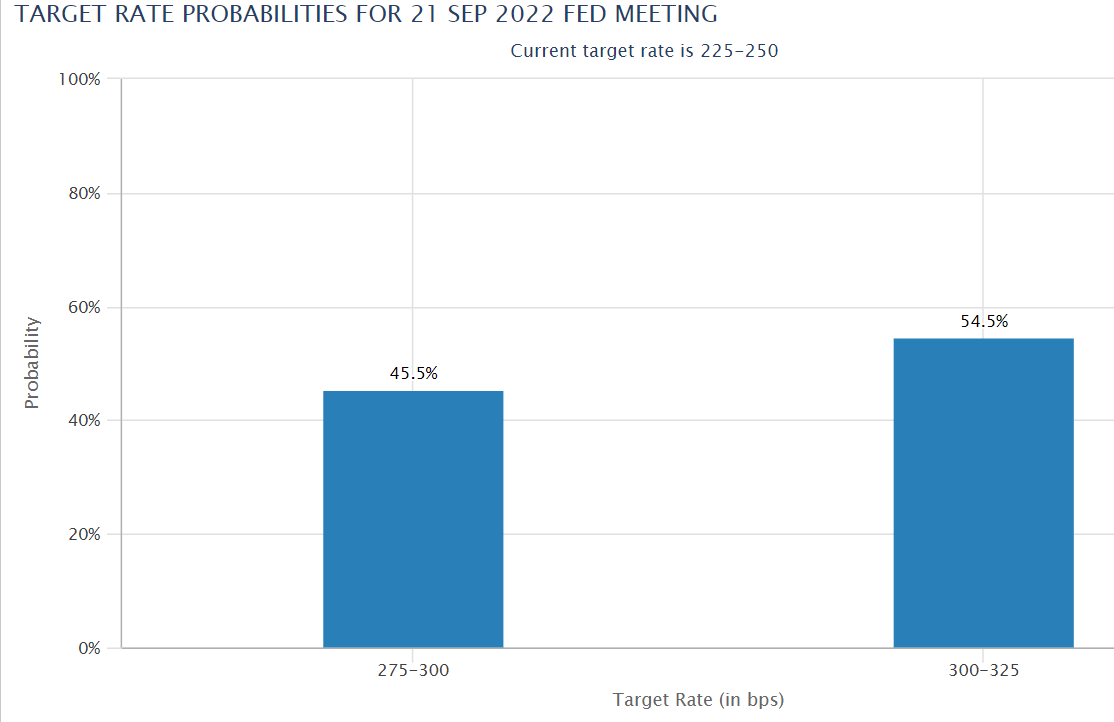
The Fed futures market is now pricing in a 55% chance of a 75 basis point hike in September to 3%, the high end of the Fed’s estimate of the neutral interest rate.
But guess what? What the Fed is doing in September is the wrong question to ask for everyone other than short-term traders. So is the right question “where will the Fed stop hiking rates?”
CME Group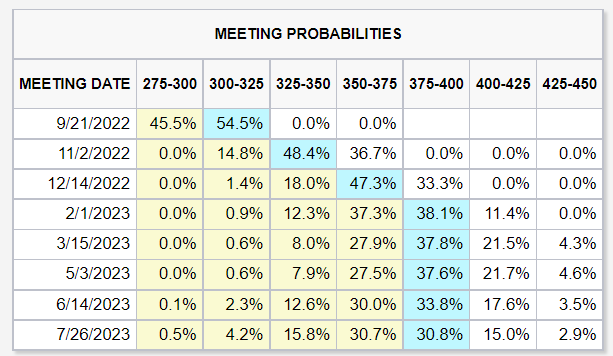
The bond market is now pricing in a peak Fed rate of 3.75% with a 26% chance of 4% and a nearly 5% chance they go as high as 4.25%.
The “Fed pivot,” specifically rate cuts in early 2023, is now off the table according to the bond market.
But where the Fed stops hiking and how long it holds rates at peak before cutting is also the wrong question for long-term investors to ask.
The economy drives earnings, and earnings ultimately drive stocks, so maybe the correct question is, “what will the Fed hiking to 4% mean for the economy?”
That’s certainly an important question, now that headline CPI inflation appears to have peaked at 9.1% in June.
Cleveland Federal Reserve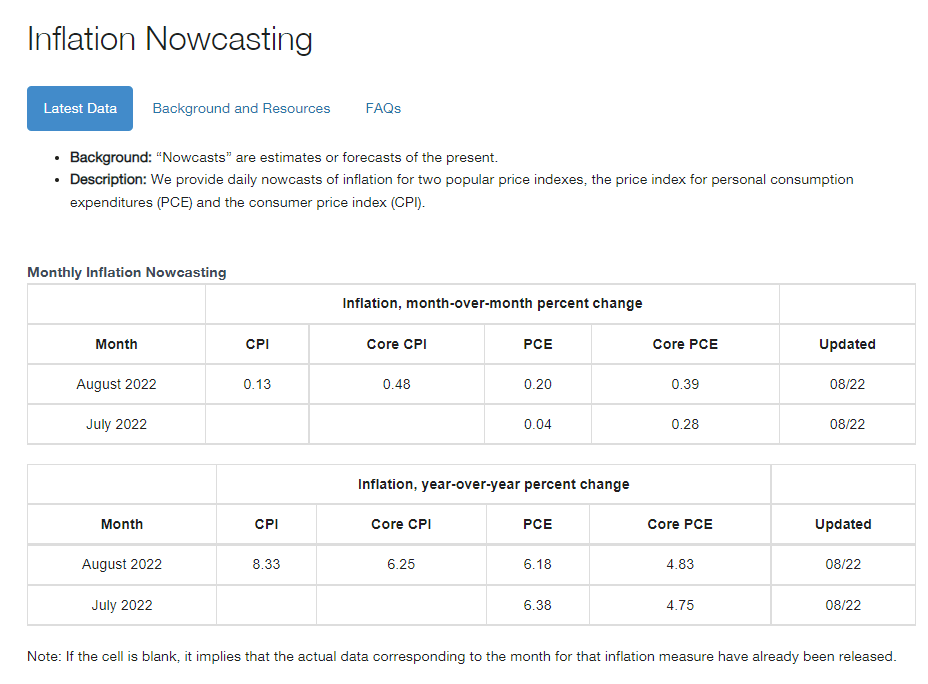
The Cleveland Fed is expecting next month’s inflation report to come in at 8.3% YOY, down another 0.2% from this month. But core PCE, the Fed’s official inflation metric, is expected to increase 0.4% month-over-month and clock in at 4.8% year-over-year.
Why does this matter? Because since 1954, every single Fed hiking cycle has ended with the Fed funds rate above core PCE. The longer core PCE stays above the Fed’s 2% target; the higher interest rates have to go and the longer they have to stay there.
So does this mean we’re doomed to have a recession, as most economists think is the fate of Europe? According to the bond market, the probability of a recession within the next 13 months is approximately 80%.
Why isn’t it 100% if the Fed is going to 3.75%, a level that was unimaginable just six months ago? Because the US economy is resilient, diversified, and flush with cash.
- $9 trillion in total stimulus from the pandemic
Corporate America has $7 trillion in cash, and JPMorgan estimates US consumers still have an excess $1.9 trillion.
The good news is that this is why spending has remained strong so far. The bad news is that strong spending so far, when combined with ongoing supply chain issues, means higher inflation for longer.
This is the “good news is bad news” world we live in now. Unless inflation comes down quickly, the lack of bad news will force the Fed to keep hiking, until the economy breaks.
That has been the case every time inflation has been above 5%.
Daily Shot 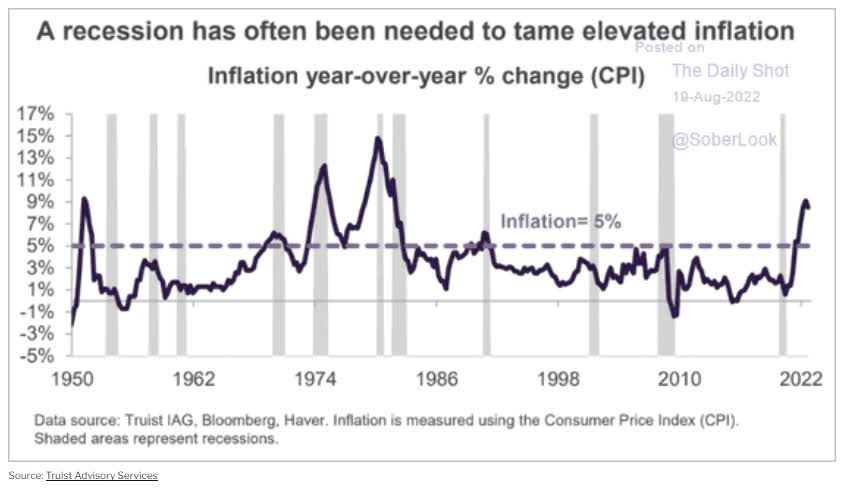
The four times the Fed orchestrated a soft landing, unemployment was much higher, inflation was much lower, and headed downwards.
So history, inflation, and the bond market all say a recession is coming. What does that mean for stocks in the short-term?
This article explains why history and fundamentals say that a 16% to 27% market decline is possible, even likely, though far from guaranteed.
But guess what? The probability of a recession in 2023, and where the market may or may not bottom in the coming months is also the wrong question to ask. At least if your goal is to maximize long-term income and wealth.
The fate of one or even two years of earnings growth won’t change your financial destiny. Do you know what will? Buying blue-chips in a bear market.
Charlie Bilello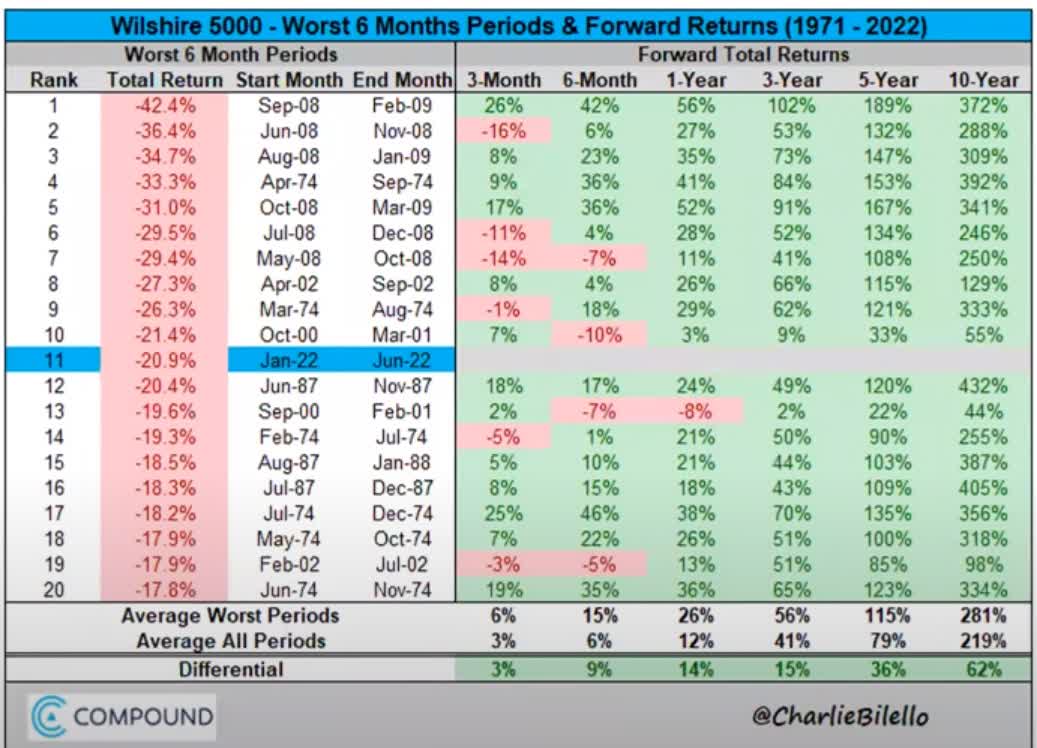
In 3 years, stocks are almost certainly going to be up, historically speaking about 56%.
In 10 years, they are historically likely to be almost 4X higher.
But if the market is possibly going to fall almost 30% more, isn’t is better to wait out the pain and buy back in at the bottom and then earn up to 6X returns over the next 10 years?
“Don’t try to buy at the bottom and sell at the top. This can’t be done – except by liars.” – Bernard Baruch
Ycharts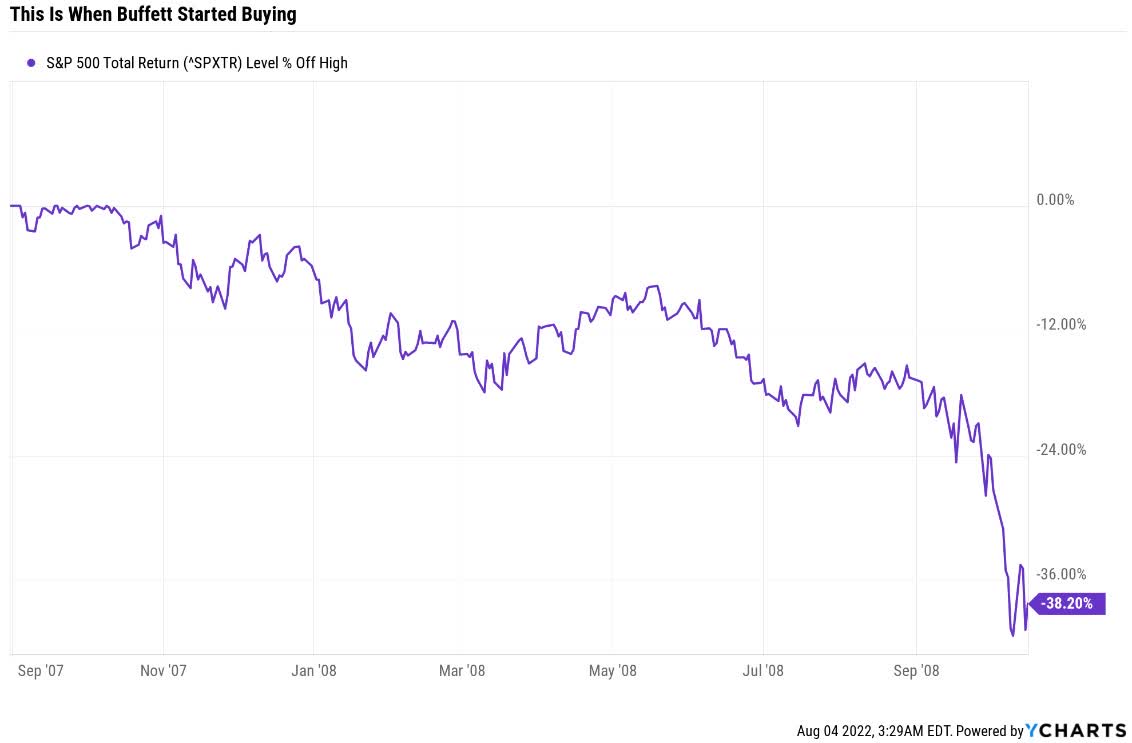
Did Buffett time the market in October 2008 when he wrote a NYT op-ed called “Buy American, I Am.”?
No, he only knew blue-chip bargains were plentiful so be bought by the billions.
Buffett’s Market Timing Skills Suck
Ycharts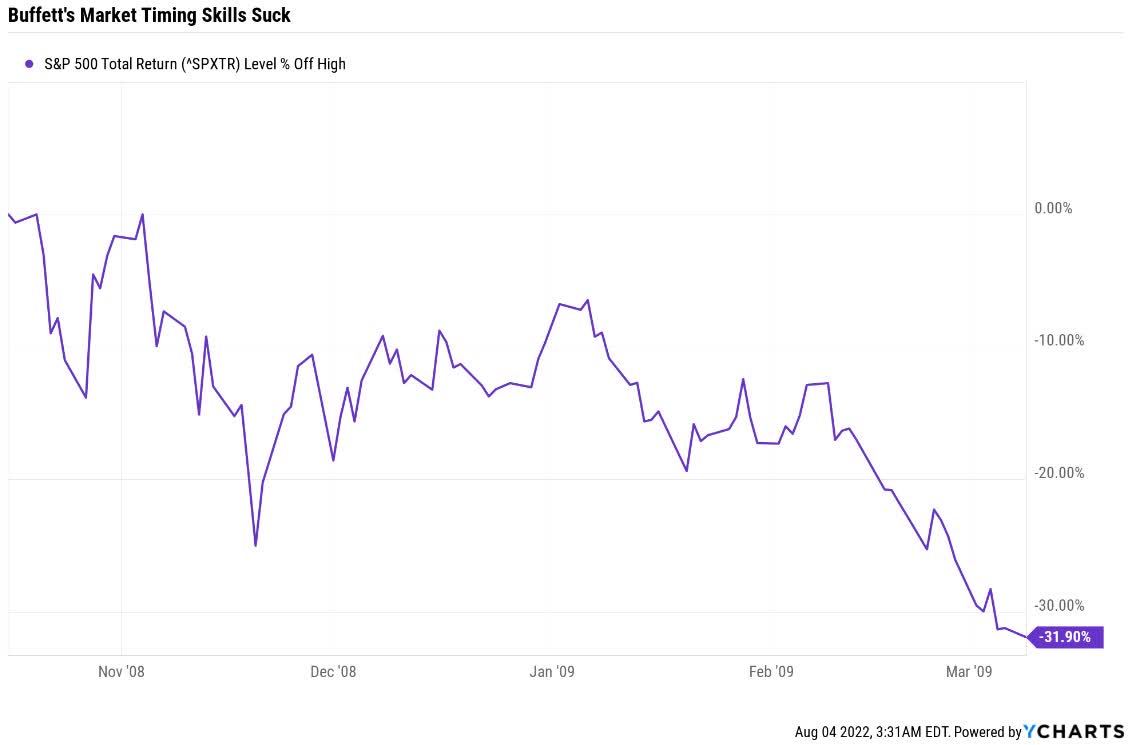
Stocks fell 32% more after Buffett started backing up the truck. Do you know what he was doing? He just kept buying, at steadily higher margins of safety.
Why? Because Buffett knows that the wrong question is “What will stocks do in the next year?”
The right question is, “what will stocks do in the next ten years?”
“If you’re not willing to own a stock for 10 years, don’t even think about owning it for 10 minutes.” – Warren Buffett
Ycharts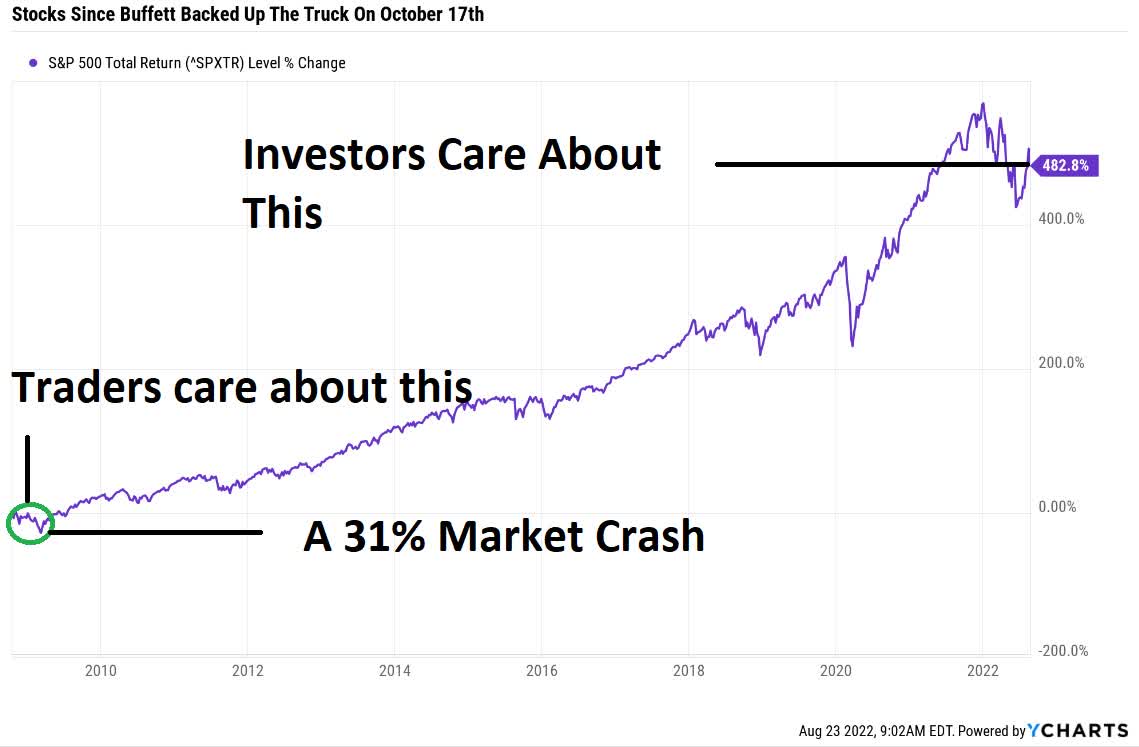
Can you even see the 31% crash after Buffett made the “mistake” of buying billions worth of stocks?
If you buy blue-chips in a bear market in 10 years, you will feel like you bought the bottom, and will be far richer for it.
And that goes for almost all blue-chips, but especially fast-growing ones like Taiwan Semiconductor (TSM) and Lowe’s (LOW).
Let me show you exactly why these are two dividend growth blue-chip bargains you don’t want to miss for the next decade, no matter what happens with the market in the next few months.
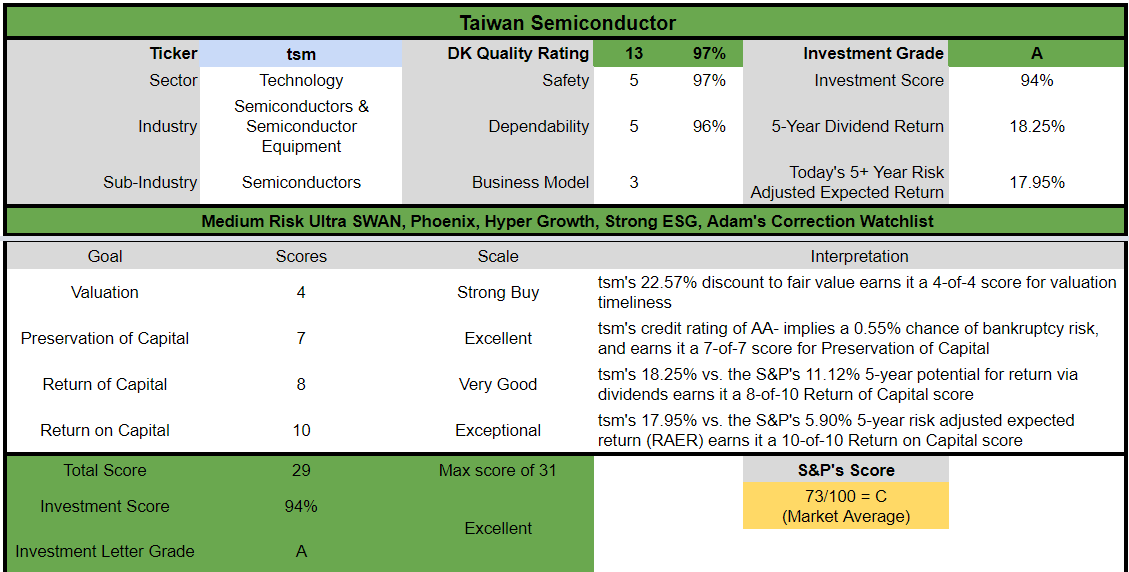
Taiwan Semiconductor: The Global King Of Chips
Full Deep Dive On Taiwan Semiconductor: Growth Prospects, Investment Thesis, Risk Profile, Valuation Profile, And Long-Term Total Return Potential
- Taiwan Semiconductor: One Of The World’s Greatest Dividend Growth Stocks Is On Sale
- TSM has a 20% dividend tax withholding
- own it in a taxable account to recoup with a tax credit
What TSM Does
“Taiwan Semiconductor Manufacturing, or TSMC, is the world’s largest dedicated contract chip manufacturer or foundry. It makes integrated circuits, or ICs, for customers based on their proprietary IC designs. The firm has long benefited from global semiconductor firms transitioning from integrated device manufacturers to fabless designers. TSMC, like all foundries, assumes the costs and capital expenditures of running factories amid a highly cyclical market for its customers.” – Morningstar
TSM is the world’s leading foundry, with over 50% of the global market share. The cost of a new chip plant can be as much as $15 billion, and no one has the financial resources to ramp up production like TSM, which is spending $100 billion over three years to increase capacity.
Reasons To Potentially Buy TSM Today
| Metric | Taiwan Semiconductor |
| Quality | 97% 13/13 Ultra SWAN |
| Risk Rating | Medium |
| DK Master List Quality Ranking (Out Of 500 Companies) | 24 |
| Quality Percentile | 95% |
| Dividend Growth Streak (Years) | 4 |
| Dividend Yield | 2.30% |
| Dividend Safety Score | 96% Very Safe |
| Average Recession Dividend Cut Risk | 0.5% |
| Severe Recession Dividend Cut Risk | 1.2% |
| S&P Credit Rating | AA- Stable |
| 30-Year Bankruptcy Risk | 0.55% |
| Consensus LT Risk-Management Industry Percentile |
88% Very Good, Bordering on Exceptional Risk-Management |
| Fair Value | $115.57 |
| Current Price | $86.09 |
| Discount To Fair Value | 26% |
| DK Rating |
Potentially Very Strong Buy |
| PE | 14.1 |
| Cash-Adjusted PE | 7.7 |
| Growth Priced In | -1.5% |
| Historical PE Range | 17 to 20 |
| LT Growth Consensus/Management Guidance | 24.7% |
| PEG Ratio | 0.31 Hyper-Growth At A Wonderful Price |
| 5-year consensus total return potential | 21% to 29% CAGR |
| Base Case 5-year consensus return potential |
24% CAGR (5X S&P 500 consensus) |
| Consensus 12-month total return forecast | 40% |
| Fundamentally Justified 12-Month Return Potential | 37% |
| LT Consensus Total Return Potential | 27.0% CAGR |
| Inflation-Adjusted Consensus LT Return Potential | 24.8% |
| Consensus 10-Year Inflation-Adjusted Total Return Potential (Ignoring Valuation) | 9.15 |
| LT Risk-Adjusted Expected Return | 18.80% |
| LT Risk-And Inflation-Adjusted Return Potential | 16.58% |
| Conservative Years To Double | 4.34 |
(Source: Dividend Kings Zen Research Terminal)
TSM is so undervalued, trading at 7.7X cash-adjusted earnings, that analysts expect it will soar 40% in the next year. That forecast is justified by fundamentals.
TSM 2024 Consensus Total Return Potential
(Source: FactSet Research Terminal)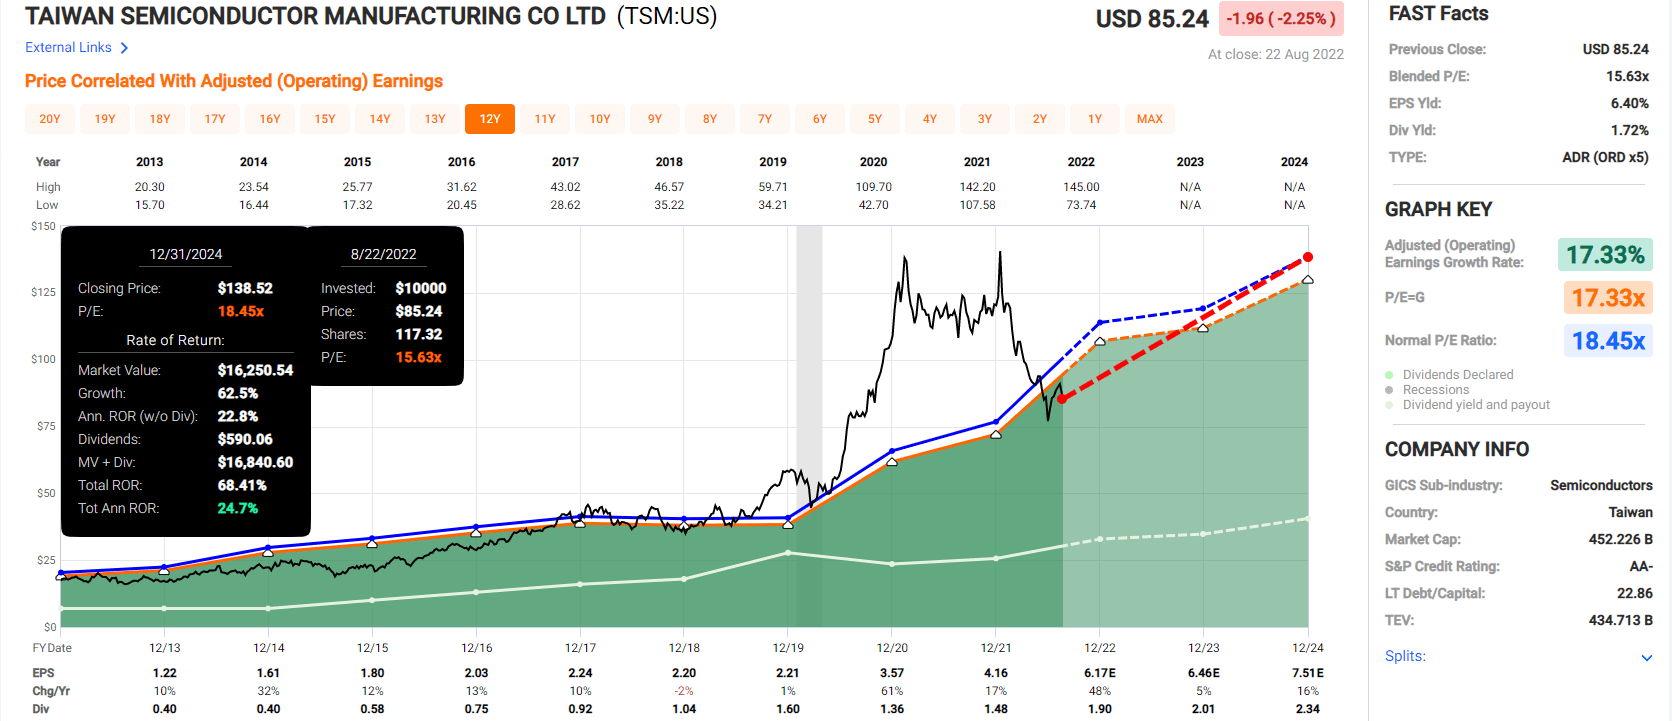
If TSM grows as expected through 2024 and returns to historical fair value, it could deliver Buffett-like 25% annual returns.
TSM 2027 Consensus Total Return Potential
(Source: FactSet Research Terminal)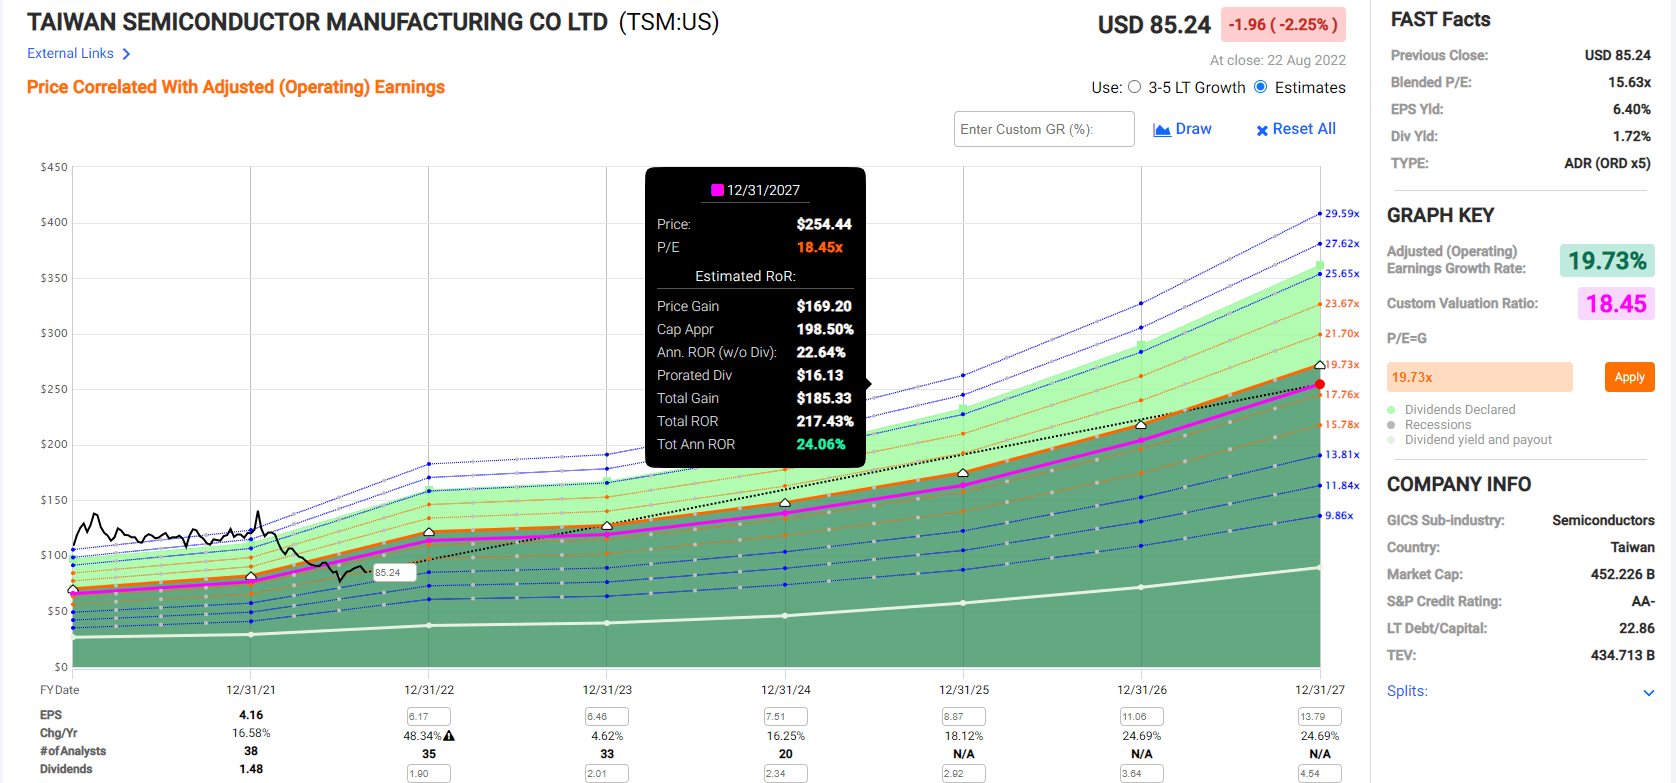
Many blue-chips can deliver Buffett-like returns for a few years, but TSM offers the potential for 24% annual returns for five years or even longer.
- 217% by 2027, potentially more than triple your money
Now compare that to the S&P 500.
S&P 2024 Consensus Total Return Potential
(Source: FactSet Research Terminal)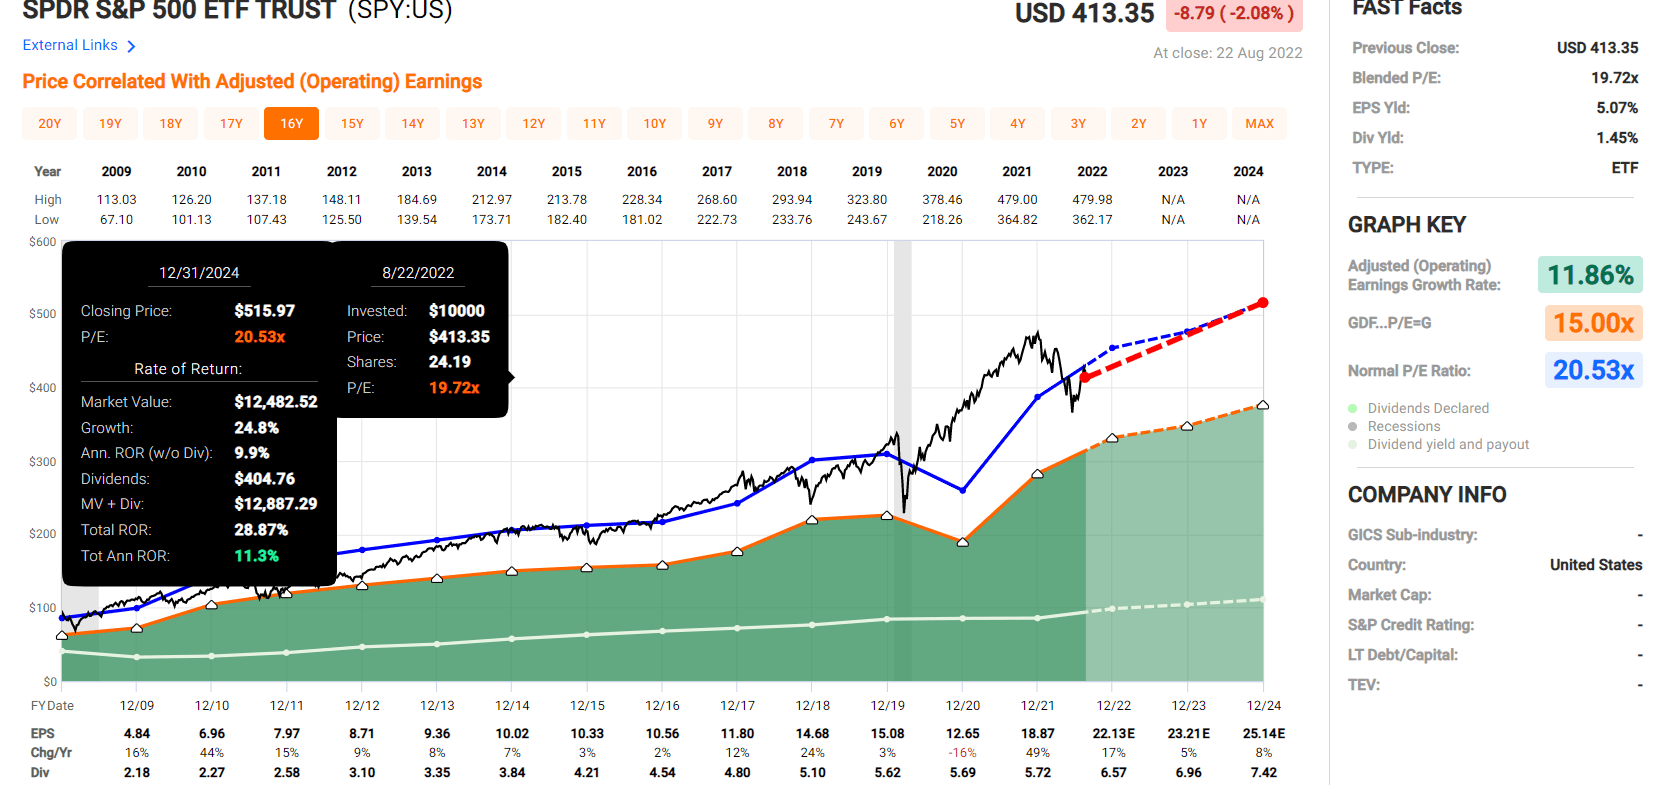
S&P 500 2027 Consensus Return Potential
| Year | Upside Potential By End of That Year | Consensus CAGR Return Potential By End of That Year | Probability-Weighted Return (Annualized) |
Inflation And Risk-Adjusted Expected Returns |
| 2027 | 45.94% | 7.85% | 5.89% | 3.62% |
(Source: DK S&P 500 Valuation And Total Return Tool)
TSM offers 5X the return potential of the S&P 500 over the next five years.
Think that long-term returns of 24% are impossible to maintain? Yes and no.
TSM Rolling Return Since 1997
(Source: Portfolio Visualizer)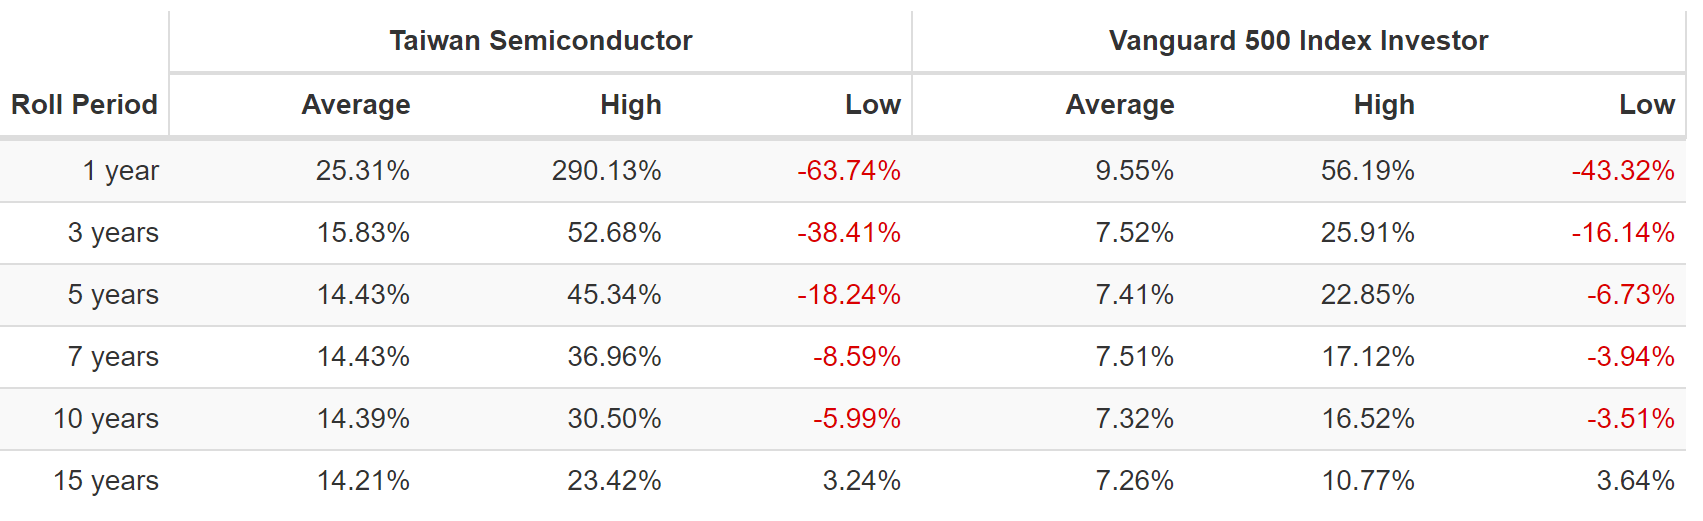
This is a highly cyclical industry, which is why TSM’s average one year return for 27 years is 25%, but the average 15-year rolling return is 14% CAGR, which is still 2X that of the S&P 500.
TSM Investment Decision Score
DK (Source: Dividend Kings Automated Investment Decision Tool)
TSM is a reasonable and prudent hyper-growth dividend Ultra SWAN for anyone comfortable with its risk profile.
- 23% discount vs. 6% market premium = 29% better valuation
- 2.3% yield vs. 1.6% yield
- 170% better consensus long-term return potential
- 3X better risk-adjusted expected return over the next five years
- 70% higher 5-year income potential than the S&P 500
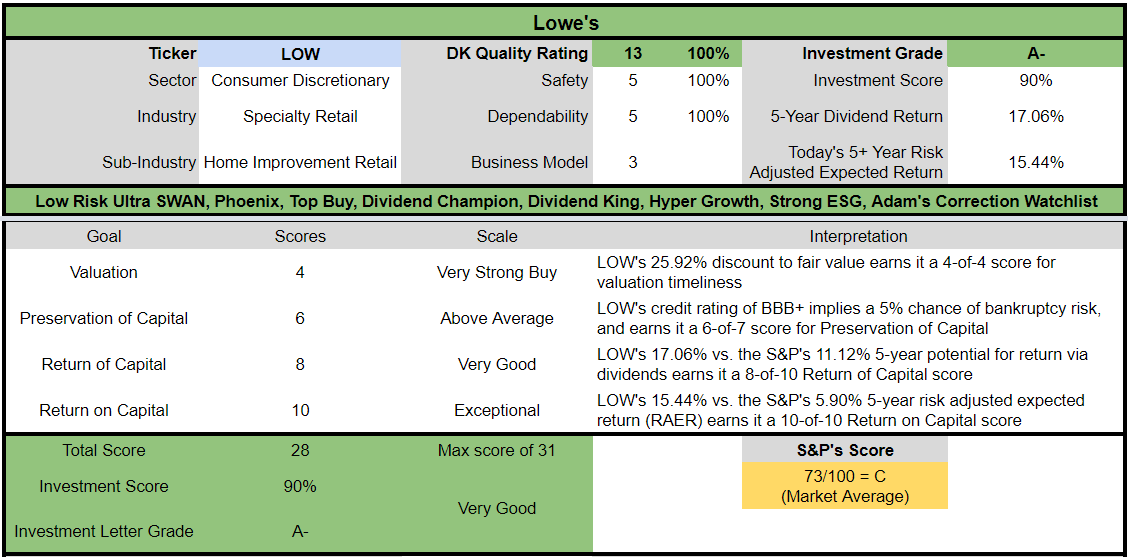
Lowe’s: As Close To God’s Own Dividend Aristocrat As Exists On Wall Street
Full Deep Dive On Lowe’s: Growth Prospects, Investment Thesis, Risk Profile, Valuation Profile, and Long-Term Total Return Potential
Lowe’s might be second to Home Depot (HD) in profitability, but it’s first in the hearts of income investors.
- A 60-year dividend growth streak makes it a dividend king
- every year since 1962
Worried about inflation? Not even 15% inflation could sink Lowe’s dividend streak.
Soaring interest rates? Not even 20% interest rates could stop Lowe’s from minting millionaires.
Worried about recession? Lowe’s has been raising its dividend every year through eight recessions.
Worried about the housing market sinking Lowe’s business? Mortgage rates as high as 16.6% couldn’t sink Lowe’s dividend, so you think 6% might?
Reasons To Potentially Buy Lowe’s Today
| Metric | Lowe’s |
| Quality | 100% 13/13 Ultra SWAN Dividend King |
| Risk Rating | Very Low |
| DK Master List Quality Ranking (Out Of 500 Companies) | 3 |
| Quality Percentile | 99% |
| Dividend Growth Streak (Years) | 60 |
| Dividend Yield | 2.00% |
| Dividend Safety Score | 100% Very Safe |
| Average Recession Dividend Cut Risk | 0.5% |
| Severe Recession Dividend Cut Risk | 1.0% |
| S&P Credit Rating | BBB+ Stable |
| 30-Year Bankruptcy Risk | 5.00% |
| Consensus LT Risk-Management Industry Percentile |
82% Very Good, Risk-Management |
| Fair Value | $280.80 |
| Current Price | $208.36 |
| Discount To Fair Value | 26% |
| DK Rating |
Potentially Very Strong Buy |
| PE | 15.6 |
| Cash-Adjusted PE | 11.7 |
| Growth Priced In | 6.2% |
| Historical PE Range | 19 to 21 |
| LT Growth Consensus/Management Guidance | 20.1% |
| PEG Ratio | 0.58 Hyper-Growth At A Wonderful Price |
| 5-year consensus total return potential |
18% to 24% CAGR |
| Base Case 5-year consensus return potential | 22% CAGR, 4X the S&P 500 |
| Consensus 12-month total return forecast | 34% |
| Fundamentally Justified 12-Month Return Potential | 37% |
| LT Consensus Total Return Potential | 22.1% |
| Inflation-Adjusted Consensus LT Return Potential | 19.9% |
| Consensus 10-Year Inflation-Adjusted Total Return Potential (Ignoring Valuation) | 6.13 |
| LT Risk-Adjusted Expected Return | 14.70% |
| LT Risk-And Inflation-Adjusted Return Potential | 12.48% |
| Conservative Years To Double | 5.77 |
(Source: Dividend Kings Zen Research Terminal)
Lowe’s is trading at valuations only seen in recessionary bear markets, meaning it might have already priced in the 2023 recession.
And if it falls further? Who cares when the reward/risk ratio is this attractive.
LOW 2024 Consensus Total Return Potential
(Source: FAST Graphs, FactSet Research)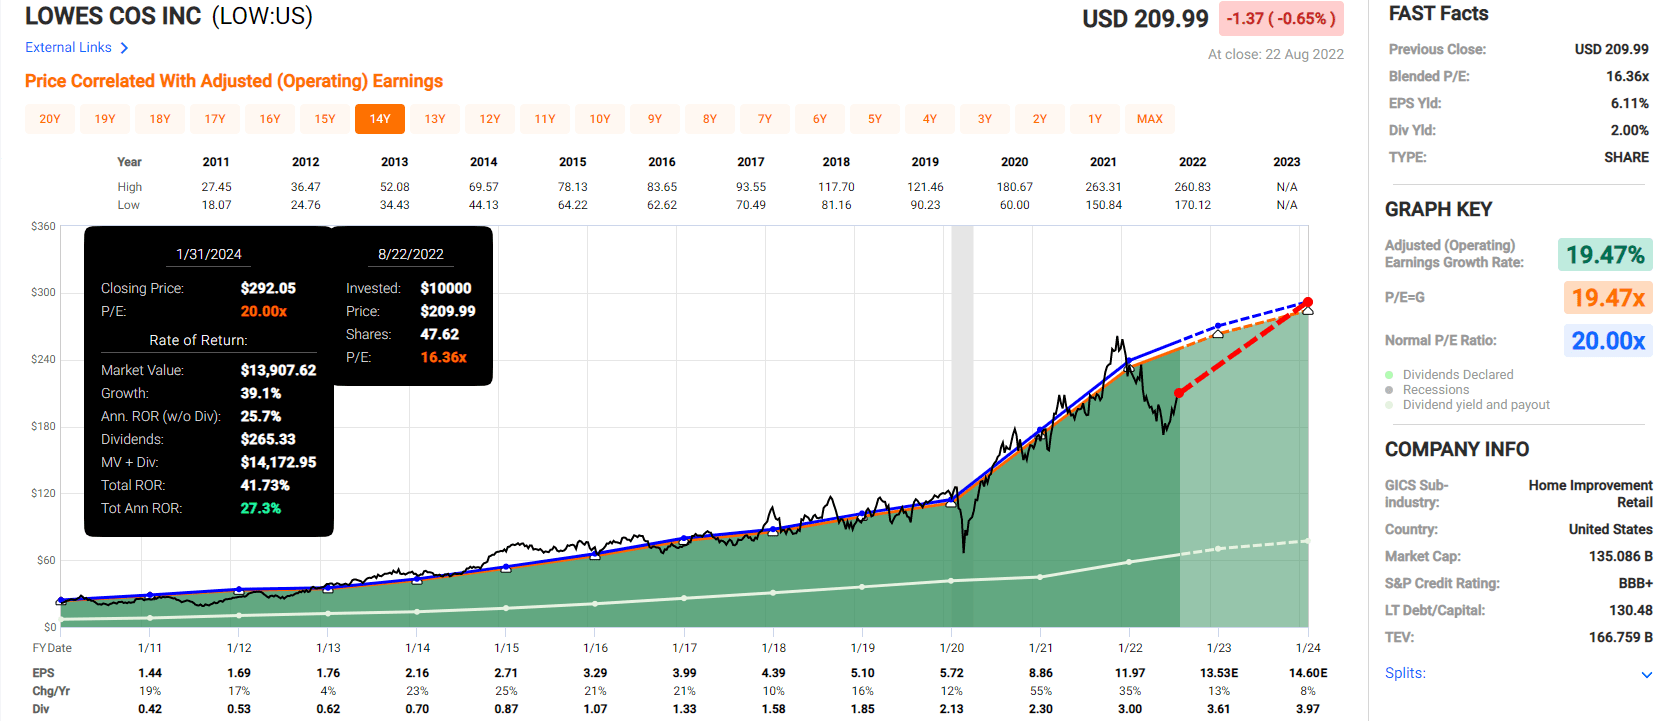
Look at how LOW growing at 20%, as analysts expect in the future, hugs 20X earnings like a rail.
Look at how it bottomed at 13.7X earnings in June and is taking off like a rocket. Could it retest the lows? Sure. But if it grows as analysts expect and returns to market-determined fair value by the end of 2024, you’ll still make 27% annual returns.
LOW 2027 Consensus Total Return Potential
(Source: FAST Graphs, FactSet Research)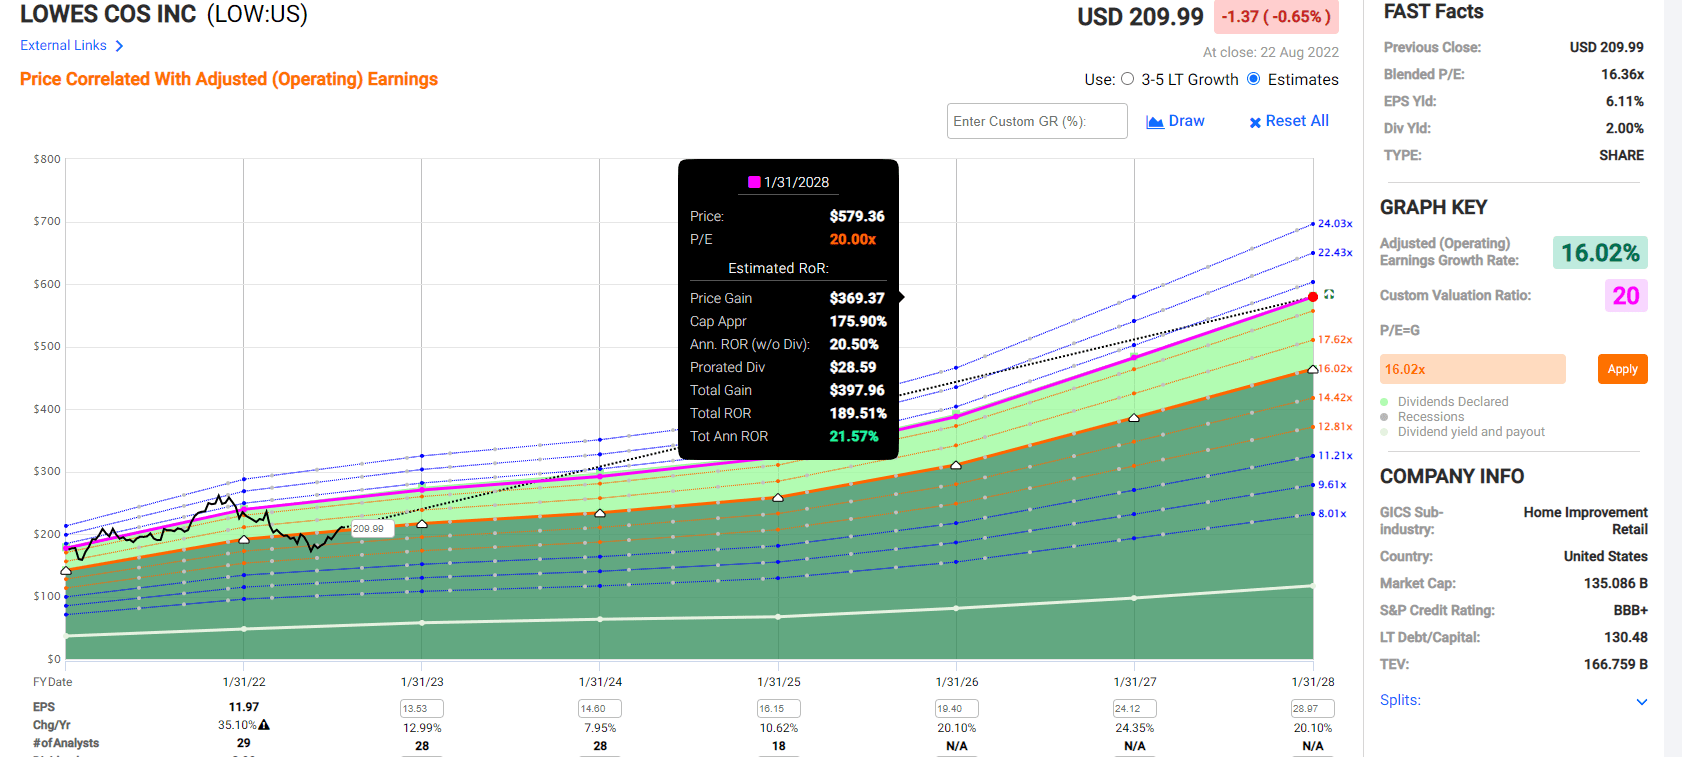
LOW is up 22% from the June 16th lows and yet still could potentially triple in five years, offering a 22% annual return potential.
- still, Buffett-like return potential from an Ultra SWAN dividend king bargain hiding in plain sight
Think 20% annual returns from Lowe’s are absurd?
Lowe’s Rolling Returns Since 1985
Portfolio Visualizer Premium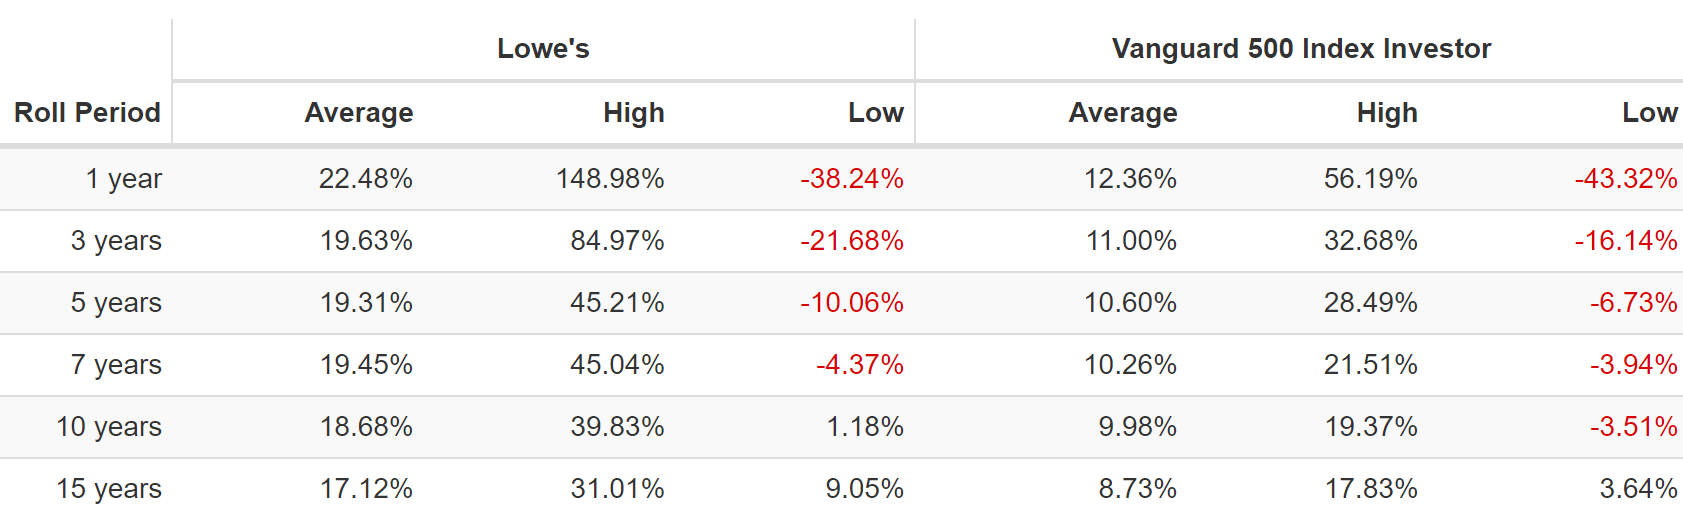
For the last 37 years, its average one-year rolling return was 22.5% CAGR.
From bear market lows, it has delivered as much as 31% annual returns… for 15 years.
- As much as 58X return in 15 years buying LOW when the market hated it most
Lowe’s Investment Decision Score
DK (Source: Dividend Kings Automated Investment Decision Tool)
For anyone comfortable with its risk profile, LOW is as close to God’s own dividend aristocrat, and it’s a very good investment idea today.
- 26% discount vs. 6% market premium = 32% better valuation
- 2.0% yield vs. 1.6% yield (and growing much faster)
- 120% better consensus long-term return potential
- 3X better risk-adjusted expected return over the next five years
- 60% higher 5-year income potential than the S&P 500
Bottom Line: These Are 2 Dividend Growth Blue-Chip Bargains You Won’t Want To Miss
Don’t get me wrong, I watch Bloomberg, and I listen to lots of economics podcasts. I love the big macro; I enjoy seeing the big picture. But here is the bottom line about this recession…it doesn’t matter.
“If you’re not willing to own a stock for 10 years don’t even think about owning it for 10 minutes.” – Warren Buffett
Apple (AAPL), Amazon (AMZN), Altria (MO), Microsoft (MSFT) are four of the best investments in history.
Ycharts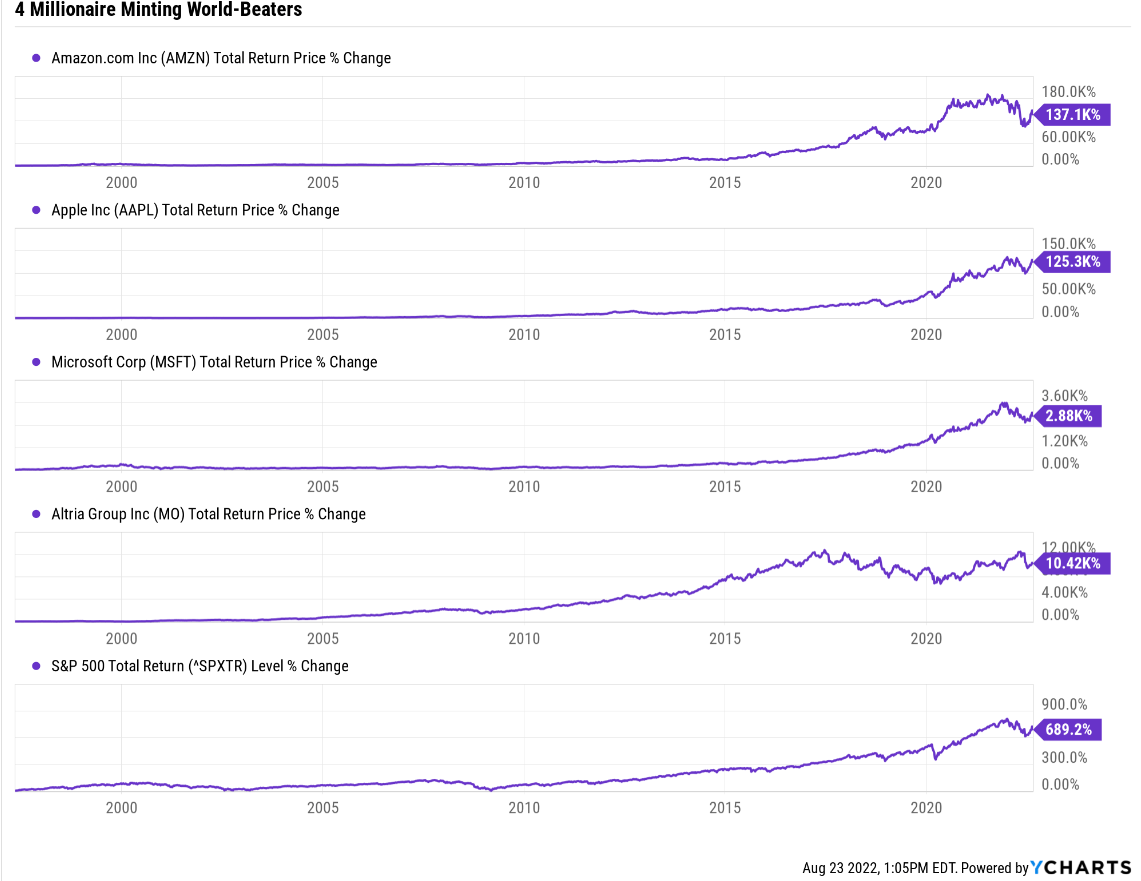
Do you think anyone became a millionaire by day trading these world-beater blue-chips?
Ycharts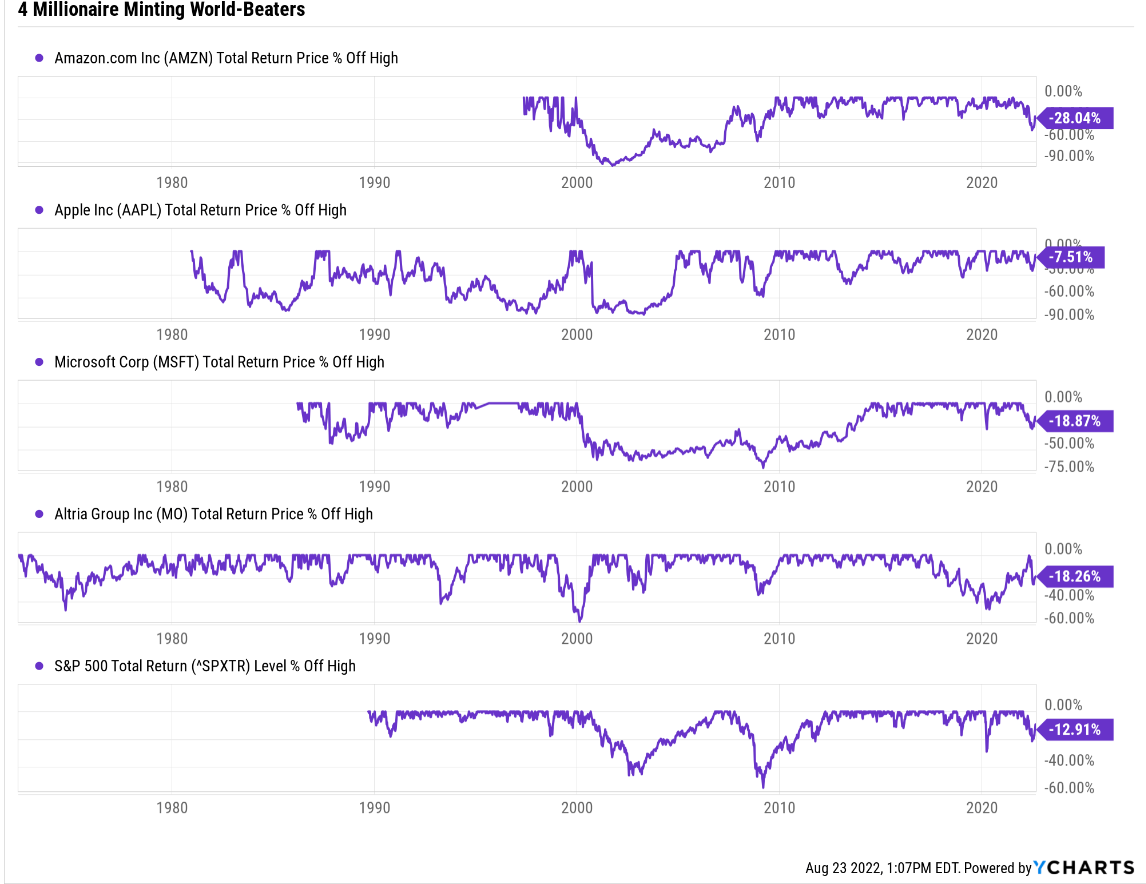
No, they had to endure gut-wrenching crashes and remember one of the most essential truths on Wall Street.
“Fortunes are made by buying right, and holding on.” – Tom Phelps
What if a blue-chip you want to buy drops 10% more? Then by getting lucky and timing the bottom exactly, you’ll earn…11% more.
- 0.2% annually over 30 years
And if you don’t get lucky? Then you miss out on the ability to potentially triple your money…or more in the next five years. Not with speculative meme stocks, crypto, SPACs, or unprofitable companies, but with world-beater blue-chip bargains like TSM and LOW.
Do you know what perfect market timing gets you? Very little, even if it were possible.
Since 1970 had you only bought stocks at the exact bottom every year, you’d have earned 22% more.
Nick Maggiulli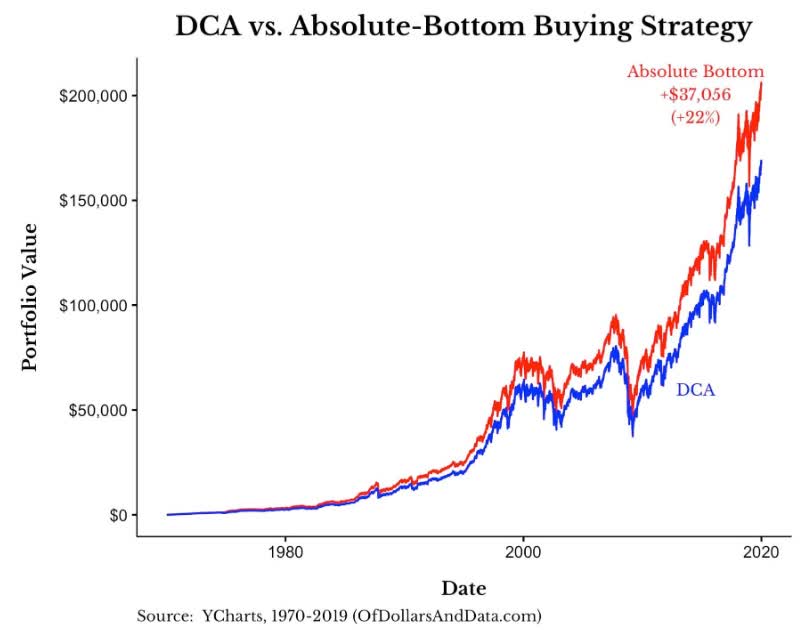
Not 22% per year, but 22% in total, or 0.4% more per year.
Do you know another reason not to try to time the bottom, especially for blue-chip bargains? It’s always and forever a market of stocks, not a stock market.
In December 2008, Altria bottomed at a very potentially safe 15% yield. The market didn’t stop falling until March 9th.
Ycharts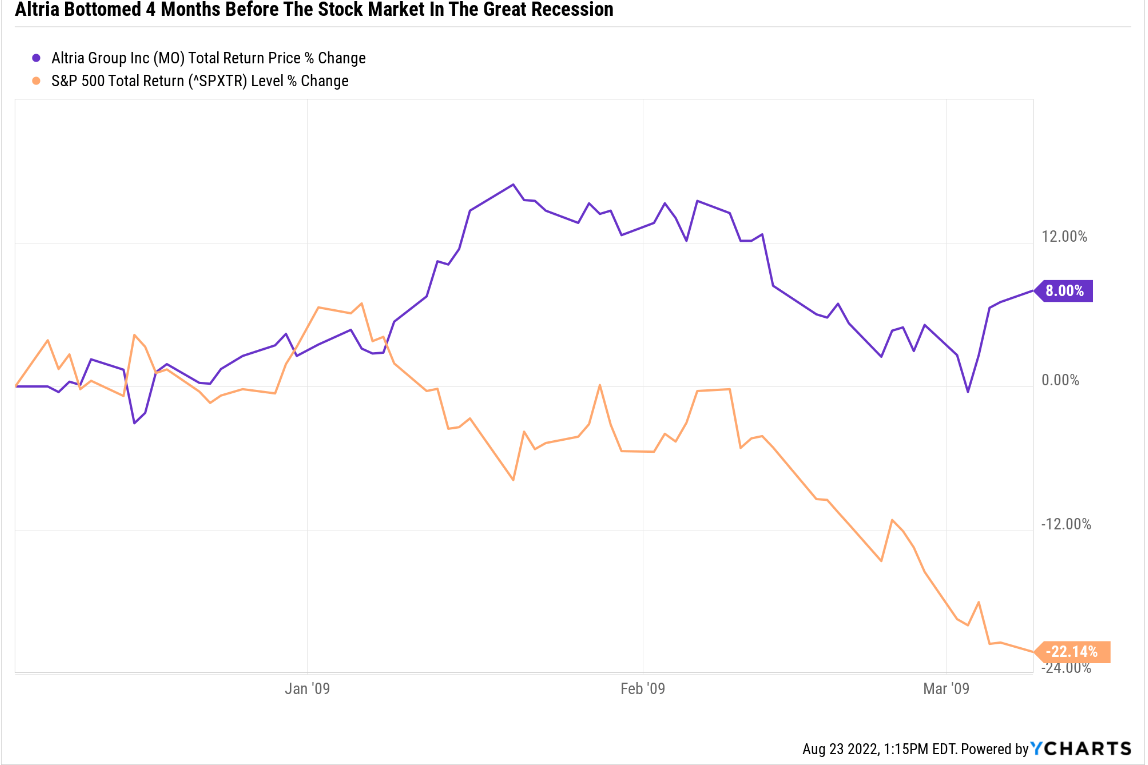
Altria was up 8% while the market was falling another 22%. Do you know what we call those who passed up a possibly very safe 15% yield on MO in later 2008? Greedy.
Do you know what we call those who, like Buffett, didn’t try to time the bottom and bought a wonderful company at a wonderful price? Already retired.
Ycharts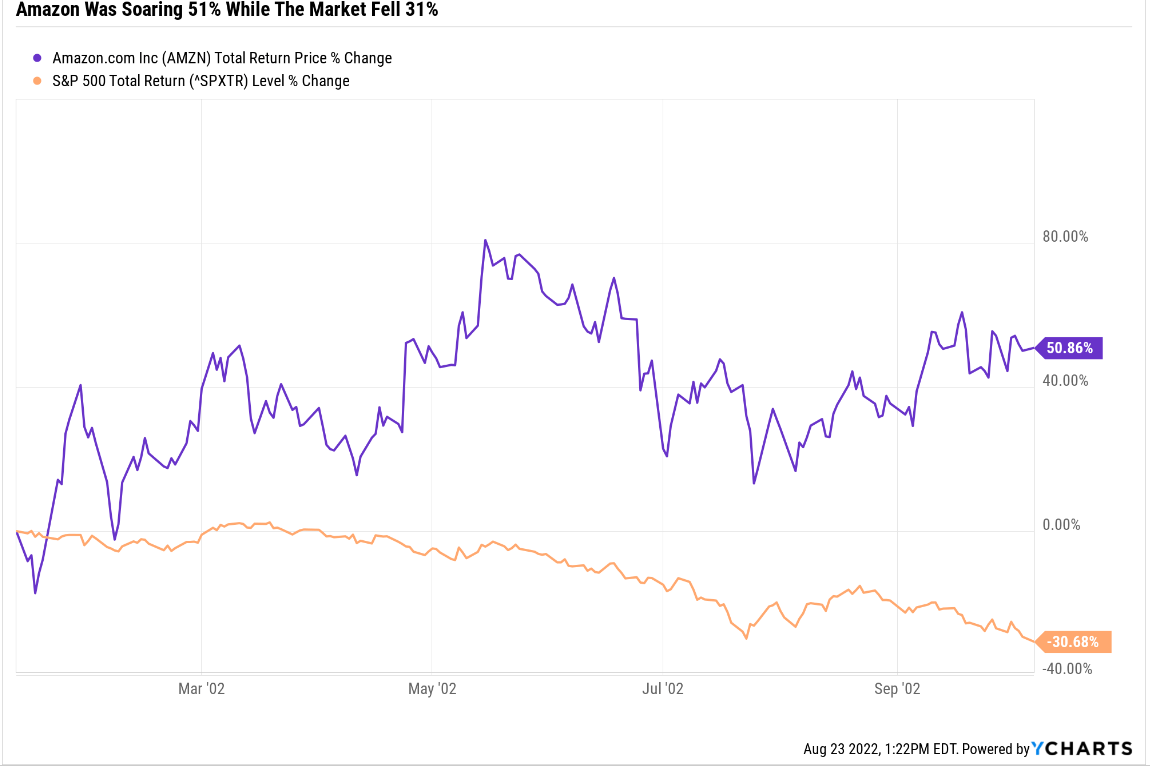
Amazon bottomed in early January 2002 during the Tech crash. The market didn’t bottom until early October.
Do you know what we call those who bought Amazon in every bear market and held on? Really, really rich.
Do you know how many of the greatest investors in history are market timers? None.
There is a reason for that. Because in the short-term, luck is 33X as powerful as fundamentals. But in the long-term, fundamentals are 33X as powerful as luck.
When you buy world-beater blue-chip bargains in a bear market, 10 years later, you feel like a stock market genius who bought the bottom.
And that’s why I’m recommending LOW and TSM today. Not to make you a quick 40% return like analysts expect in the next year. But to earn 10X, 20X, or even 30X returns over decades and change your life.
If you want to earn bragging rights with your cocktail friends? Time the market, get lucky and make a quick 50%.
If you want to retire in safety and splendor, buy world-beater blue-chip bargains like TSM and LOW right now, and don’t worry about what happens with the economy in the next year or two.
Over two to three years, stock returns are luck. Over 20 to 30 years, they are fundamentals-driven destiny.
Be the first to comment