

R&A Studio
September is historically the worst month for stocks, and in the 2022 bear market, bargain hunters aren’t being disappointed.
Ycharts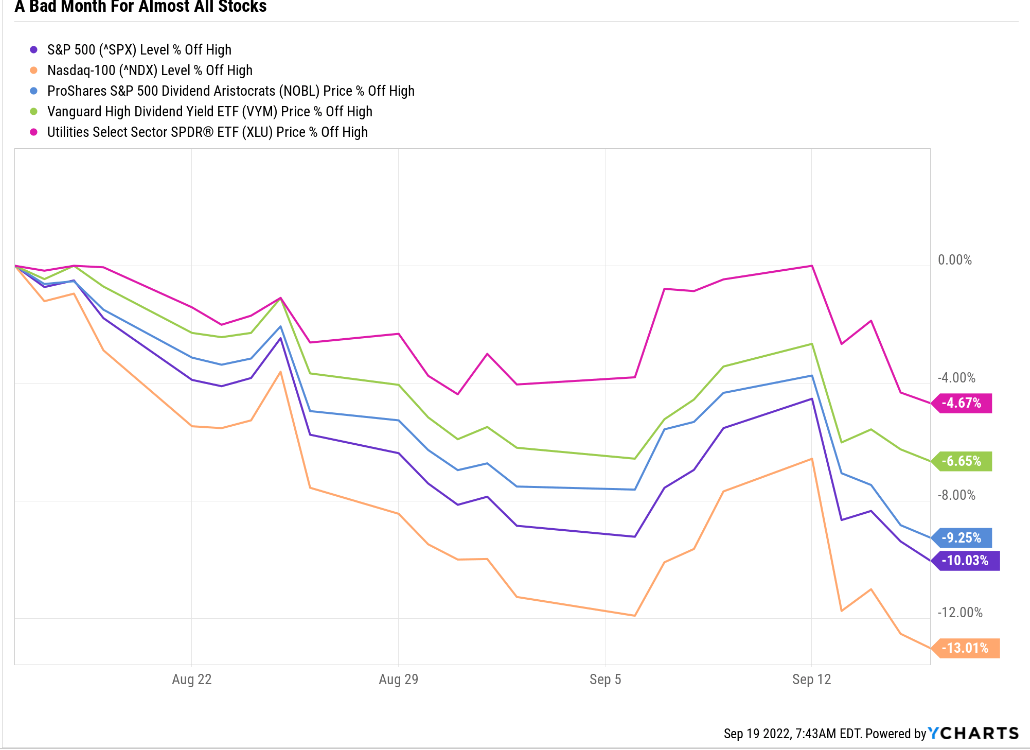
In the last month, the S&P is down 10%, the Nasdaq 13%, but defensive high-yield blue-chips are down just 7%, and defensive sectors like utilities less than 5%.
Now long-time readers of mine will know that I’m a big advocate for blue-chip bargain hunting in a bear market. That’s because history is very clear that while none of us knows when the market will bottom, it will eventually recover.
Market Heaven Follows Market Hells
Charlie Bilello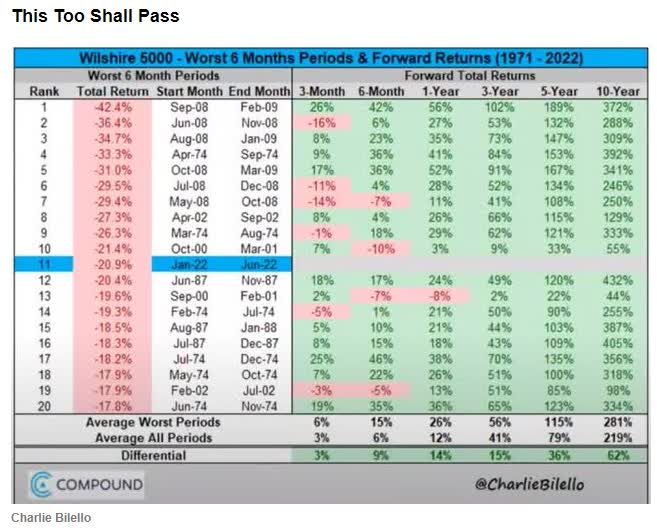
The more severe the sell-off the larger the future gains, including an average 281% 10-year return for stocks following the average 18+% six-month bear market.
But to enjoy those kinds of incredible returns first, you have to survive the bear market, which might have further to fall.
Why Stocks Probably Aren’t Done Falling Yet
For over a decade “don’t fight the Fed” has been the battle cry of the TINA (there is no alternative)/momentum-chasing crowd. Low inflation allowed the Fed to pivot quickly when economic growth was threatened, such as in late 2018, setting us up for a glorious 31% 2019 rally.
And of course, we can’t forget the QE infinity following the Pandemic resulted in the greatest year for stocks in history, a 100% rally off the March 23rd, 2020 lows.
But that was in a low inflation world, a mirror image of the high inflation world we now find ourselves in.
CME Group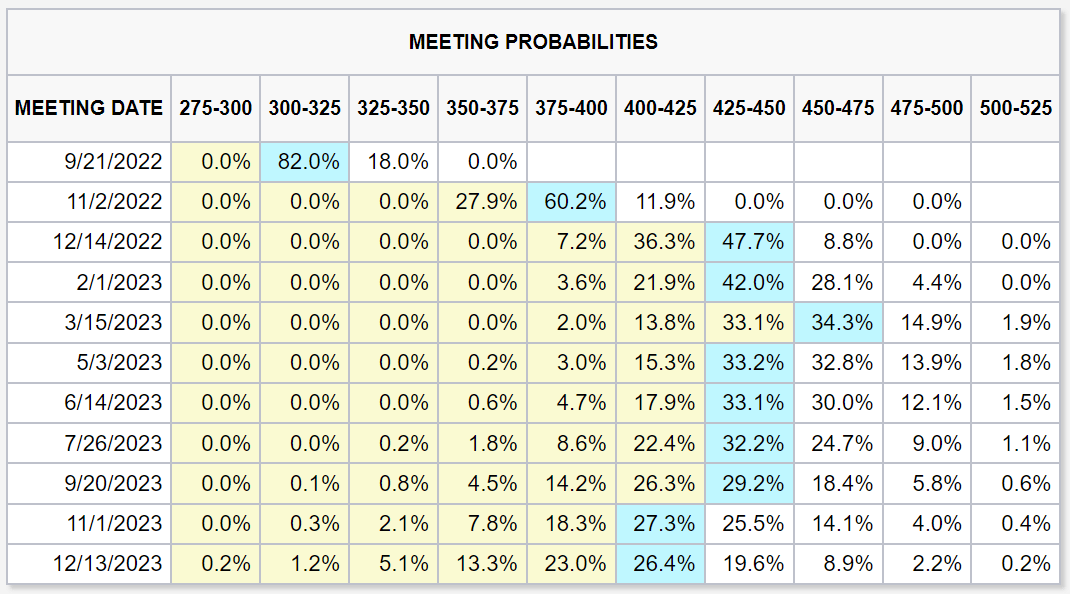
The hottest inflation in 41 years and a Volker-style Fed have the bond market expecting:
- a 0.75% hike in September
- a 0.75% hike in November
- a 0.5% hike in December
- a 4.5% terminal Fed funds rate
Daily Shot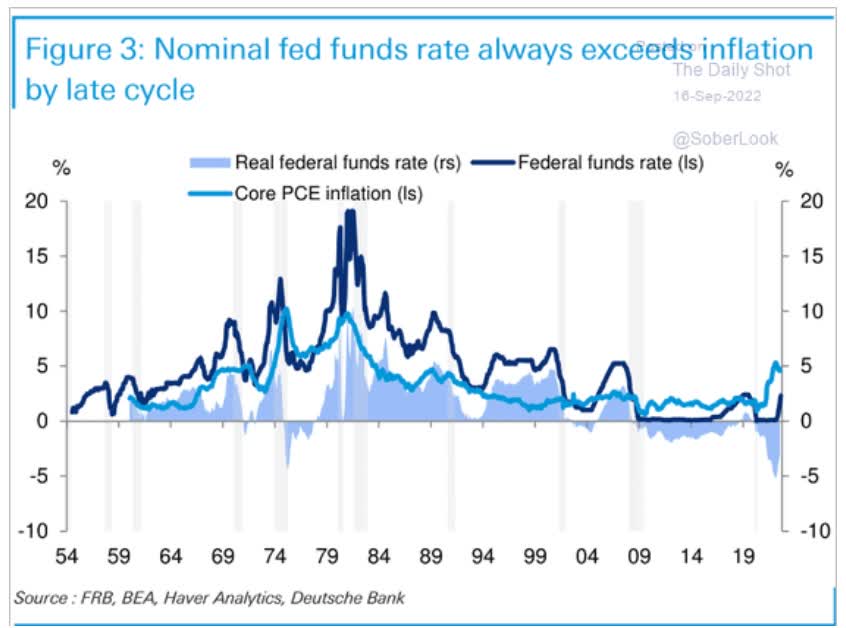
Since 1954 the Fed has never stopped hiking until the Fed funds rate was above core PCE, its official inflation metric.
Cleveland Federal Reserve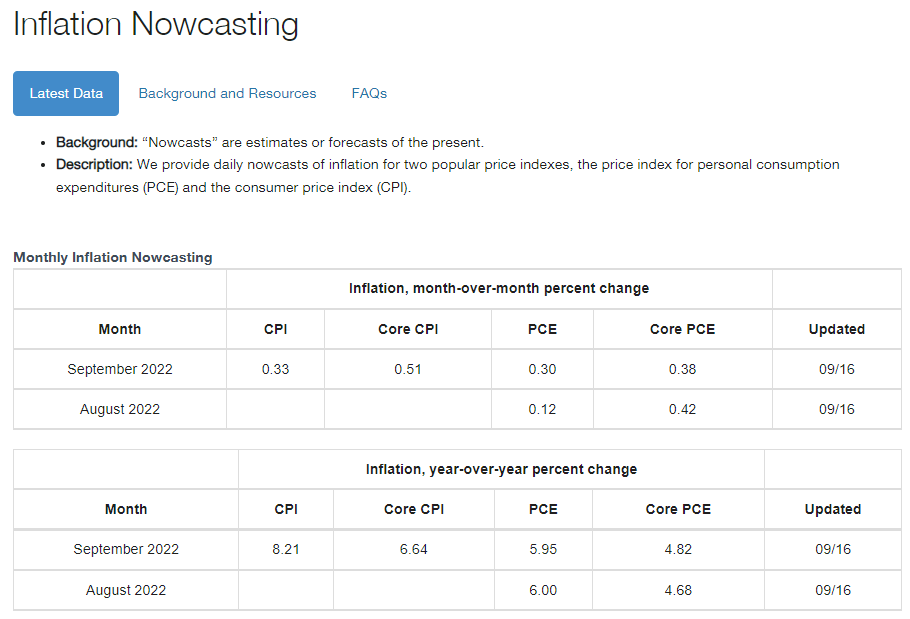
According to the Cleveland Fed’s inflation model, in September’s PCE report (for August) core PCE is expected to come in at 4.7%. Next month it’s expected to come in at 4.8%.
- 5.2% peak in March
- 4.6% last month
- 4.7% this month
- 4.8% next month
It doesn’t take a math genius to see that core inflation is moving in the wrong direction. Why?
Daily Shot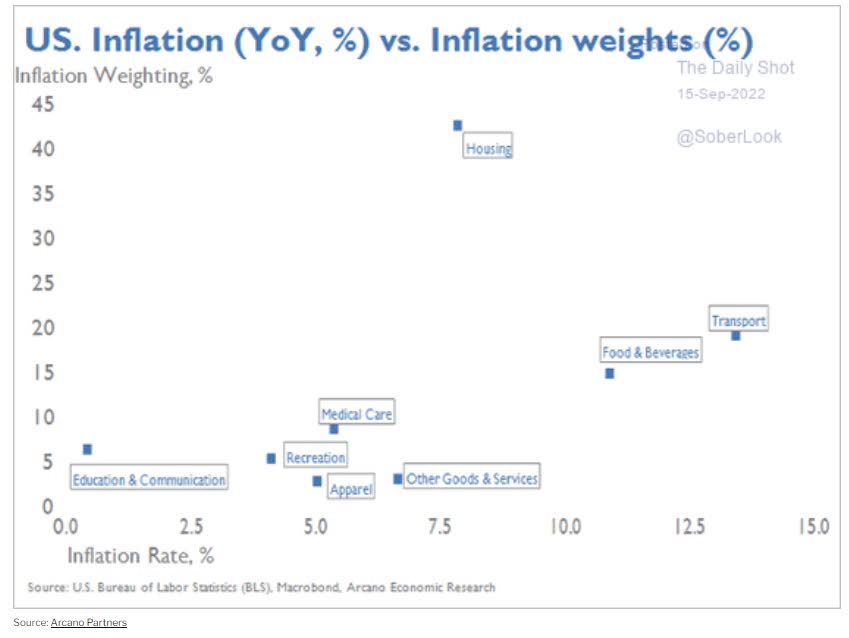
Because the largest component of core inflation, about 33%, is housing, and how the government measures housing inflation involves a six-month lag to actual rental or housing prices.
Daily Shot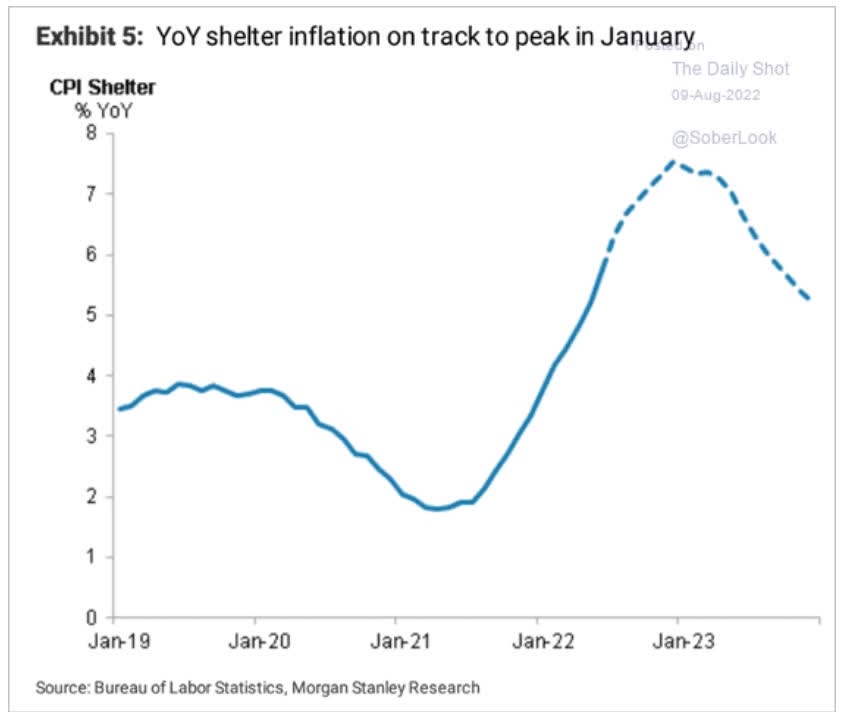
According to Morgan Stanley, US housing inflation will likely peak in January.
- Housing inflation peaked in Spring or summer, depending on the source
Moody’s, the 2nd most accurate economist according to Bloomberg, agrees, thinking January to March will see a peak in both housing inflation and core inflation.
What does that potentially mean?
- core inflation might keep rising (or at least not fall) through January to March
- the February to April inflation reports
This sticky core inflation is why Deutsche Bank (another blue-chip economist team, along with Morgan Stanley and Moody’s) thinks the Fed might hike all the way to 5% by May 2023.
- in order to get the Fed funds rate above core PCE
This is in-line with Minneapolis Fed President Kashakari who for six months has been saying the Fed will have to hike to 4% to 5% and then keep rates that high for 12 to 24 months.
The good news is that stocks aren’t likely to keep falling due to rising rates this entire time.
The bad news is that slowing economic growth and earnings growth will give stocks a new reason to fall.
Daily Shot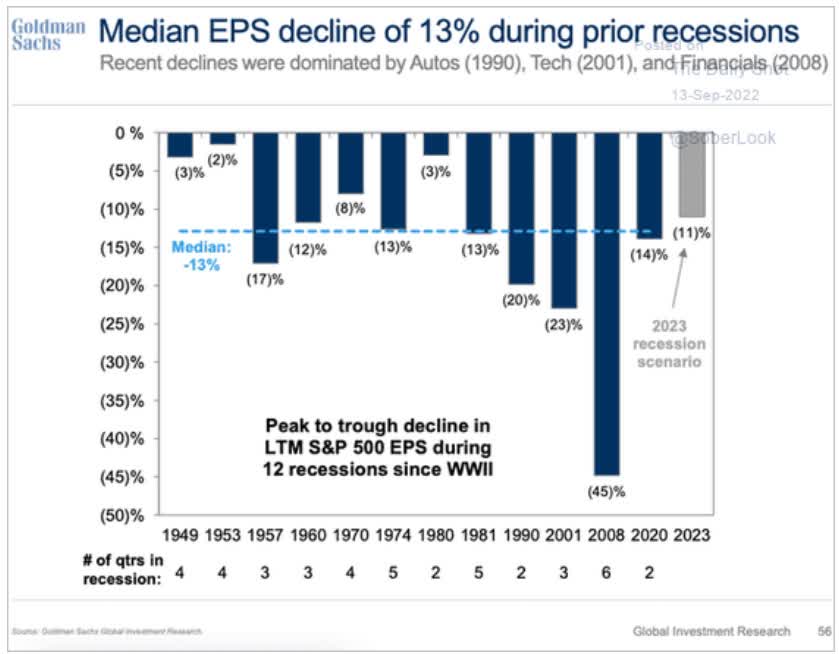
Goldman Sachs (another blue-chip economist team) thinks EPS next year will fall 11%; thus, stocks won’t likely bottom until -35% from record highs.
- 19% lower than we are now
A 35% peak decline for stocks would be 100% historically normal for recessionary bear markets.
Don’t Panic: There Is Good News
I know the idea of stocks falling another 20% or so might seem terrifying, a true market hell. Especially if bonds keep falling too, creating more pain for balanced portfolios (like a 60/40).
The good news is that the blue-chip economist consensus thinks long-term yields are close to peaking.
- 3.5% to 3.6% is the consensus for peak 10-year yields
- the upper end of the range (from Bank of America) is 4%
This means that while stocks might potentially have 20% more to fall, bonds are likely to start acting defensively soon.
As soon as recession overtakes inflation fears, blue-chip economists like Deutsche Bank and HSBC think that 10-year yields will start falling.
- bottoming at 1% to 2% during the recession
- a 1.5% to 2.5% drop from current levels
- 10% to 18% rally for bonds in general
- 37% to 70% rally for long bonds
While a 60/40 isn’t going to go up in a 20% bear market, it will also fall a lot less than the market, and those hedging with long bonds could see a very smooth ride down.
Defensive High-Yield/Low Volatility Blue-Chips: Your Port In The Bear Market Storm
Another option for those sweating the recent market declines is defensive high-yield blue-chips.
- recession-resistant business models
- inflation-resistant business models
- historically low volatility
Dividend Kings Zen Research Terminal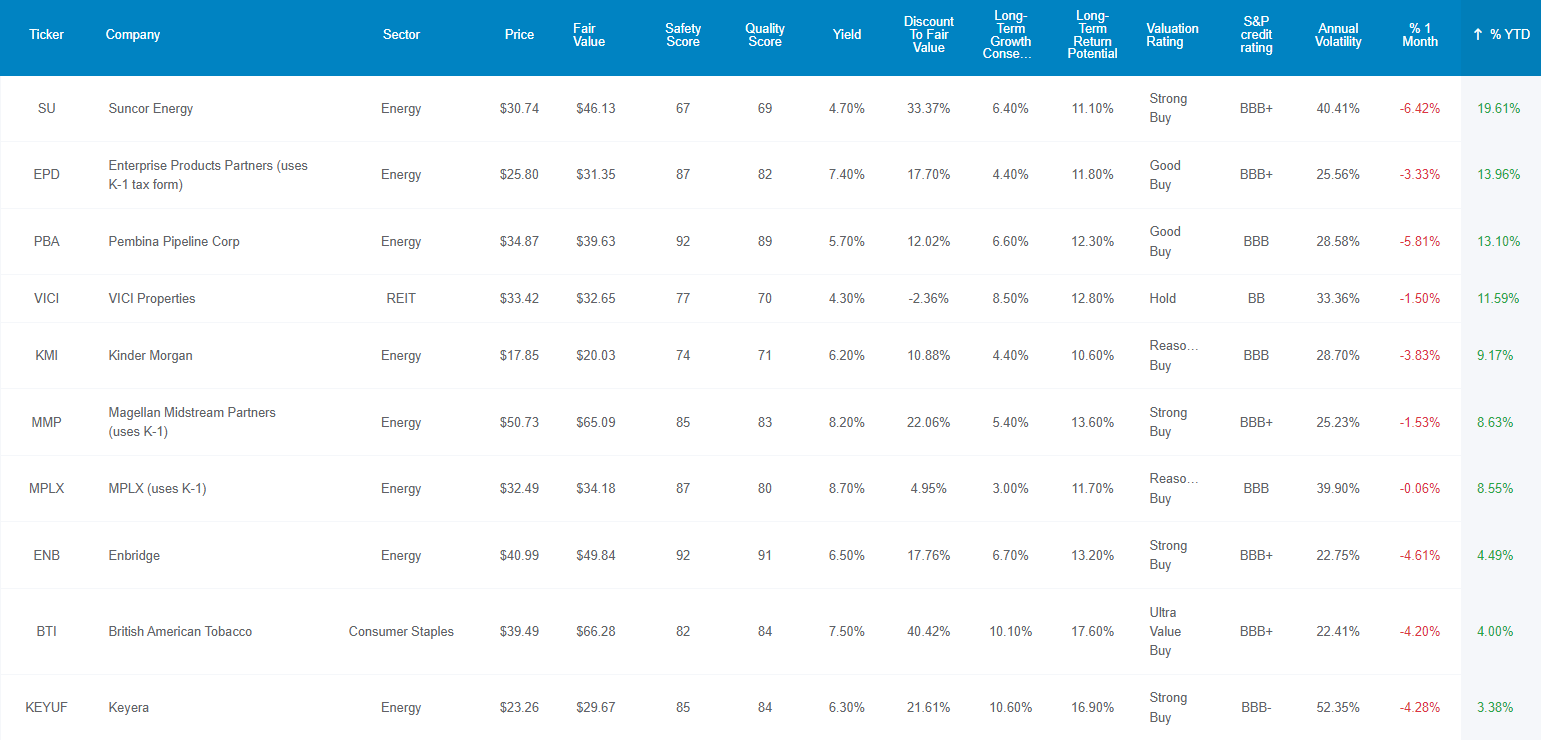
You can sort and screen the Dividend Kings Zen Research Terminal not just by fundamental metrics like safety, quality, yield, and volatility but also by daily, monthly, and year-to-date returns.
This is how you can easily find high-yield, low volatility blue-chips that are acting defensively in the last month and during the entire bear market.
For context:
- 28% is the average annual volatility of standalone companies
- 24% is the average annual volatility of dividend aristocrats
So let me show you why British American Tobacco (BTI), and Novartis (NVS), are two high-yield low volatility bear market blue-chip bargains that might be just what you need right now.
Let me show you why BTI and NVS might be just what you need to ride out this bear market in safety and relative comfort while delivering solid market-beating returns for years or even decades to come.
British American Tobacco: The Growth King Of Tobacco Is Firing On All Cylinders
Further Reading
- 7% Yielding British American Tobacco Is The Perfect Bear Market Buy
- full deep dive look at the growth outlook, risk profile, valuation, and return potential
Investment Thesis
Back in 2017, BTI was 50% historically overvalued (just like the S&P was in March 2000).
It was priced as if nothing scary would ever happen again, but we know what came next.
- BTI bought the rest of Reynold’s in $49 billion debt-funded deal
- pushing up leverage above rating agency safety guidelines
- spooking investors
- the EU banned menthol
But guess what? From 50% overvalued in mid-2017, BTI became 50% undervalued just a year later.
BTI earnings presentation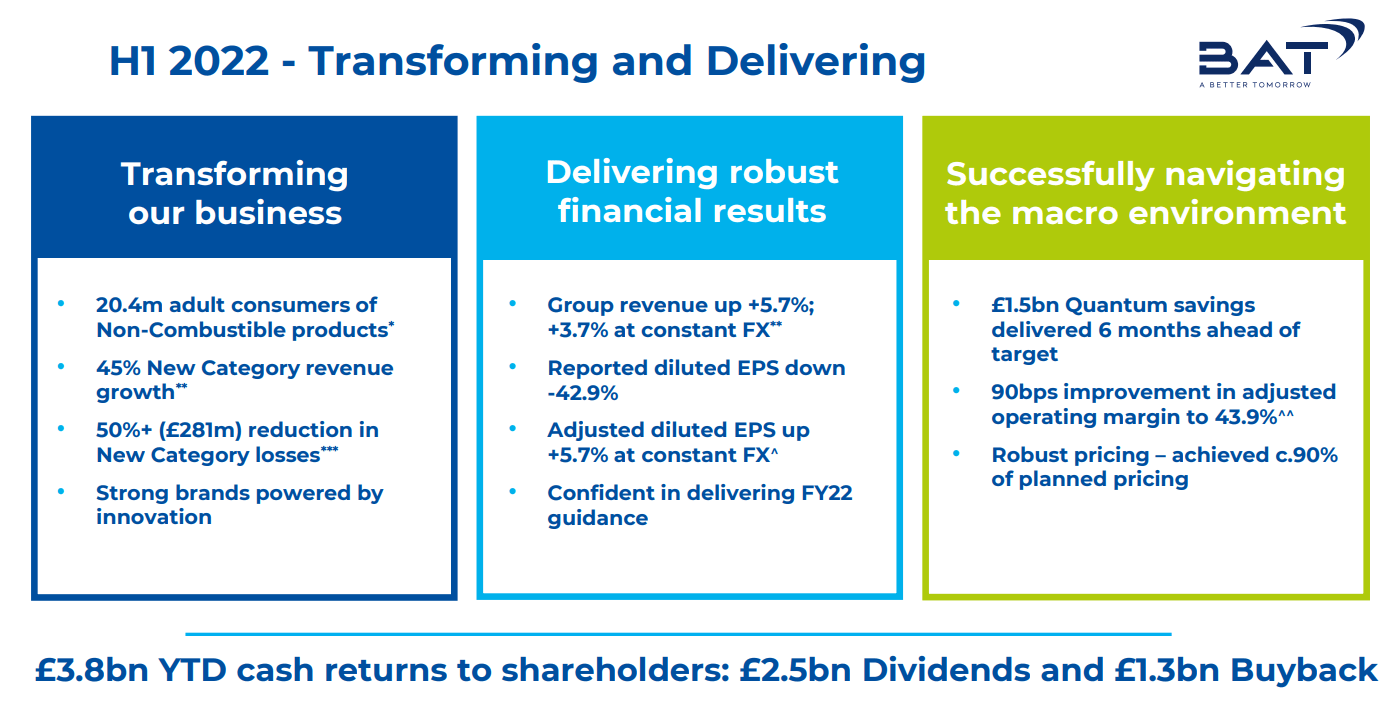
De-leveraging is now complete, and BTI has resumed buybacks at some of the best valuations in 20 years.
More importantly, BTI’s plans for a 100% tobacco-free future is going exceptionally well.
Reduced-risk products like vaping, heat-sticks, and oral nicotine pouches, are growing at 50%.
BTI also has 13 private equity investments in cannabis companies because it plans to sell only reduced-risk nicotine and cannabis in the future.
Reasons To Potentially Buy British American Tobacco Today
| Metric | British American Tobacco |
| Quality | 84% 13/13 Ultra SWAN (Sleep Well At Night) Global Aristocrat |
| Risk Rating | Low Risk |
| DK Master List Quality Ranking (Out Of 500 Companies) | 165 |
| Quality Percentile | 67% |
| Dividend Growth Streak (Years) | 23+ |
| Dividend Yield | 7.5% |
| Dividend Safety Score | 82% Very Safe |
| Average Recession Dividend Cut Risk | 0.5% |
| Severe Recession Dividend Cut Risk | 1.85% |
| S&P Credit Rating |
BBB+ Negative Outlook |
| 30-Year Bankruptcy Risk | 5.00% |
| Consensus LT Risk-Management Industry Percentile | 72% Good |
| Fair Value | $66.11 |
| Current Price | $39.49 |
| Discount To Fair Value | 40% |
| DK Rating |
Potentially Ultra Value Buy |
| PE | 9.0 |
| Cash-Adjusted PE | 8.4, anti-bubble blue-chip |
| Growth Priced In | -0.2% |
| Historical PE Range | 13 to 14 |
| LT Growth Consensus/Management Guidance | 10.2% |
| PEG Ratio | 0.82 |
| 5-year consensus total return potential |
21% to 26% CAGR |
| Base Case 5-year consensus return potential |
21% CAGR (4X better than the S&P 500) |
| Consensus 12-month total return forecast | 45% |
| Fundamentally Justified 12-Month Return Potential | 75% |
| LT Consensus Total Return Potential | 17.7% |
| Inflation-Adjusted Consensus LT Return Potential | 15.5% |
| Consensus 10-Year Inflation-Adjusted Total Return Potential (Ignoring Valuation) | 4.22 |
| LT Risk-Adjusted Expected Return | 11.77% |
| LT Risk-And Inflation-Adjusted Return Potential | 9.55% |
| Conservative Years To Double | 7.54 |
(Source: Dividend Kings Zen Research Terminal)
BTI is trading at 8.4X cash-adjusted earnings, an anti-bubble valuation pricing in -0.2% growth. That’s compared to management’s guidance of 7% to 9% CAGR and the median consensus of 10.2% CAGR.
- the growth consensus has been rising for the last year
British American 2024 Consensus Return Potential
(Source: FAST Graphs, FactSet)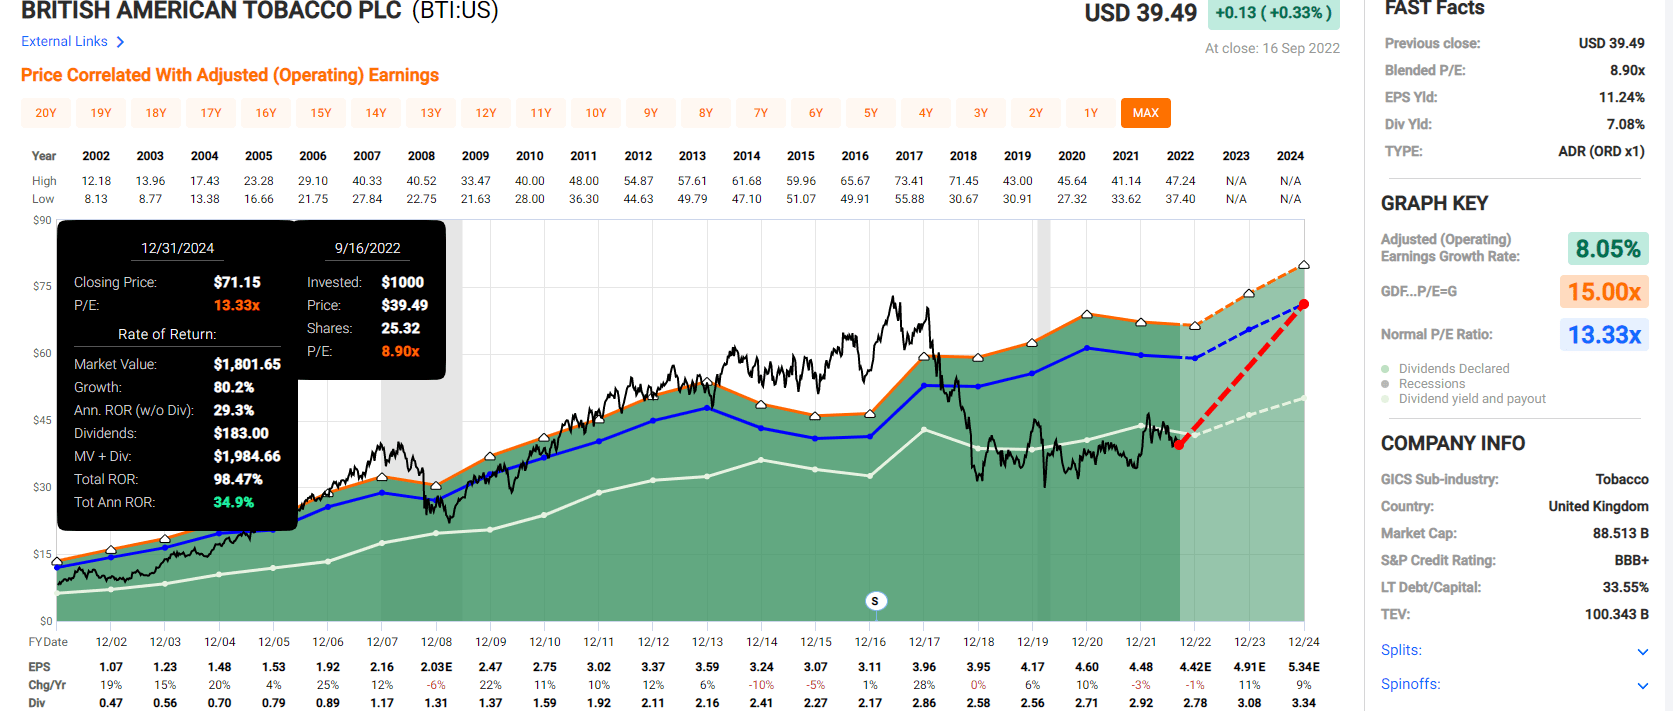
British American 2027 Consensus Return Potential
(Source: FAST Graphs, FactSet)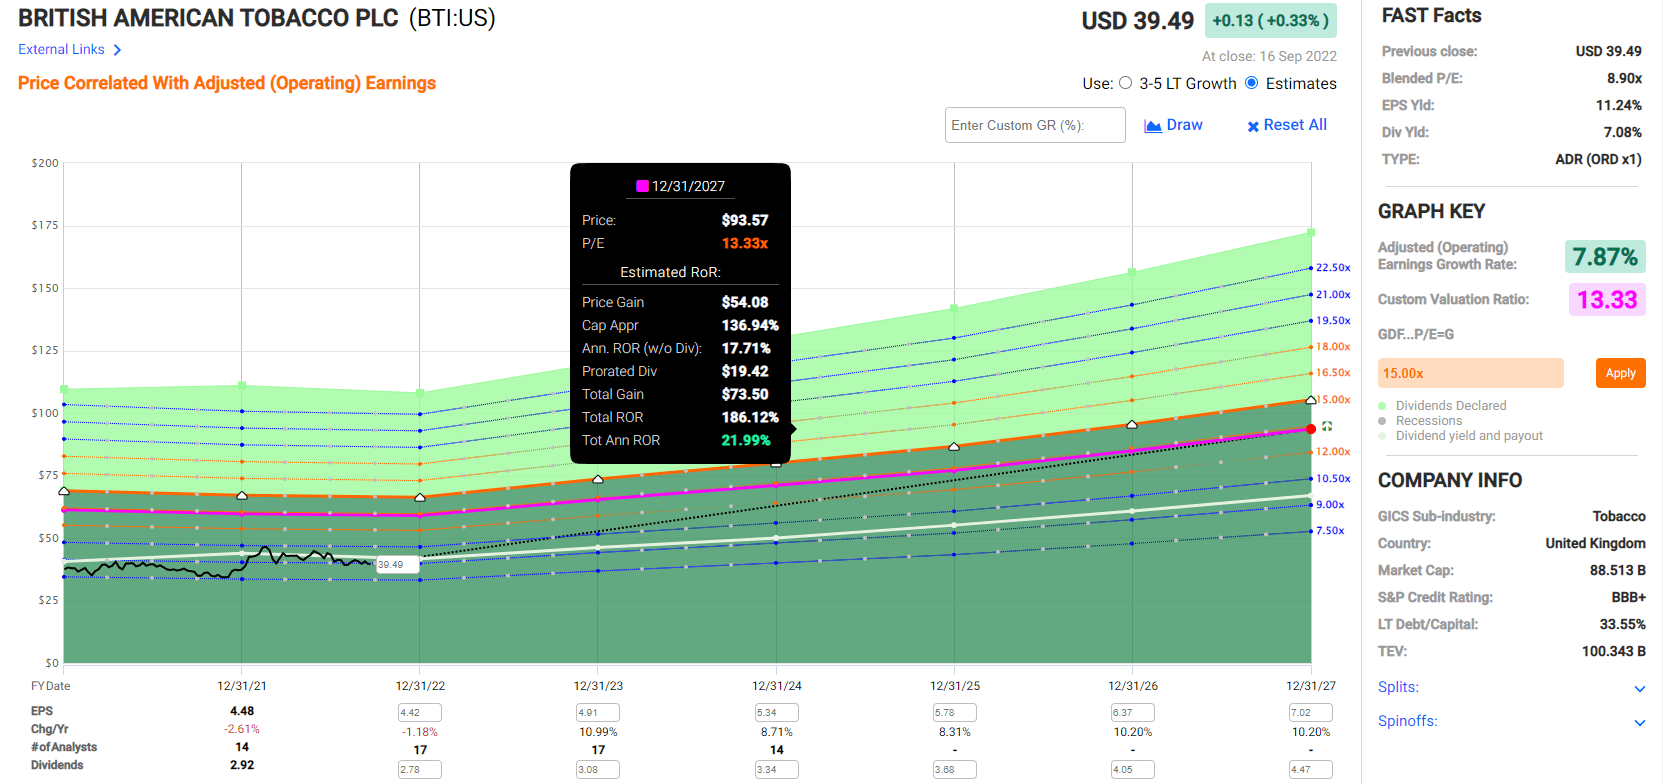
If BTI grows as expected and returns to historical fair value, it could double by 2024 and nearly triple by 2027.
Now compare that to the S&P 500 consensus.
S&P 500 2024 Consensus Total Return Potential
(Source: FAST Graphs, FactSet)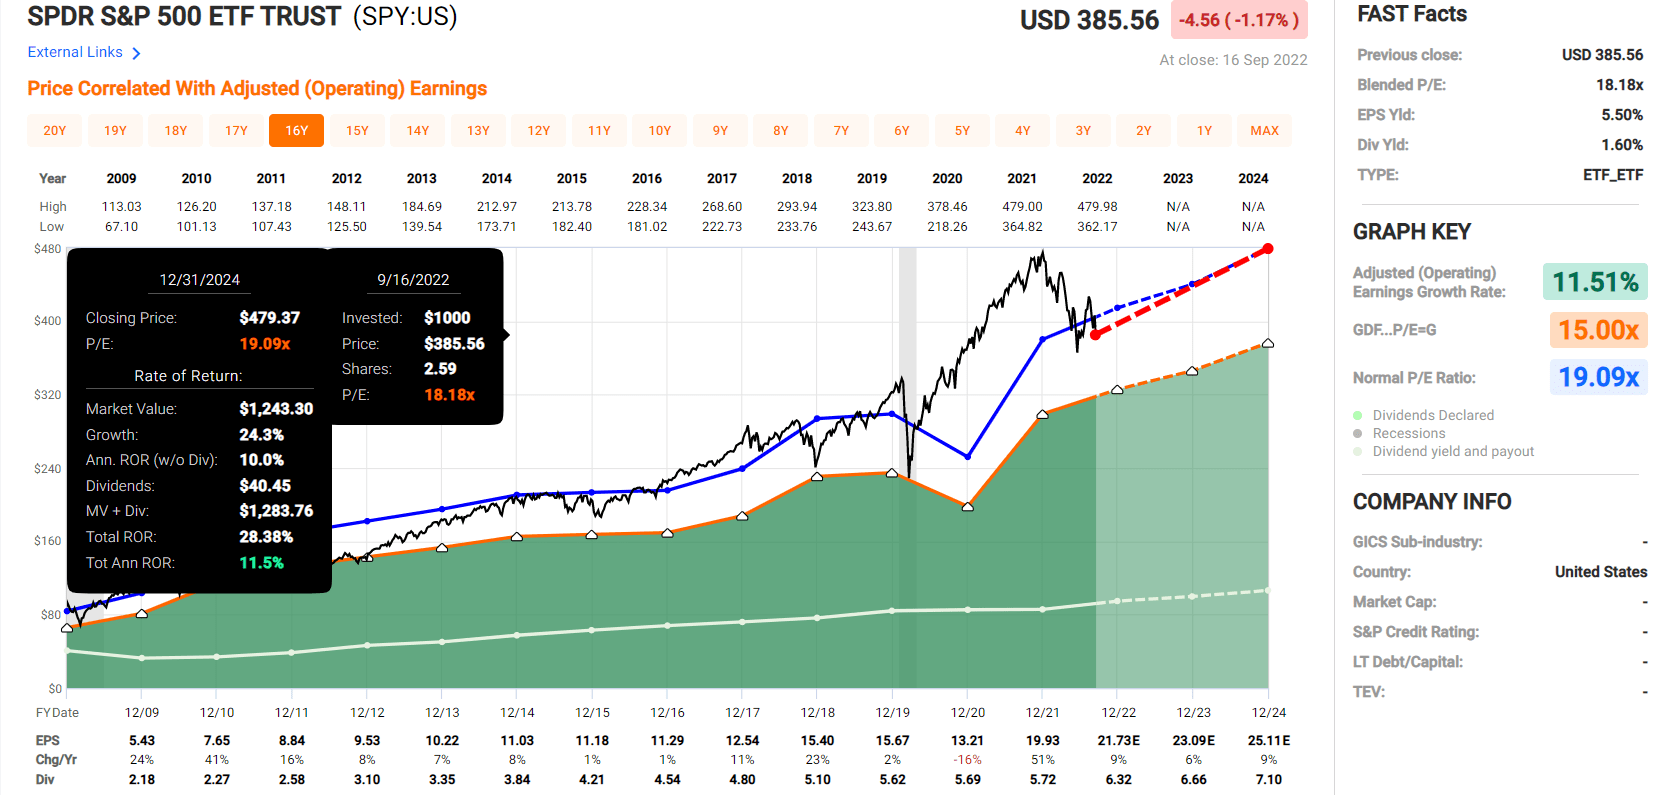
S&P 500 2027 Consensus Total Return Potential
| Year | Upside Potential By End of That Year | Consensus CAGR Return Potential By End of That Year | Probability-Weighted Return (Annualized) |
Inflation And Risk-Adjusted Expected Returns |
| 2027 | 56.71% | 9.29% | 6.97% | 4.64% |
(Source: DK S&P 500 Valuation & Total Return Tool)
Over the next five years, analysts expect 9% annual returns from the S&P 500.
- BTI has almost 4X higher consensus total return potential than the S&P 500 over the next five years
Analysts think BTI will deliver 45% total returns in the next year, and its fundamentals justify up to a 75% gain.
| Investment Strategy | Yield | LT Consensus Growth | LT Consensus Total Return Potential | Long-Term Risk-Adjusted Expected Return | Long-Term Inflation And Risk-Adjusted Expected Returns | Years To Double Your Inflation & Risk-Adjusted Wealth |
10-Year Inflation And Risk-Adjusted Expected Return |
| British American Tobacco | 7.5% | 10.2% | 17.7% | 12.4% | 10.1% | 7.1 | 2.62 |
| High-Yield (SCHD) | 3.4% | 8.7% | 12.1% | 8.5% | 6.2% | 11.7 | 1.82 |
| Dividend Aristocrats | 2.4% | 8.6% | 11.0% | 7.7% | 5.4% | 13.4 | 1.69 |
| S&P 500 | 1.7% | 8.5% | 10.2% | 7.1% | 4.9% | 14.8 | 1.61 |
| Nasdaq | 0.9% | 11.8% | 12.7% | 8.9% | 6.6% | 10.9 | 1.89 |
(Source: Dividend Kings Research Terminal, Morningstar, FactSet, Ycharts)
Analysts now think BTI could deliver almost 18% CAGR Buffett-like returns, not just for a few years, but potentially for decades to come.
British American Rolling Returns Since May 1985
Portfolio Visualizer Premium
That’s similar to BTI’s average annual return over the last 37 years. Management’s 15.5% CAGR total return guidance is similar to the average 15-year return over the last four decades.
Inflation-adjusted Consensus Total Return Potential: $1,000 Initial Investment
| Time Frame (Years) | 7.9% CAGR Inflation-Adjusted S&P 500 Consensus | 8.7% Inflation-Adjusted Dividend Aristocrats Consensus | 15.4% CAGR Inflation-Adjusted BTI Consensus | Difference Between Inflation-Adjusted BTI Consensus And S&P Consensus |
| 5 | $1,461.18 | $1,516.17 | $2,047.47 | $586.29 |
| 10 | $2,135.06 | $2,298.77 | $4,192.13 | $2,057.07 |
| 15 | $3,119.71 | $3,485.33 | $8,583.25 | $5,463.54 |
| 20 | $4,558.47 | $5,284.36 | $17,573.93 | $13,015.46 |
| 25 | $6,660.75 | $8,012.00 | $35,982.06 | $29,321.31 |
| 30 | $9,732.58 | $12,147.56 | $73,672.13 | $63,939.55 |
(Source: DK Research Terminal, FactSet)
Even if BTI never regains its historical 13 to 14 PE ratio, as long as it grows as expected, investors could earn life-changing income and wealth.
| Time Frame (Years) | Ratio BTI Consensus/Aristocrat Consensus | Ratio Inflation And Inflation-Adjusted BTI Consensus vs. S&P consensus |
| 5 | 1.35 | 1.40 |
| 10 | 1.82 | 1.96 |
| 15 | 2.46 | 2.75 |
| 20 | 3.33 | 3.86 |
| 25 | 4.49 | 5.40 |
| 30 | 6.06 | 7.57 |
(Source: DK Research Terminal, FactSet)
How does 6X the aristocrat’s returns and almost 8X more than the S&P 500 strike you? From today’s 40% discount to fair value, that’s what analysts think BTI potentially offers.
British American Tobacco Investment Decision Score
DK (Source: Dividend Kings Automated Investment Decision Tool)

BTI is one of the best defensive ultra-high-yield options for anyone comfortable with its risk profile.
- 40% discount vs. 3% market discount = 37% better valuation
- very safe 7.5% yield (global aristocrat) = 4.5X higher than S&P 500
- 75% better long-term annual return potential
- almost 2.5X better risk-adjusted expected return over the next five years
- 4X higher 5-year consensus income
Novartis: One Of The World’s Best Drug Makers Is A Great High-Yield Recession Choice
Further Reading
- Novartis Is One Of The Best High-Yield Dividend Aristocrats You Can Buy In 2022
- full deep dive look at the growth outlook, risk profile, valuation, and return potential
- Swiss company: 15% dividend tax withholdings (requires filing paperwork with your broker or else its 35%0
- own in a taxable account to qualify for the tax credit and recoup the withholding
Investment Thesis
With strong positions in multiple key therapeutic areas, Novartis is well positioned for steady long-term growth. Strong intellectual property supporting multibillion-dollar products, combined with an abundance of late-pipeline products, creates a wide economic moat…
Novartis differentiates itself by its sheer number of blockbusters, including Entresto for heart failure and Cosentyx for immunology diseases. Also, it has generated a strong late-stage pipeline with recent launches of migraine drug Aimovig and cancer drug Kisqali. – Morningstar
NVS has a proven track record of risk management and bringing blockbusters to market. It operates in almost 200 countries and knows how to deal with national health systems and regulatory regimes of all kinds.
- NVS’s long-term risk management consensus is 93rd industry percentile
- in the top 1% of the world’s best blue-chips
- 2nd best risk management on the Dividend Kings 500 Master list
NVS isn’t a growth dynamo like Merck (MRK), but analysts do think it will grow more than 50% faster than the pharma industry over time, on par with such Ultra SWAN Pharmas as Amgen (AMGN) and about 1% faster than JNJ (5.4% growth consensus).
Reasons To Potentially Buy Novartis Today
| Metric | Novartis |
| Quality | 97% 13/13 Ultra SWAN (Sleep Well At Night) Global Aristocrat |
| Risk Rating | Very Low Risk |
| DK Master List Quality Ranking (Out Of 500 Companies) | 16 |
| Quality Percentile | 97% |
| Dividend Growth Streak (Years) | 25 |
| Dividend Yield | 4.2% |
| Dividend Safety Score | 82% Very Safe |
| Average Recession Dividend Cut Risk | 0.5% |
| Severe Recession Dividend Cut Risk | 1.00% |
| S&P Credit Rating |
AA- Stable Outlook |
| 30-Year Bankruptcy Risk | 0.56% |
| Consensus LT Risk-Management Industry Percentile |
93% Exceptional |
| Fair Value | $106.86 |
| Current Price | $80.06 |
| Discount To Fair Value | 25% |
| DK Rating |
Potentially Very Strong Buy |
| PE | 13.2 |
| Cash-Adjusted PE | 11.2 |
| Growth Priced In | 5.3% |
| Historical PE Range | 15 to 17 |
| LT Growth Consensus/Management Guidance | 6.3% |
| PEG Ratio | 1.76 |
| 5-year consensus total return potential |
14% to 19% CAGR |
| Base Case 5-year consensus return potential |
14% CAGR (2X better than the S&P 500) |
| Consensus 12-month total return forecast | 20% |
| Fundamentally Justified 12-Month Return Potential | 38% |
| LT Consensus Total Return Potential | 10.5% Vs. S&P 500 10.2% |
| Inflation-Adjusted Consensus LT Return Potential | 8.3% |
| Consensus 10-Year Inflation-Adjusted Total Return Potential (Ignoring Valuation) | 2.22 |
| LT Risk-Adjusted Expected Return | 7.31% |
| LT Risk-And Inflation-Adjusted Return Potential | 5.09% |
| Conservative Years To Double | 14.15 |
(Source: Dividend Kings Zen Research Terminal)
Novartis 2024 Consensus Total Return Potential
(Source: FAST Graphs, FactSet)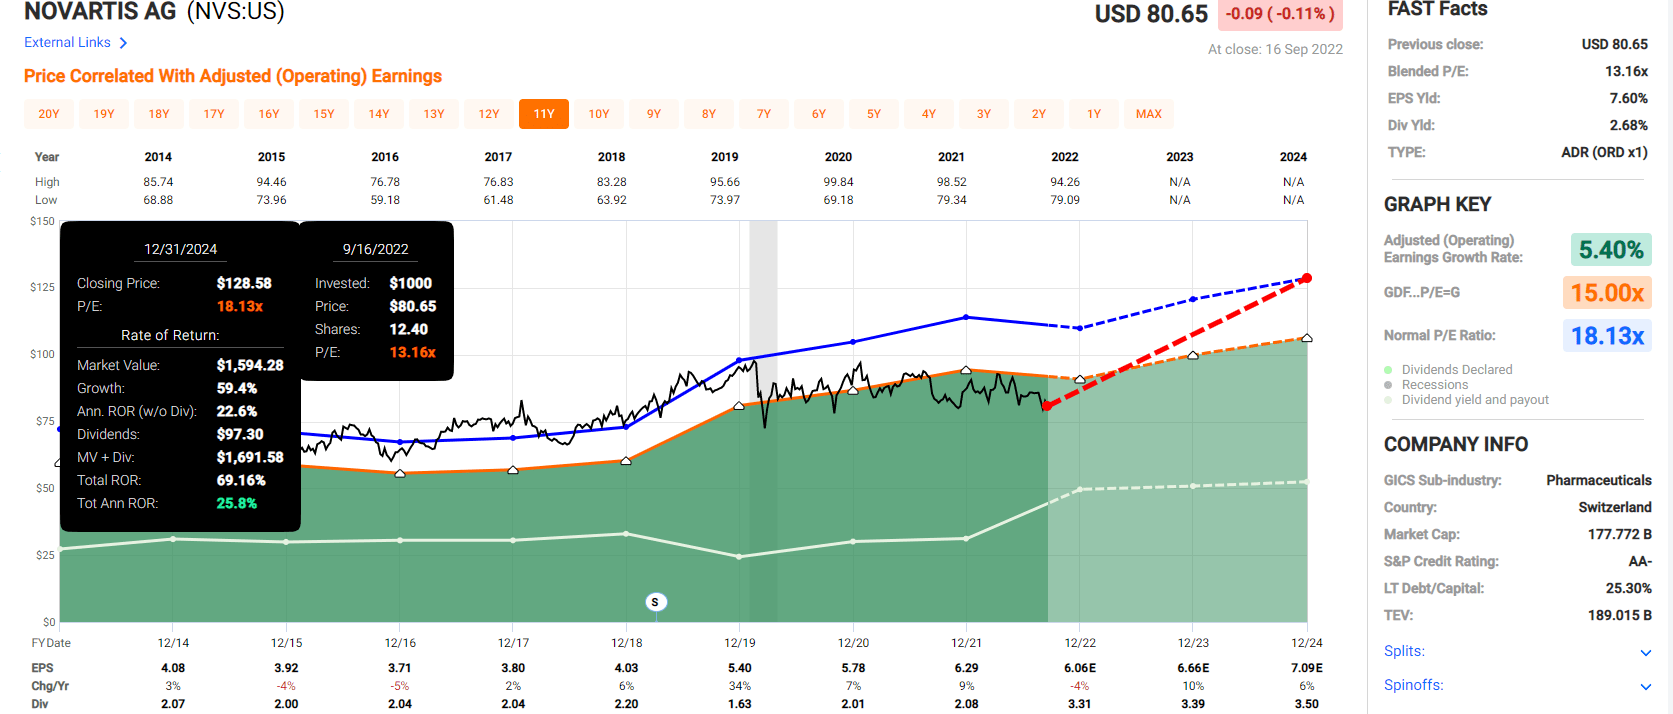
Novartis 2027 Consensus Total Return Potential
(Source: FAST Graphs, FactSet)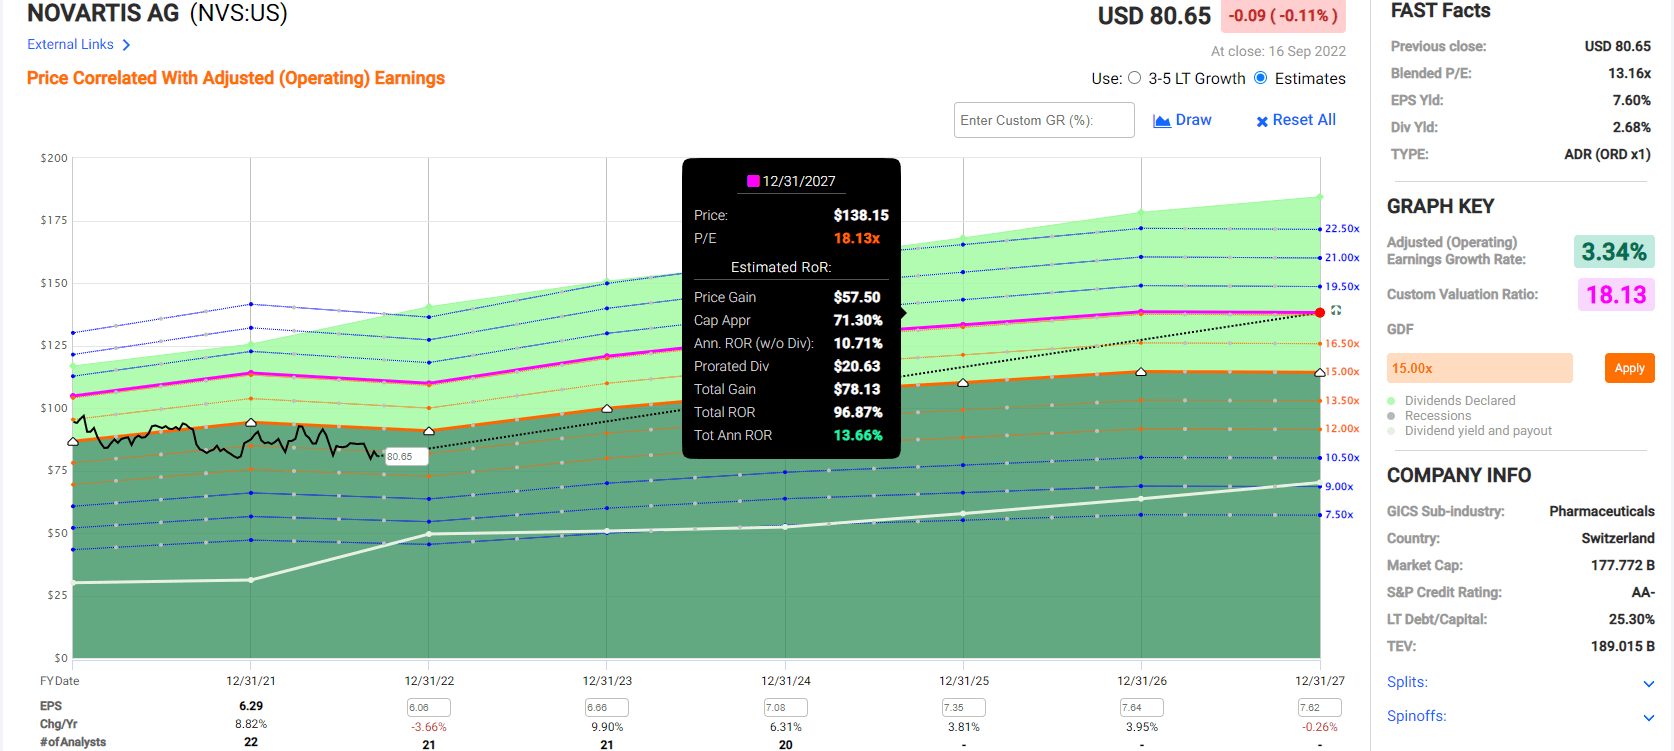
If NVS grows as expected and returns to historical fair value, it could double in the next five years.
- 2X the consensus return potential of the S&P 500
In the next year alone, analysts expect a 20% gain from NVS though at a 25% historical discount, just 11X cash-adjusted earnings, NVS’s fundamentals justify up to a 38% gain.
| Investment Strategy | Yield | LT Consensus Growth | LT Consensus Total Return Potential | Long-Term Risk-Adjusted Expected Return | Long-Term Inflation And Risk-Adjusted Expected Returns | Years To Double Your Inflation & Risk-Adjusted Wealth |
10-Year Inflation And Risk-Adjusted Expected Return |
| Novartis | 4.2% | 6.3% | 10.5% | 7.4% | 5.1% | 14.2 | 1.64 |
| High-Yield (SCHD) | 3.4% | 8.7% | 12.1% | 8.5% | 6.2% | 11.7 | 1.82 |
| Dividend Aristocrats | 2.4% | 8.6% | 11.0% | 7.7% | 5.4% | 13.4 | 1.69 |
| S&P 500 | 1.7% | 8.5% | 10.2% | 7.1% | 4.9% | 14.8 | 1.61 |
| Nasdaq | 0.9% | 11.8% | 12.7% | 8.9% | 6.6% | 10.9 | 1.89 |
(Source: Dividend Kings Research Terminal, Morningstar, FactSet, Ycharts)
Analysts expect market-beating returns from NVS in the future, and in the meantime, you get a very safe 4.2% yield that’s superior to most high-yield options, including high-yield blue-chip ETFs.
Novartis Rolling Returns Since December 1996
Source: Portfolio Visualizer Premium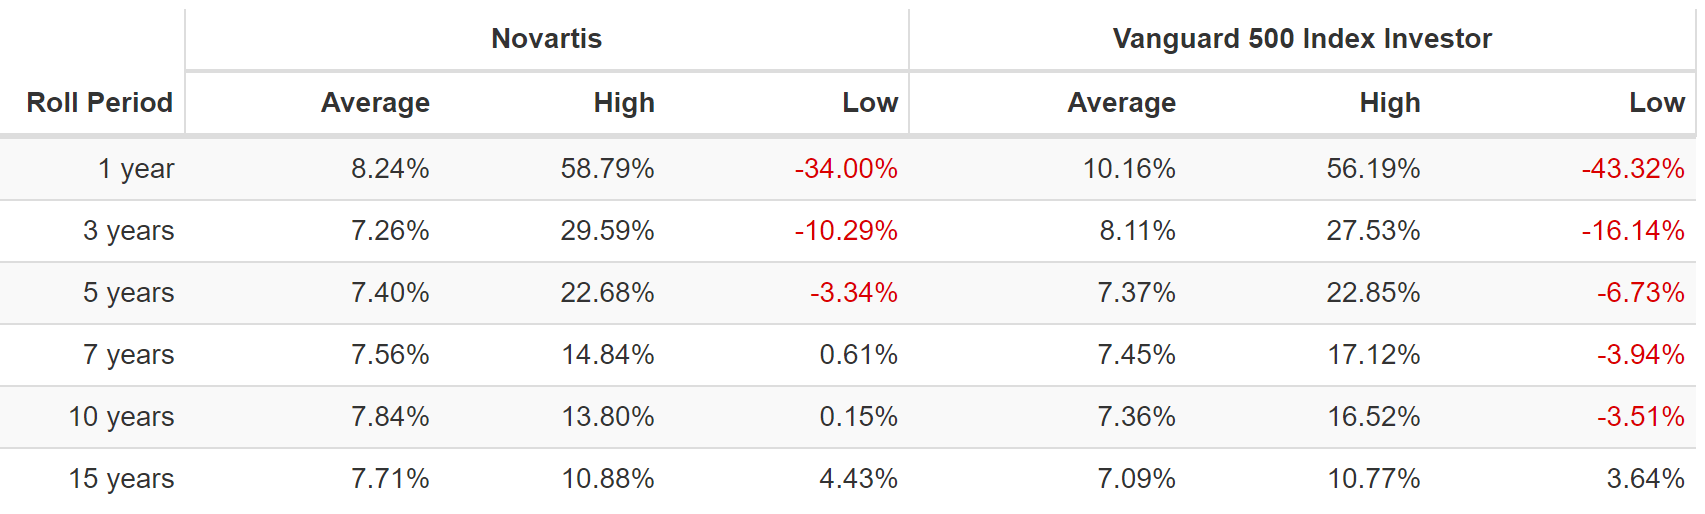
Slightly better returns than the market, but with superior yield and lower volatility, is what NVS has been delivering for the last 26 years.
Inflation-Adjusted Total Return Forecast: $1,000 Initial Investment
| Time Frame (Years) | 7.9% CAGR Inflation-Adjusted S&P 500 Consensus | 8.7% Inflation-Adjusted Dividend Aristocrats Consensus | 8.2% CAGR Inflation-Adjusted NVS Consensus | Difference Between Inflation-Adjusted NVS Consensus And S&P Consensus |
| 5 | $1,461.18 | $1,516.17 | $1,483.67 | $22.49 |
| 10 | $2,135.06 | $2,298.77 | $2,201.27 | $66.22 |
| 15 | $3,119.71 | $3,485.33 | $3,265.96 | $146.25 |
| 20 | $4,558.47 | $5,284.36 | $4,845.60 | $287.14 |
| 25 | $6,660.75 | $8,012.00 | $7,189.27 | $528.52 |
| 30 | $9,732.58 | $12,147.56 | $10,666.50 | $933.92 |
(Source: DK Research Terminal, FactSet)
NVS might not have sexy growth, but it has relatively steady and dependable growth that could deliver nearly 11X inflation-adjusted returns over the next 30 years.
| Time Frame (Years) | Ratio NVS Consensus/Aristocrat Consensus | Ratio Inflation And Inflation-Adjusted NVS Consensus vs. S&P consensus |
| 5 | 0.98 | 1.02 |
| 10 | 0.96 | 1.03 |
| 15 | 0.94 | 1.05 |
| 20 | 0.92 | 1.06 |
| 25 | 0.90 | 1.08 |
| 30 | 0.88 | 1.10 |
(Source: DK Research Terminal, FactSet)
That’s pretty much on par with what analysts expect from the aristocrats and S&P, but with NVS, you get a very safe 4.2% yield on day one.
Novartis Investment Decision Score
DK (Source: Dividend Kings Automated Investment Decision Tool)
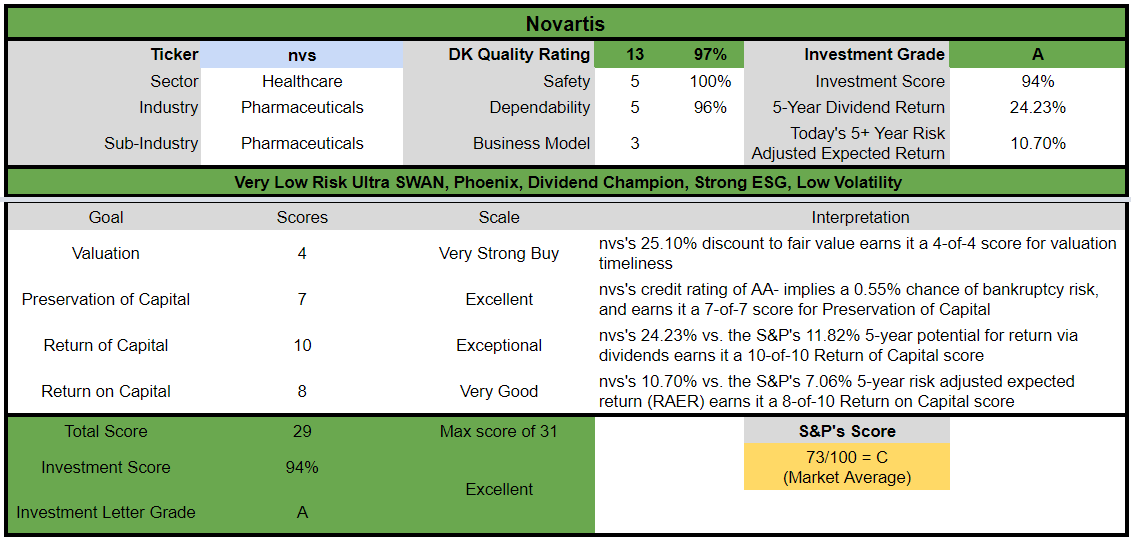
NVS is one of the best defensive global aristocrat options for anyone comfortable with its risk profile.
- 25% discount vs. 3% market discount = 22% better valuation
- very safe 4.2% yield (global aristocrat) = 2.5X higher than S&P 500
- market-matching long-term annual return potential
- 50% better risk-adjusted expected return over the next five years
- 2X higher 5-year consensus income
Bottom Line: British American And Novartis Can Help You Stay Safe In This Bear Market, And Help You Retire Rich In the Coming Years And Decades
I know it might feel like hell for anyone who can’t tear their eyes from the market these days (which is pretty much everyone reading this on Seeking Alpha;)
When stocks fall 10% in a month and might have 20% more to fall before bottoming, it’s tempting to want to time the market and just go 100% cash and ride out the storm. But history is very clear about this. 98% of market timers fail, and the cost of such failure can be enormous.
JPMorgan Asset Management
The greatest investors in history aren’t market timers; the average retail investor is. The greatest investors in history are billionaires; the average retail investor underperformed the market by 67% over the last 20 years.
- the average investor only beat inflation, commodities, cash, and the world’s worst hedge fund managers
It might seem counter-intuitive or even crazy. But it’s 100% true. Time in the market, not timing the market, is the easiest and safest road to riches you can travel.
This is where high-yield, defensive low volatility blue-chips like BTI and NVS can help.
No, they aren’t likely to go up if the market falls that final 20% that Goldman and the blue-chip consensus expect. But they are likely to fall a lot less.
Ycharts
BTI and NVS are down about half as much during a ghastly month for stocks. No, they aren’t up; nothing except managed futures is doing well in the current stagflationary environment.
- 3 Amazing Dividend Blue-Chips Beating This Bear Market
- Avoid These 2 Stocks And Buy This 11% Yielding World-Beater Instead
But for those who aren’t comfortable with hedge funds or who already own them and are looking for defensive high-yield stocks, world-beaters like BTI and NVS are a great options right now.
- attractive and very safe yield
- from global aristocrats
- that grows every year (in local currency) in all economic and market conditions
- attractive to amazing valuations
- long-term return potential superior to the S&P (and even the aristocrats and Nasdaq for BTI)
- life-changing long-term income and wealth compounding potential
Cash is defensive right now and feels oh so good to have. But do you know what cash won’t help you do long-term? Retire in safety and splendor.
But do you know what will? Defensive low volatility high-yield blue-chip bargains like these, which are just begging to be bought right now.
The purpose of the margin of safety is to render the forecast unnecessary. – Ben Graham
When you focus on safety and quality first, and prudent valuation, and sound risk-management always, you never have to pray for luck; you’ll make your own.
Be the first to comment