

tiero
There is a bit of controversy about whether or not we’re in a recession.
Technically we’ve had two consecutive quarters of negative growth, though that’s not what determines whether or not a recession is underway.
Daily Shot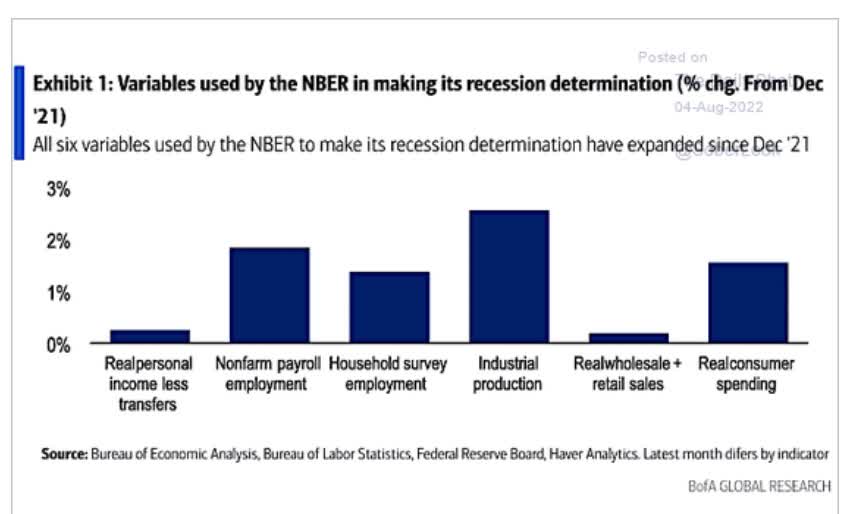
These are the six criteria used by the National Bureau of Economic Research to determine whether or not the US economy is in a recession.
In the first half of the year, all six showed positive growth, and of course, the July jobs report was a blowout.
- 528K net new jobs (more than 2X the consensus estimate)
- 3.5% unemployment
- 5.2% YOY wage growth
- 6.2% YOY wage growth for 80% of workers (non-supervisors)
May and June were revised higher by 28K; over the last 3 months, we’ve added an average of 437K net jobs each month.
- 3.2 million new net jobs in the first seven months of the year
Thus far, corporate earnings are also growing at 9%, driven by 14% sales growth.
In other words, if this is a recession, it’s the oddest one in history.
- a booming job market
- the lowest unemployment in 50 years
- strongly rising wages
- booming corporate earnings
- all six critical economic indicators used by the NBER are showing positive growth
Bottom line, we’re not in a recession… yet.
David Rice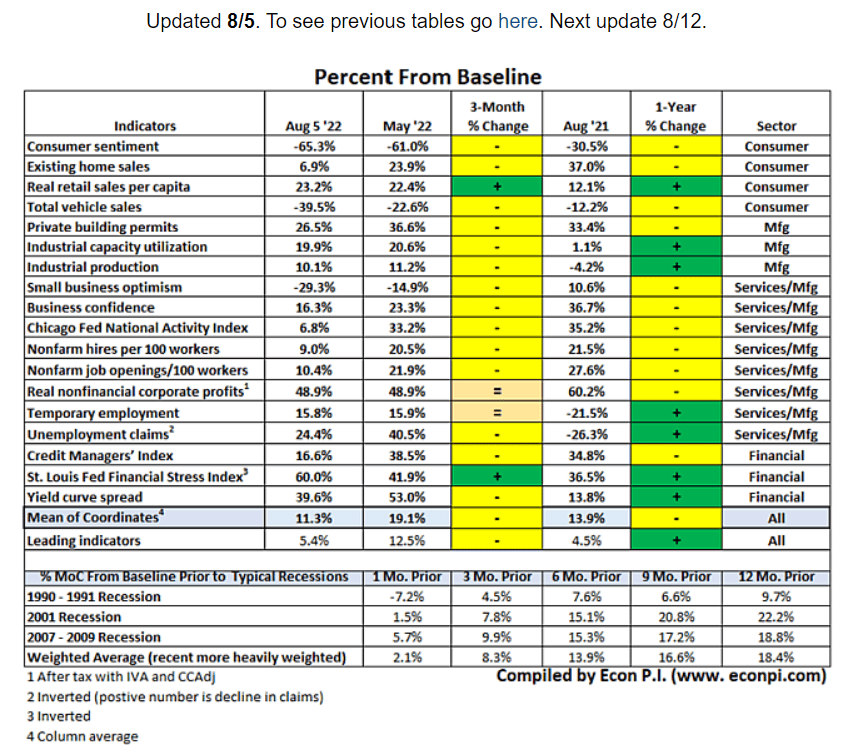
However, the economic data potentially points to a recession beginning in 4.5 to 5 months.
The bond market, via its yield curves, the most accurate recession forecasting tool in history, agrees with a recession starting around January 2023, according to Deutsche Bank.
- As of Monday, August 8th the 2-10 yield curve is -0.42%
- the most inverted since August 2000 (22 years)
Or, to put it another way, the “smart money on Wall Street,” the bond market, is rather certain a recession is coming soon.
The good news is that the recession is likely to be mild.
- Bank of America’s 2023 GDP forecast is for -0.2%
- 2001’s recession was -0.4%
- Deutsche Bank expects -0.5% GDP growth in 2023
In other words, a short (2 quarter) contraction, possibly the mildest or 2nd mildest in history could be coming soon.
Moody’s even thinks we could keep creating jobs through the entire recession at an average rate of about 75K per month.
Contrast that with the Bank of England’s forecast for a five-quarter recession in the UK with a peak decline of 2.1% which would be worse than the Great Recession.
Daily Shot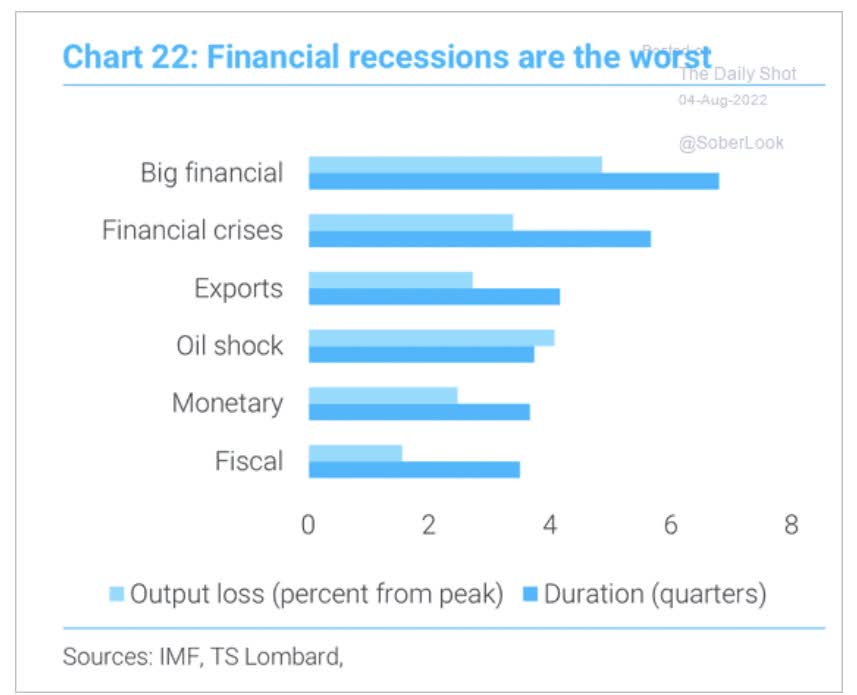
In other words, the BOE is forecasting a financial crisis like recession in the UK while the US is likely looking at a historically short fiscal/monetary style downturn.
Corporate America has $7 trillion in cash right now, our banks are well capitalized and preparing for the downturn already, and consumer balance sheets are some of the strongest they’ve been in history.
The US has literally never been better prepared for a short and mild recession, created on purpose by the Federal Reserve to slay the demon of high inflation.
But even mild recessions are scary for investors, if only because they tend to result in 36% bear markets.
Daily Shot
That’s approximately what the blue-chip consensus also expects this time (a 38% consensus peak decline).
But after market hell comes market heaven.
Charlie Bilello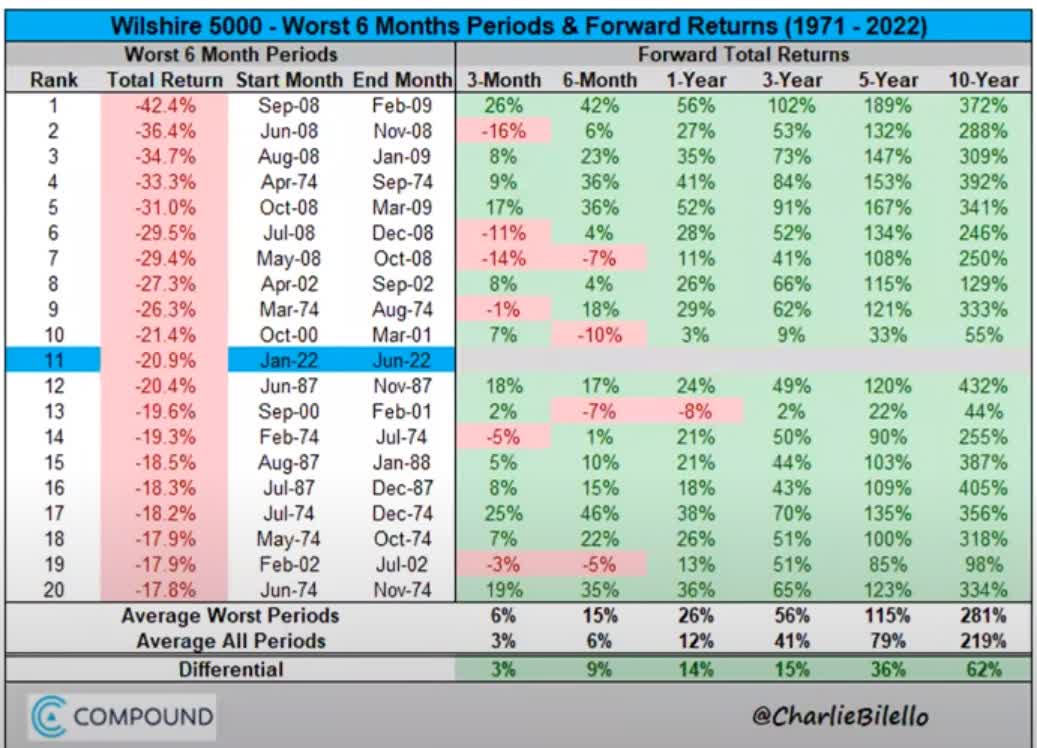
Never since 1971 have we suffered an 18+% six-month decline without stocks being up within three years.
And what happens if we fall into a 38% recessionary bear market, which would be historically normal and healthy?
- 4.5X to 5.9X historical market returns over the following 10 years
- individual blue-chips delivering 9X to 24X returns
The pain that’s likely coming soon will be temporary. The gains that are following afterward will be permanent and potentially life-changing.
That’s why safe high-yield blue-chips can be a great choice for anyone looking to put money to work in today’s uncertain times.
- get paid a very safe 4+% yield today
- while riding out the coming market storm
- and waiting for the next glorious bull market to begin
How To Find The Best A-Rated High-Yield Blue-Chips In Any Economic Climate… In 2 Minutes
Volatility caused by money managers who speculate irrationality with huge sums will offer the true investor more chance to make intelligent investment moves. He can be hurt by such volatility only if he is forced, by either financial or psychological pressures, to sell at untoward times. – Warren Buffett
Volatility has nothing to do with actual fundamental risk. Buffett defines risk as the risk of permanently losing 100% of your money because the company goes to zero.
| Credit Rating | 30-Year Bankruptcy Probability |
| AAA | 0.07% (Johnson & Johnson, Microsoft) |
| AA+ | 0.29% (Apple, Alphabet) |
| AA | 0.51% (Allianz, Walmart) |
| AA- | 0.55% (BlackRock, Meta, Toronto-Dominion Bank) |
| A+ | 0.60% (3M, Merck, Coca-Cola) |
| A | 0.66% (Home Depot, Target) |
| A- | 2.5% (Dividend Aristocrat Average) |
| BBB+ | 5% (Enbridge, Lowe’s, AbbVie) |
| BBB | 7.5% (Altria, Netflix) |
| BBB- | 11% (Broadcom, Boeing) Investment Grade Limit |
| BB+ | 14% (Tesla) |
| BB | 17% |
| BB- | 21% |
| B+ | 25% |
| B | 37% (Carnival, 33% risk of a downgrade to B-) |
| B- | 45% |
| CCC+ | 52% (AMC, 33% probability of upgrade to B-) |
| CCC | 59% |
| CCC- | 65% |
| CC | 70% |
| C | 80% |
| D | 100% |
(Sources: DK Research Terminal, S&P, University of St. Petersburg)
Credit ratings are a great proxy for fundamental risk, based on over 100 years of default data.
- when a company defaults it almost always files for bankruptcy
- and equity investors are wiped out
Rating agencies use industry-specific safety models whose only goal is to estimate 30-year default risk.
An A-rated company means a 1 in 40 or less probability over 30 years of a company filing for bankruptcy and wiping out your equity investment.
An investment grade company has a 1 in 9 or less probability over three decades of going to zero.
So let me show you how to quickly and easily find the best A-rated high-yield blue-chips you can trust in this or any future recession.
I’m using the Dividend Kings Zen Research Terminal, which runs off the DK 500 Master List.
The DK 500 Master List is one of the world’s best watchlists, including
- every dividend aristocrat (S&P companies with 25+ year dividend growth streaks)
- every dividend champion (every company, including foreign, with 25+ year dividend growth streaks)
- every dividend king (every company with 50+ year dividend growth streaks)
- every foreign aristocrat (every company with 20+ year dividend growth streaks)
- every Ultra SWAN (wide moat aristocrats or future aristocrats, as close to perfect quality companies as exist)
- 40 of the world’s best growth stocks
Here is the screen I ran in the terminal to find the best A-rated high-yield blue-chips you can safely buy today in two minutes.
- Reasonable buy or better (never overpay for a company): 297 companies remain
- A-rated companies (2.5% or less fundamental risk): 103 companies remain
- 4+% yield: SCHD and VYM, the gold standard high-yield blue-chip ETFs yield 3.6%: 25 companies remain
- 10+% consensus long-term return potential (matching the S&P 500’s consensus and historical return): 17 companies remain
- 81+% dividend safety score (2% or less dividend cut risk in a severe recession): 14 companies remain
- 80+% quality score: Master List average: 13 companies remain
- total time: 2 minutes
And this is how I found the 13 best A-rated high-yield blue-chips you can trust in this, or any recession.
13 A-Rated High-Yield Blue-Chips You Can Trust In This Recession
Dividend Kings Zen Research Terminal
I’ve linked to articles exploring each company’s investment thesis, risk profile, growth prospects, valuation, and total return potential.
Tax Implications To Consider
The Canadian companies: MFC, BNS, CM, SLF, BMO, TD, and NTIOF, have 15% tax withholdings on dividends in taxable accounts.
- not retirement accounts like IRAs or Roth 401(k)s
You can recoup the dividend withholding via a tax credit though it does require some paperwork above $300/$600 in total annual withholdings per person/couple.
The German companies: SIEGY, ALIZY, and MURGY have a 26.375% withholding.
- in all account types
- you can only recoup the withholding in taxable accounts
In other words, for CA companies, it’s the most tax efficient to own them in retirement accounts.
For all other countries (the UK has no withholding except for REITs) own them in taxable accounts to qualify for the tax credit.
FAST Graphs Up Front
Allianz 2024 Consensus Total Return Potential (1.1 Book Value Fair Value = 10.25 PE)
(Source: FAST Graphs, FactSet Research)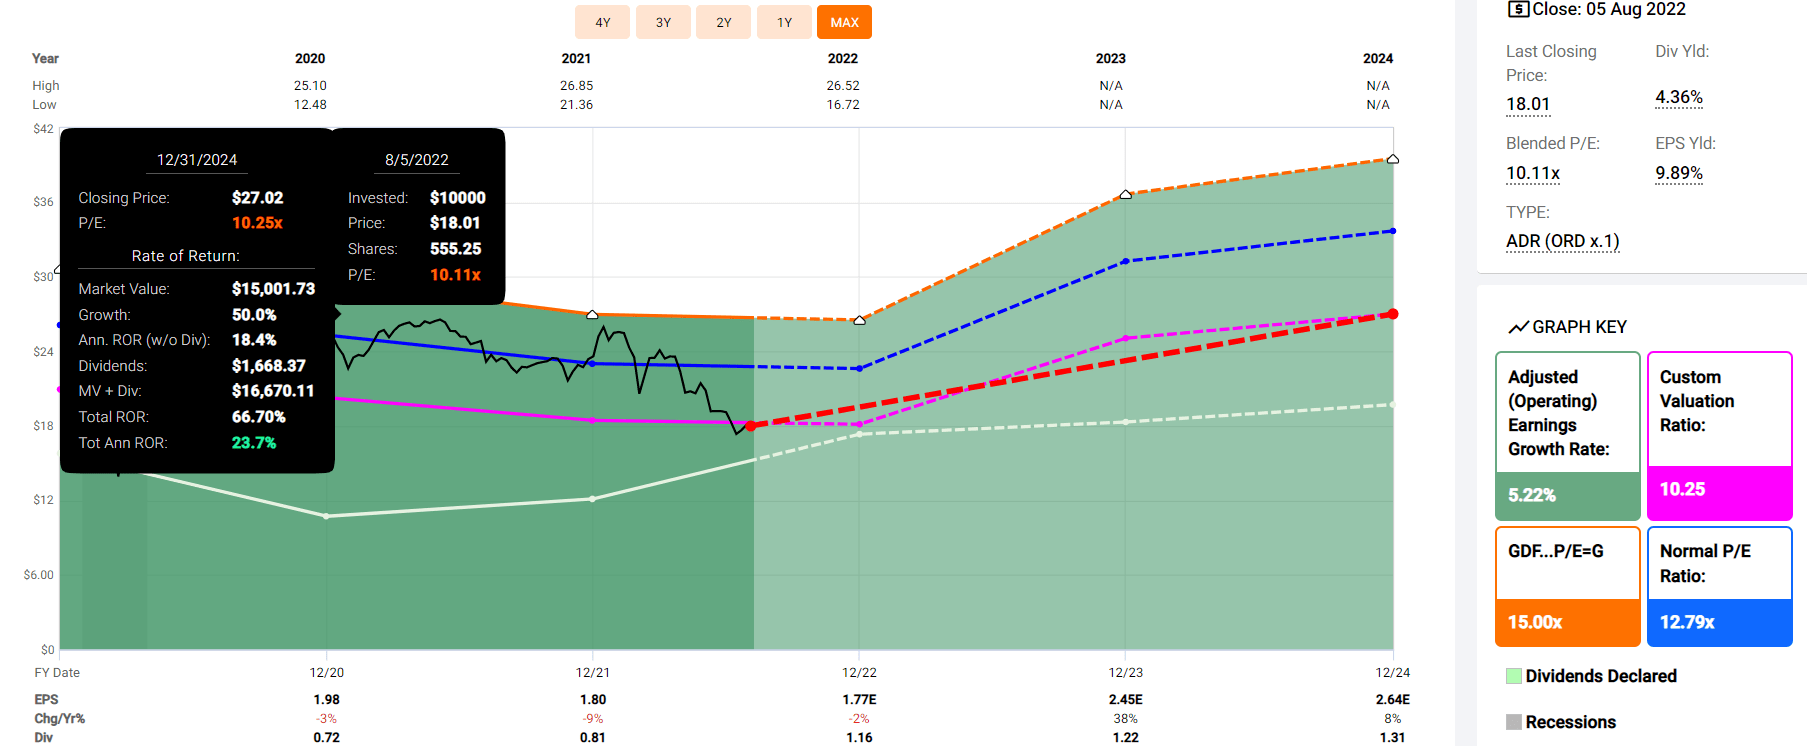
Manulife Financial 2024 Consensus Total Return Potential
(Source: FAST Graphs, FactSet Research)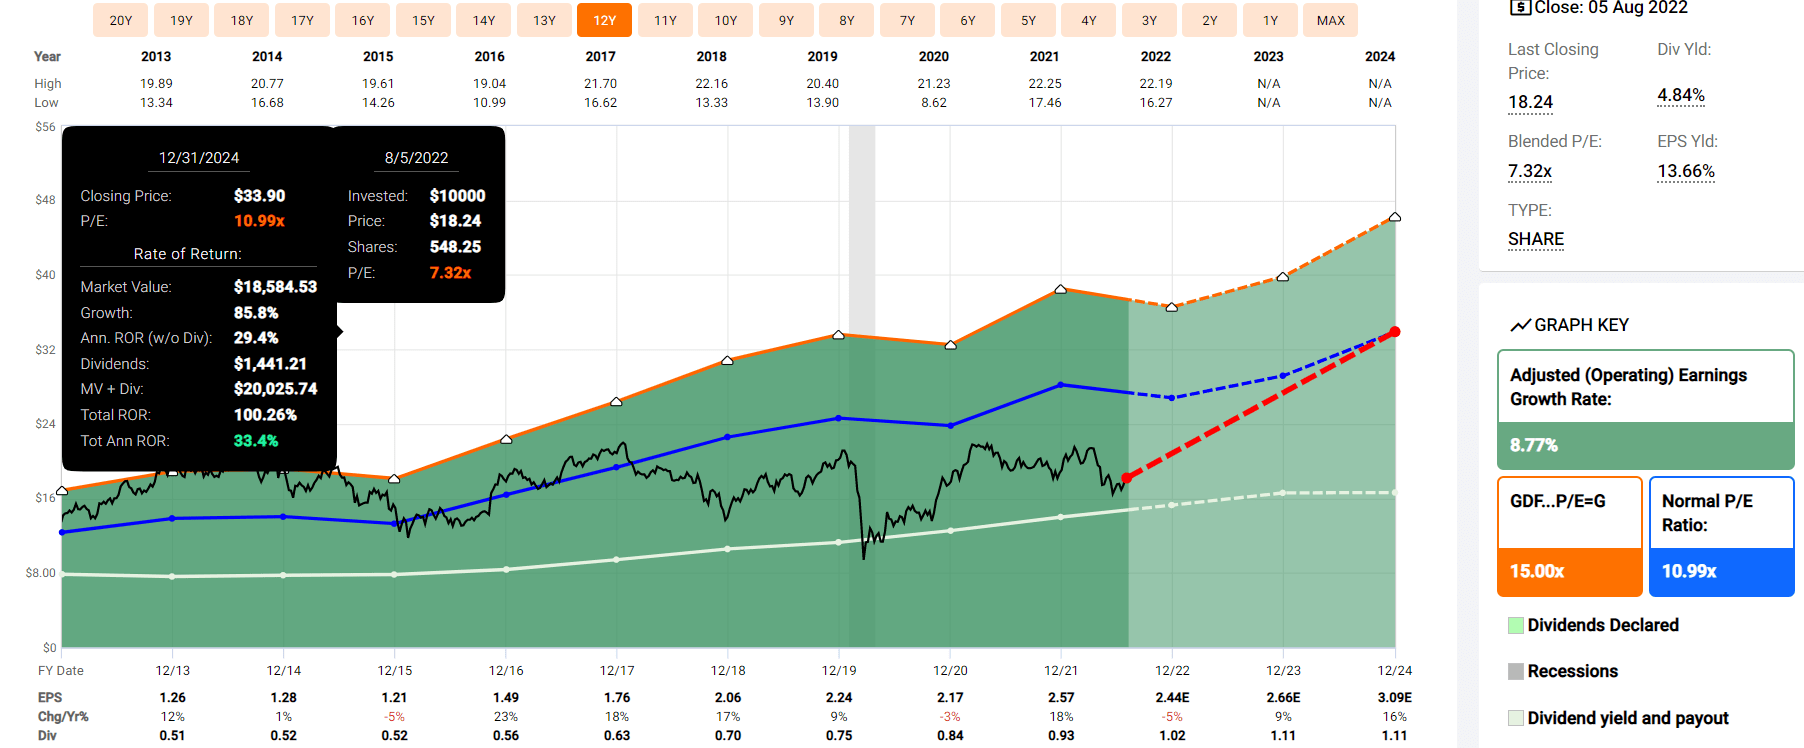
Bank of Nova Scotia 2024 Consensus Total Return Potential
(Source: FAST Graphs, FactSet Research)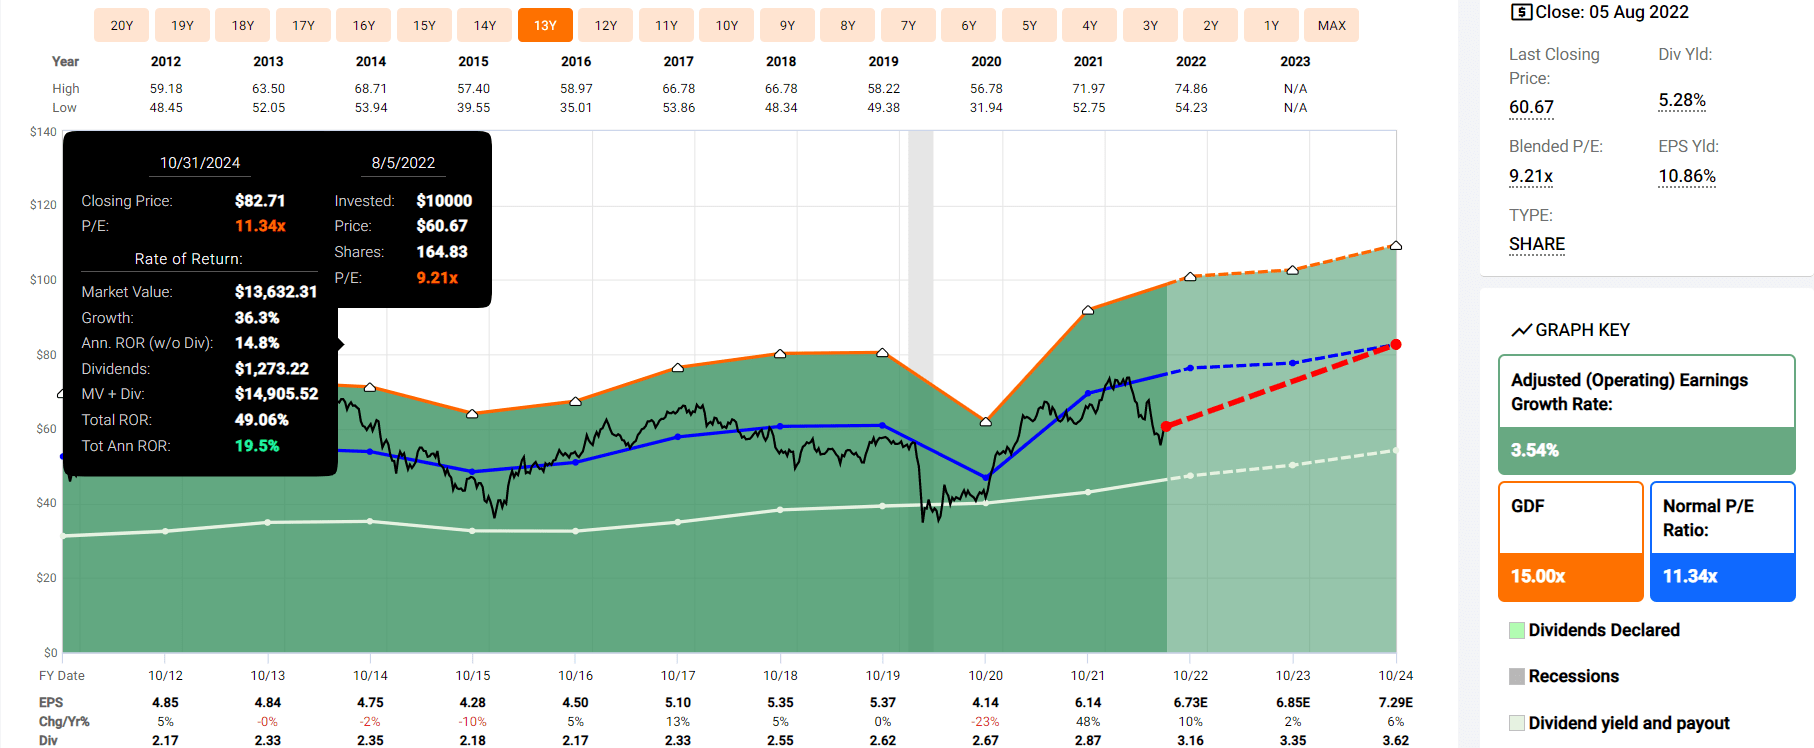
Munich Re 2024 Consensus Total Return Potential
(Source: FAST Graphs, FactSet Research)
Canadian Imperial Bank of Commerce 2024 Consensus Total Return Potential
(Source: FAST Graphs, FactSet Research)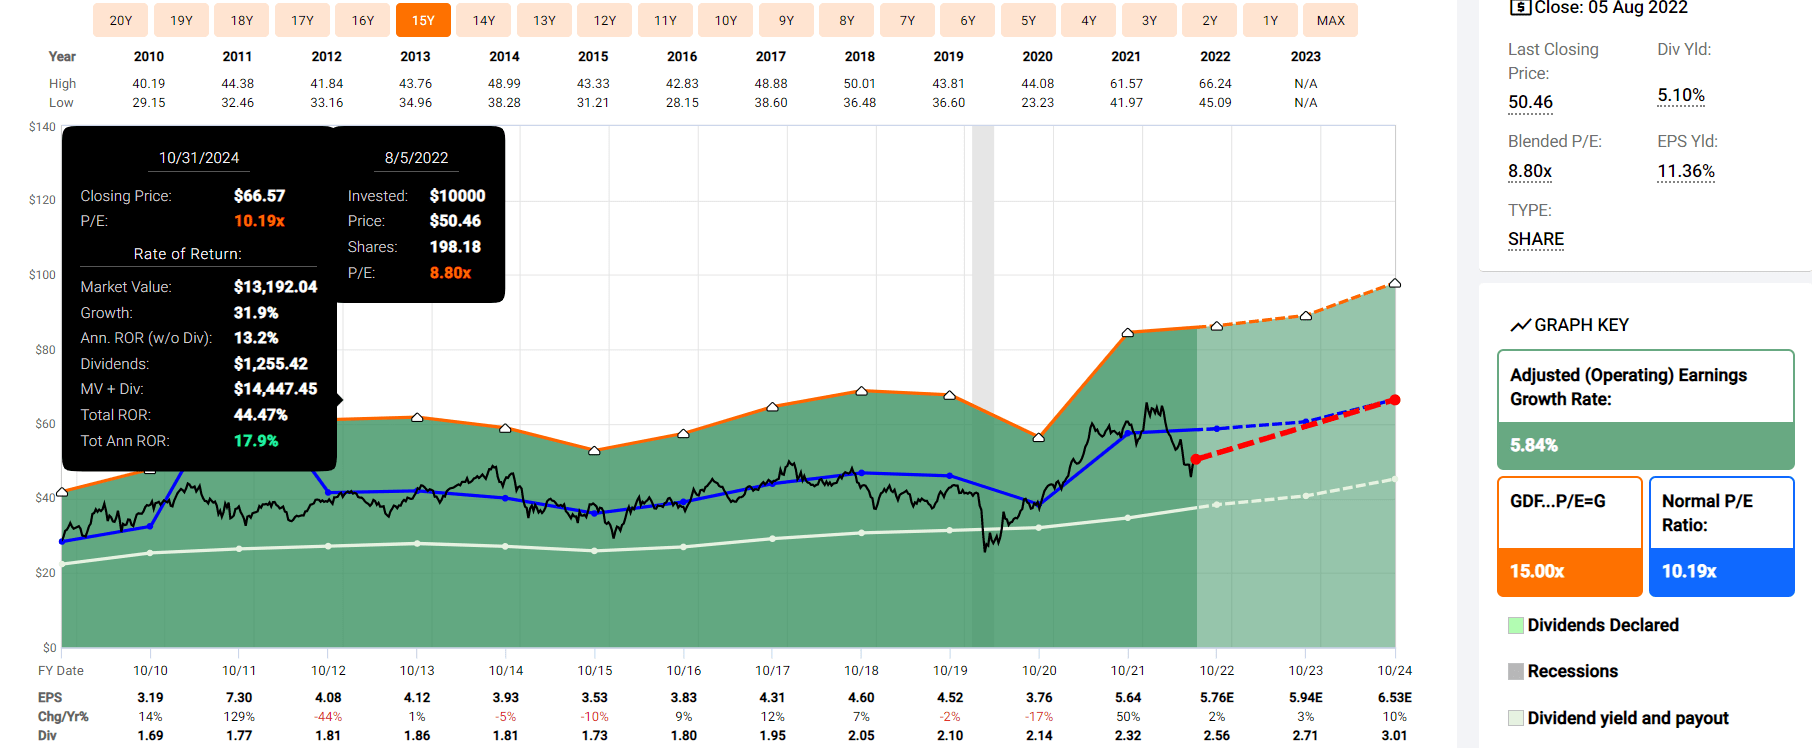
Sun Life Financial 2024 Consensus Total Return Potential
(Source: FAST Graphs, FactSet Research)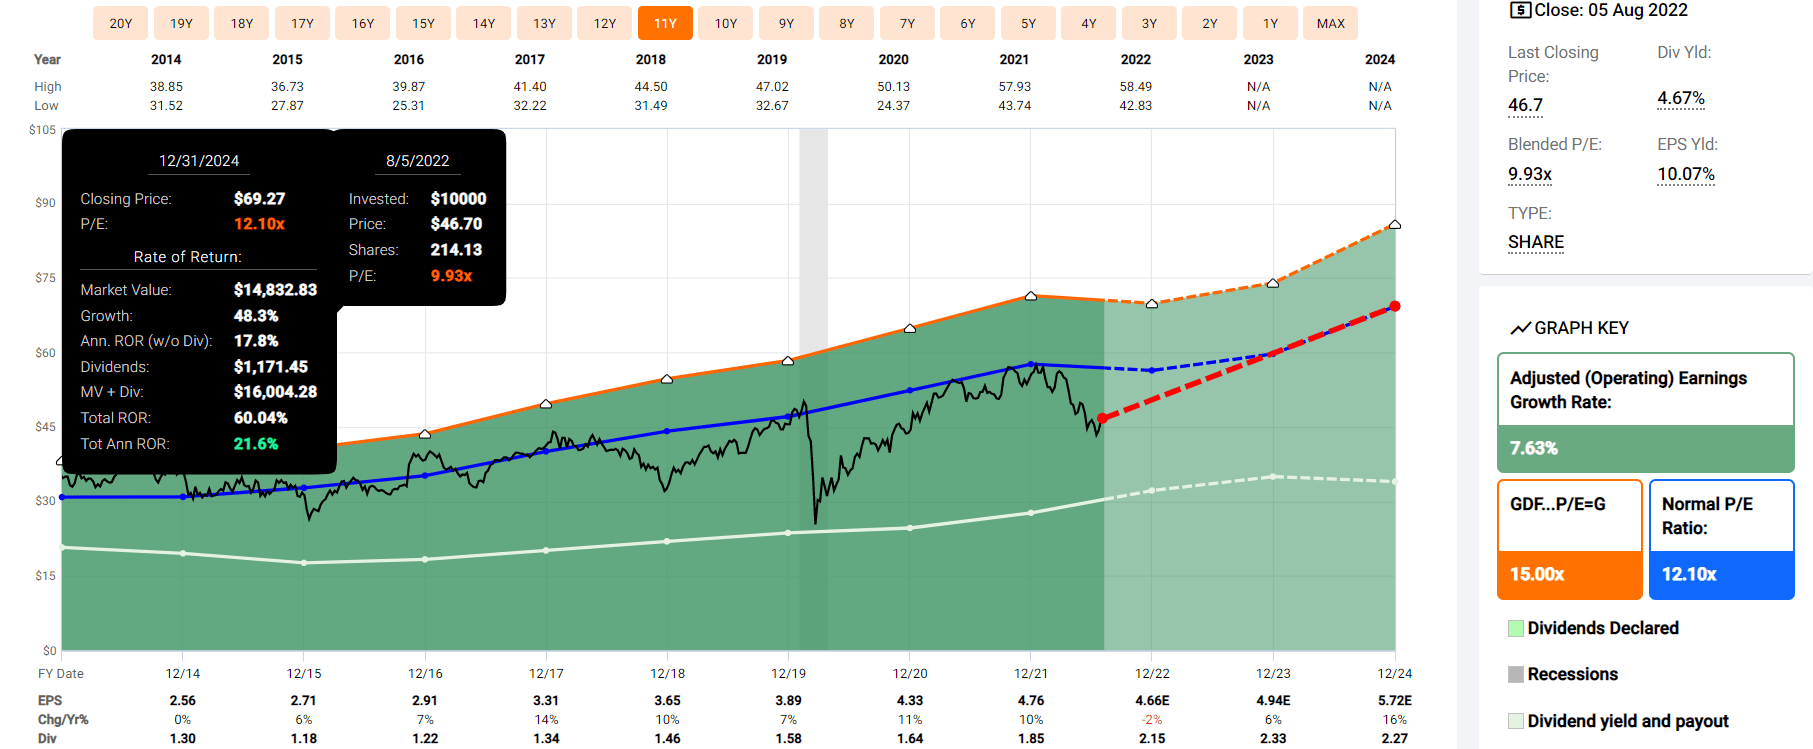
V.F. Corp 2024 Consensus Total Return Potential
(Source: FAST Graphs, FactSet Research)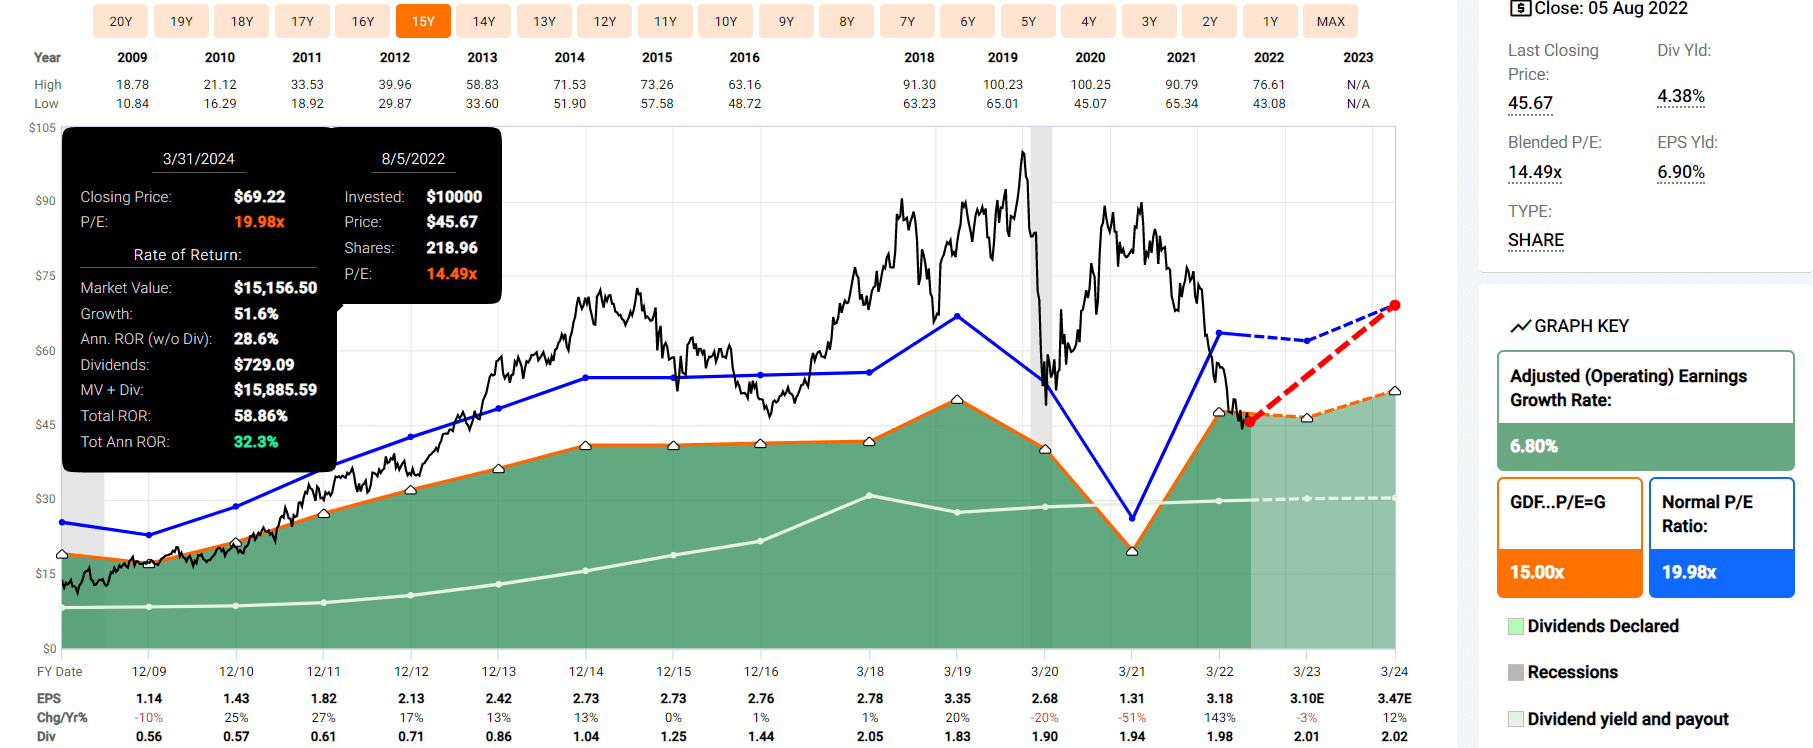
Bank of Montreal 2024 Consensus Total Return Potential
(Source: FAST Graphs, FactSet Research)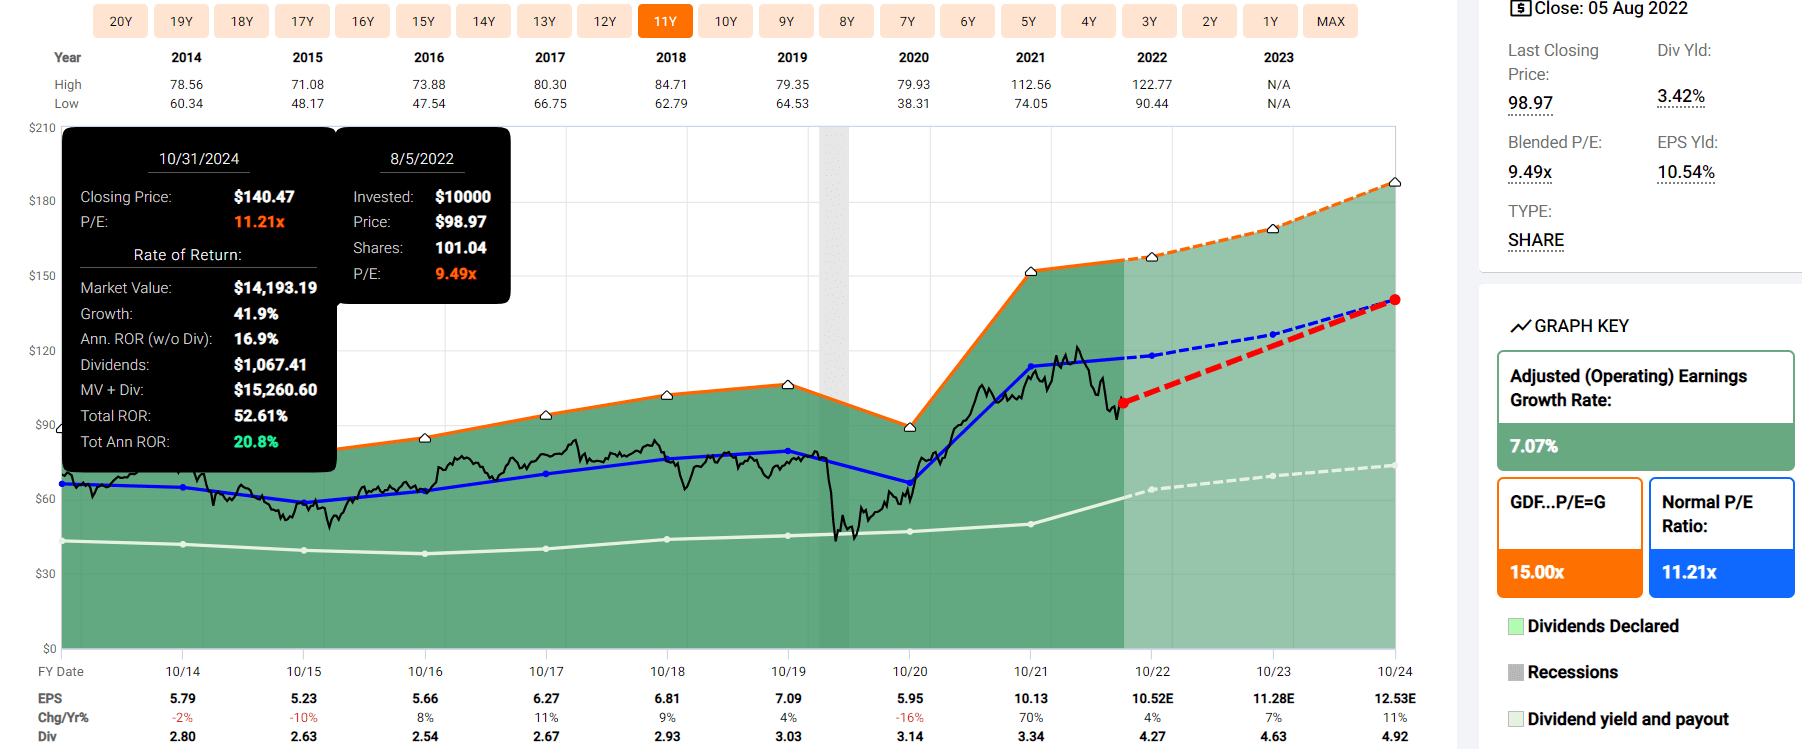
Toronto-Dominion Bank 2024 Consensus Total Return Potential
(Source: FAST Graphs, FactSet Research)
Federal Realty Investment Trust 2024 Consensus Total Return Potential
(Source: FAST Graphs, FactSet Research)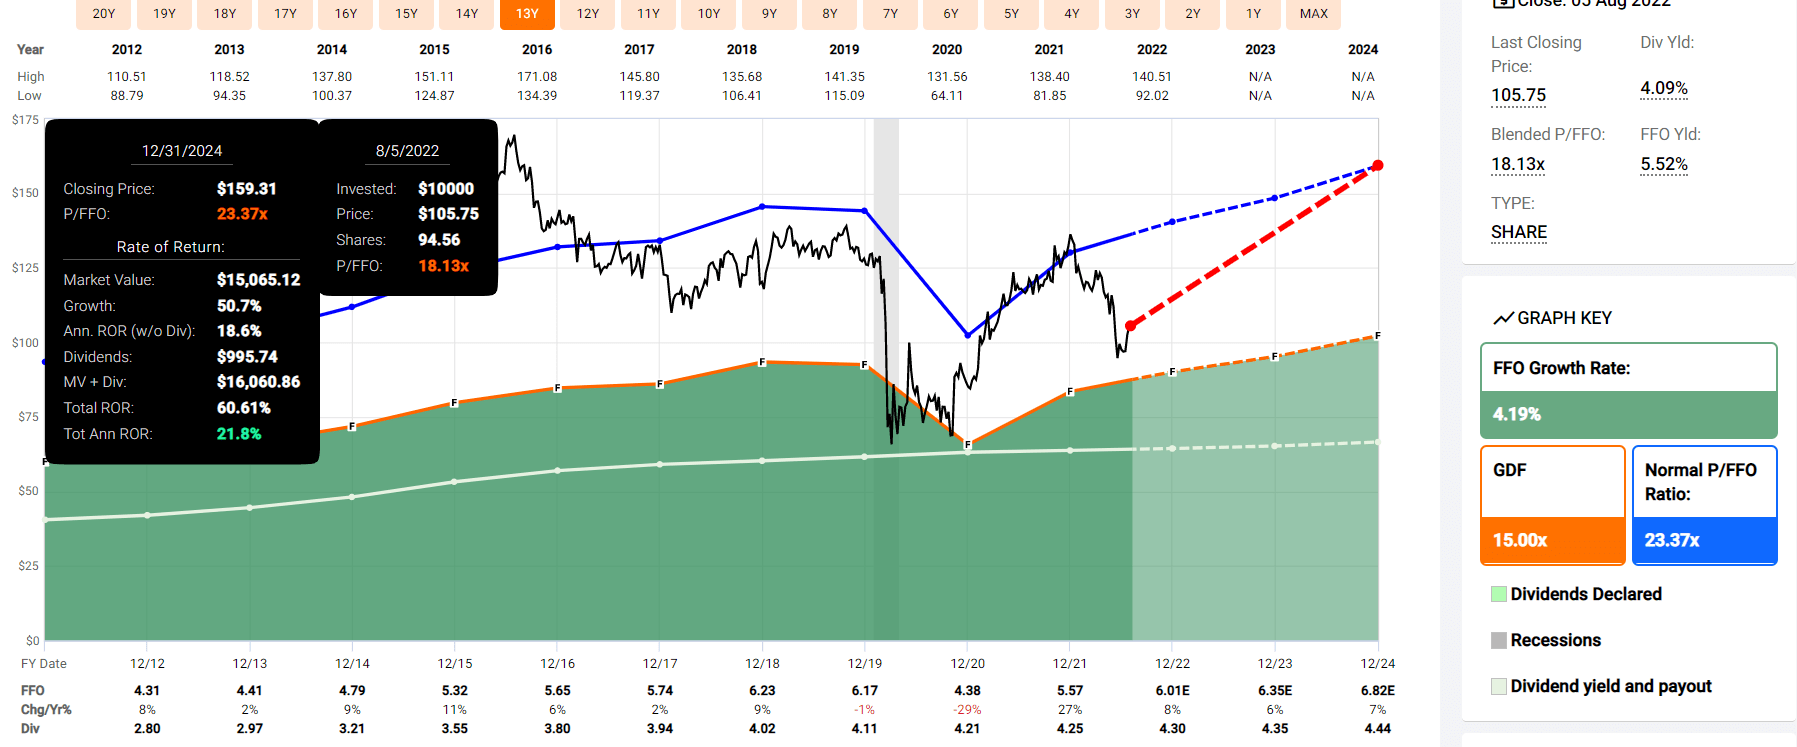
Siemens 2024 Consensus Total Return Potential
(Source: FAST Graphs, FactSet Research)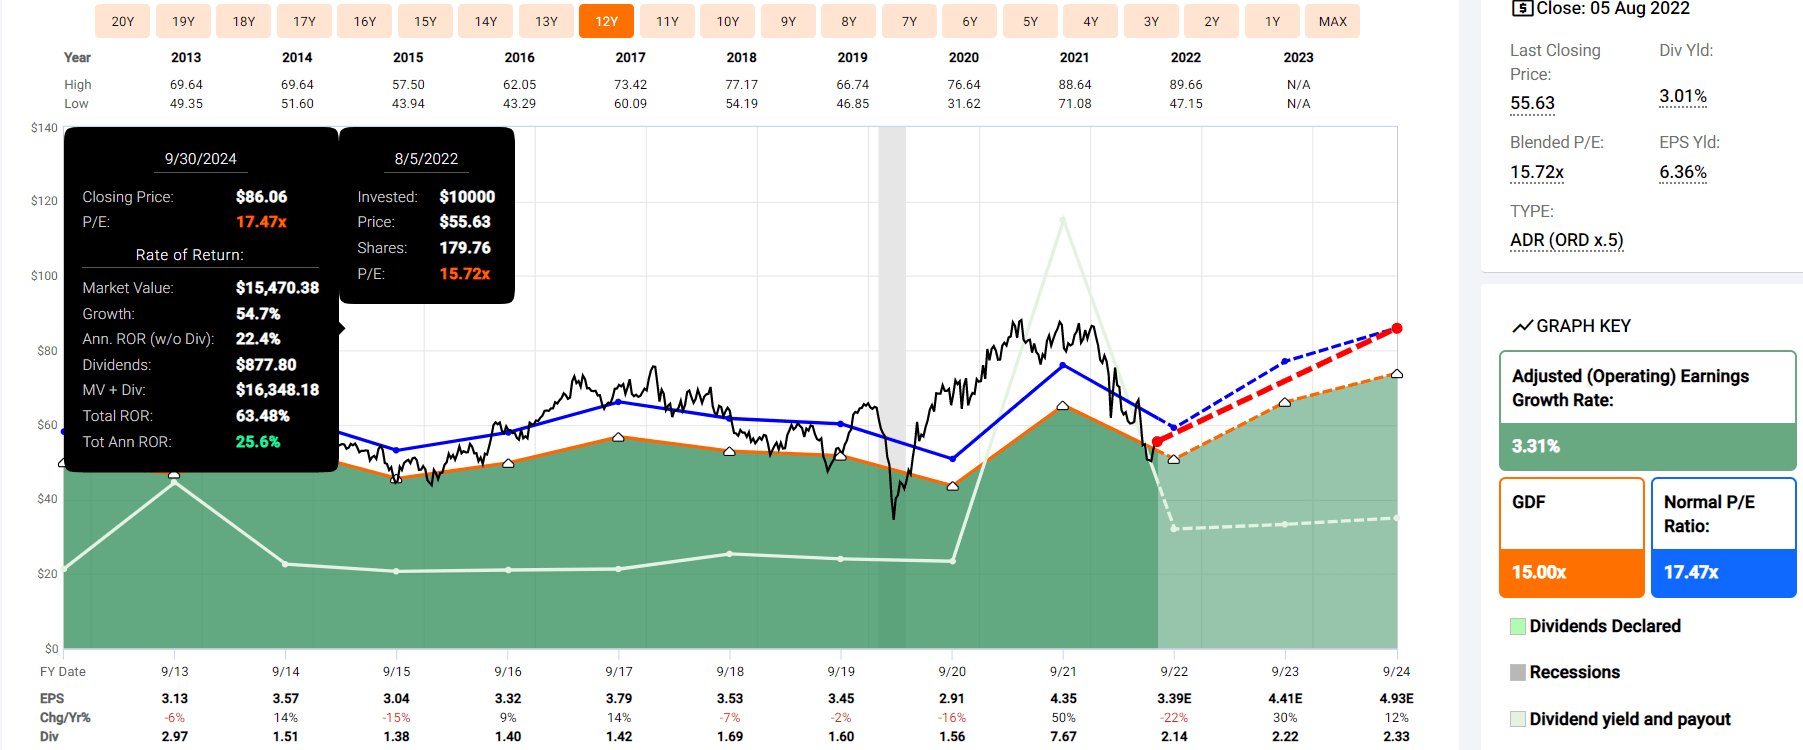
National Bank of Canada 2024 Consensus Total Return Potential
(Source: FAST Graphs, FactSet Research)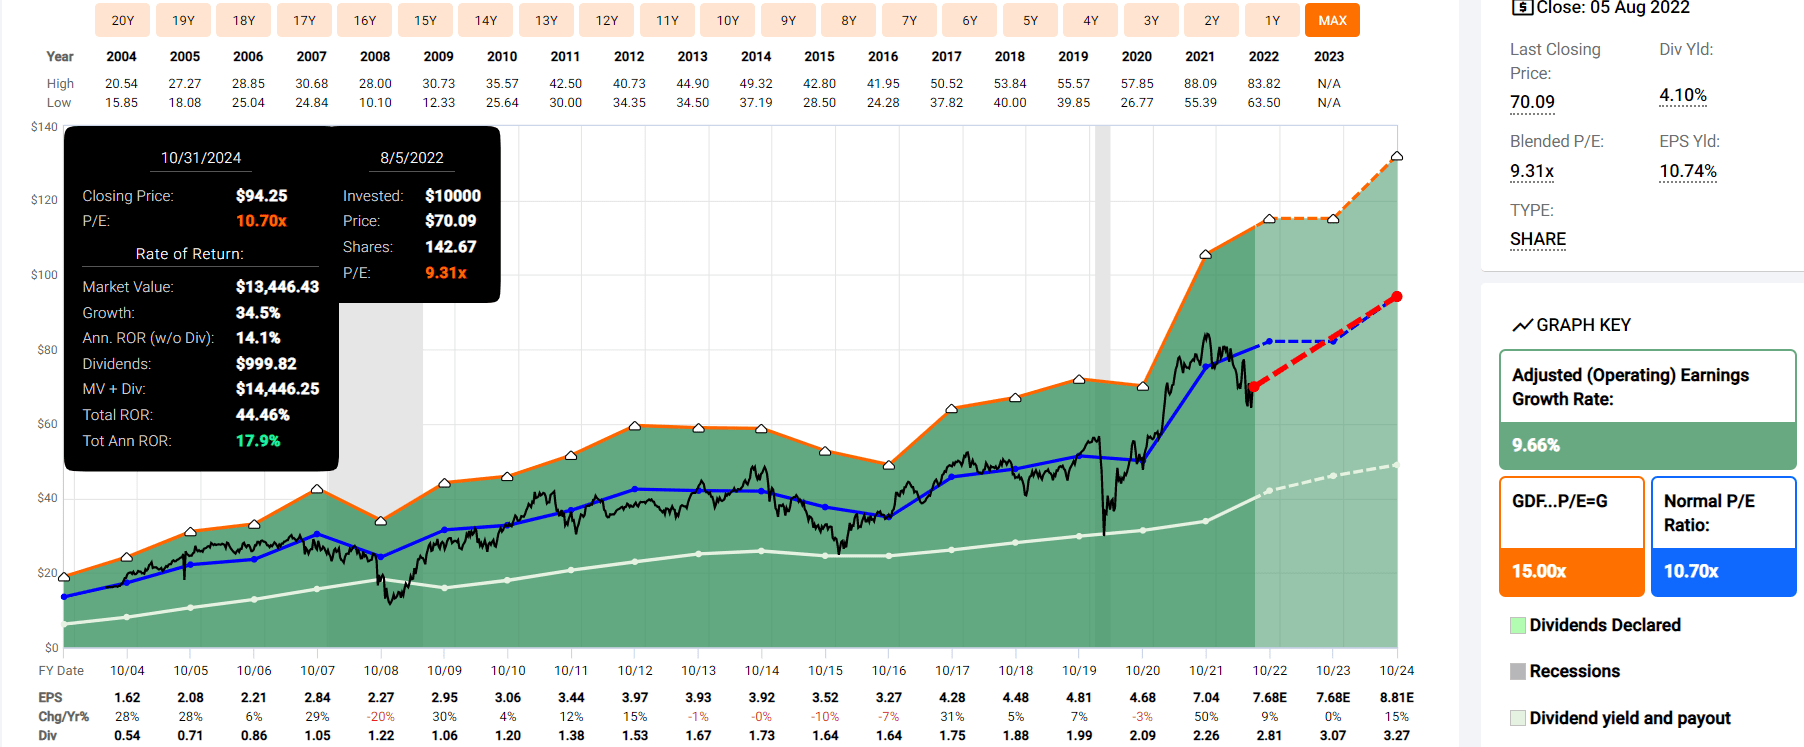
3M 2024 Consensus Total Return Potential
(Source: FAST Graphs, FactSet Research)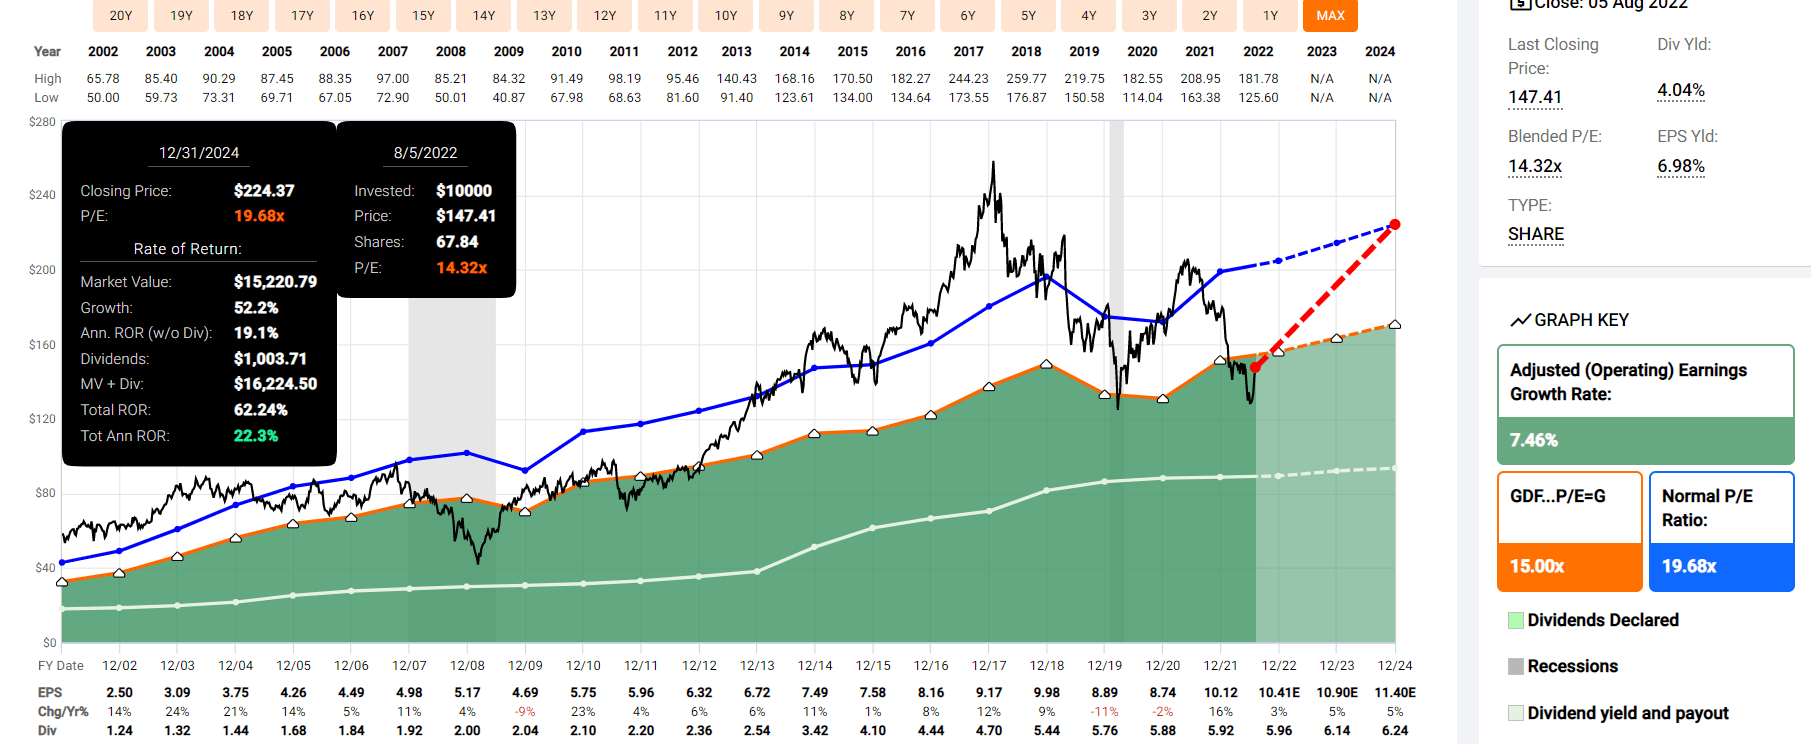
Now compare these incredible high-yield blue-chips to the S&P 500.
S&P 2024 Consensus Total Return Potential
(Source: FAST Graphs, FactSet Research)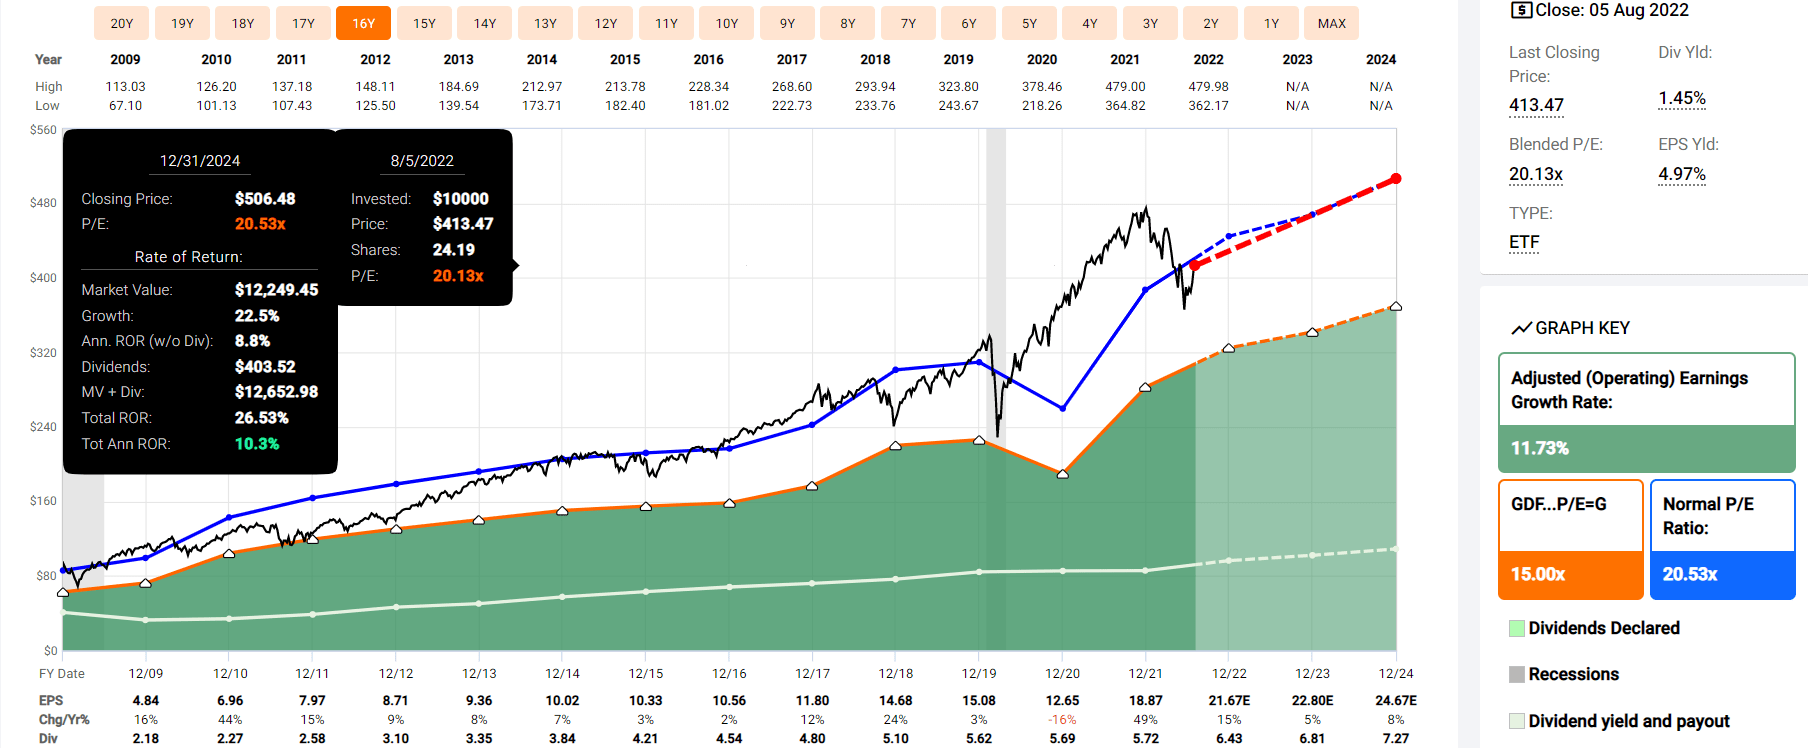
Analysts expect the S&P 500 to potentially deliver about 10% annual returns through 2024, the historical norm.
- these A-rated high-yield blue-chips 24% CAGR
- about 70% higher total return potential
But my goal isn’t to help you earn 70% more over 2 years, my goal is to help you achieve life-changing income and wealth compounding while sleeping well at night in this and all future recessions.
Some Of The World’s Safest High-Yield Blue-Chips
How do I know these are some of the world’s safest high-yield blue-chips?
Dividend Kings Zen Research Terminal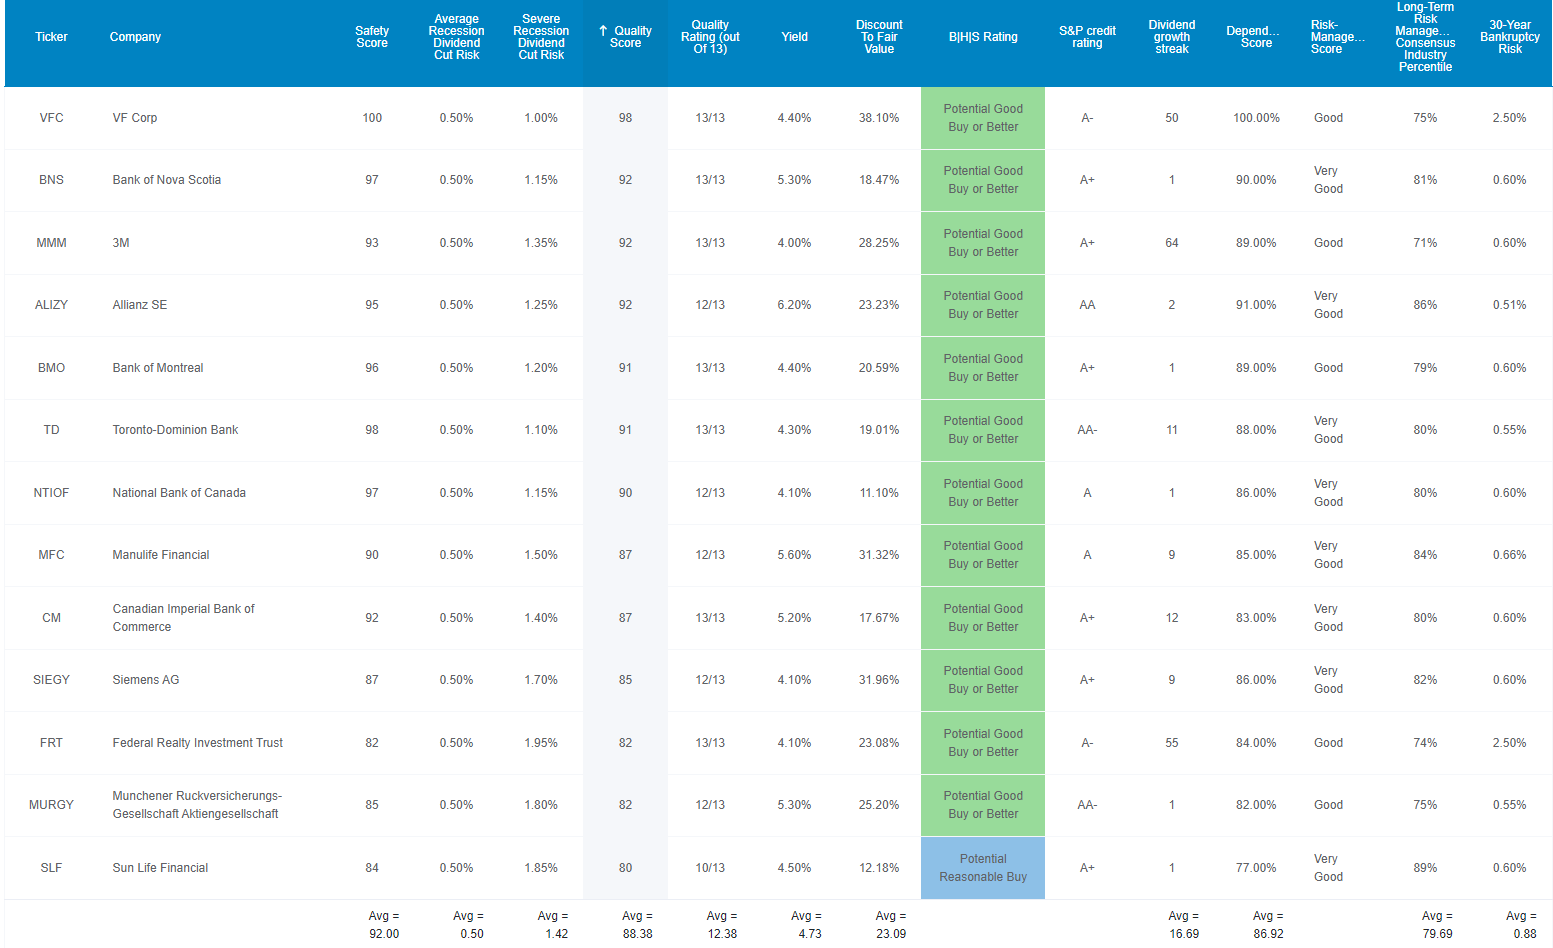
Because they aren’t just blue-chips, they are Super SWANs and higher quality than the dividend aristocrats.
Higher Quality And Better Investment Opportunities Than The Dividend Aristocrats
| Metric | Dividend Aristocrats | 13 A-Rated High-Yield Blue-Chips | Winner Dividend Aristocrats |
Winner 5% Yielding Low Volatility Blue-Chips |
| Quality | 87% | 88% | 1 | |
| Safety | 90% | 92% | 1 | |
| Average Recession Dividend Cut Risk | 0.5% | 0.5% | 1 | 1 |
| Severe Recession Dividend Cut Risk | 1.5% | 1.4% | 1 | |
| Dependability | 84% | 87% | 1 | |
| Dividend Growth Streak (Years) | 44.8 | 16.7 | 1 | |
| Long-Term Risk Management Industry Percentile | 67% Above-Average | 80% Very Good | 1 | |
| Average Credit Rating | A- Stable | A Stable | 1 | |
| Average Bankruptcy Risk | 3.04% | 0.88% | 1 | |
| Average Return On Capital | 88% | 45% | 1 | |
| Average ROC Industry Percentile | 69% | 89% | 1 | |
| 13-Year Median ROC | 74% | 54% | 1 | |
| Forward PE | 20.2 | 10.1 | 1 | |
| Discount To Fair Value | -0.2% | 23.1% | 1 | |
| DK Rating | Hold | Strong Buy | 1 | |
| Yield | 2.4% | 4.7% | 1 | |
| LT Growth Consensus | 8.7% | 8.2% | 1 | |
| Total Return Potential | 11.1% | 12.9% | 1 | |
| Risk-Adjusted Expected Return | 7.5% | 9.0% | 1 | |
| Inflation & Risk-Adjusted Expected Return | 5.3% | 6.7% | 1 | |
| Conservative Years To Double | 13.5 | 10.7 | 1 | |
| Total | 4 | 18 |
(Source: Dividend Kings Zen Research Terminal)
These A-rated high-yield Super SWANs match or exceed the aristocrats on almost every important quality and safety metric.
The aristocrats average a very low 1.5% risk of a dividend cut in a severe recession and just 0.5% in a historically average recession.
These A-rated high-yield blue-chips average 1.4% severe recession cut risk and 0.5% in a historically average recession.
The aristocrats naturally have a better dividend growth streak at almost 45 years, but these A-rated high-yield blue-chips average a 17-year streak, not far from the Ben Graham 20-year standard of excellence.
The aristocrats have a superior return on capital at 88%, but these A-rated high-yield blue-chips average a 45% return on capital, 3X that of the S&P 500.
And in terms of return on capital industry percentile, these A-rated blue-chips are in the top 11% of their respective peers, representing some of the widest moat names in these sectors.
S&P estimates their average 30-year default risk at 0.88%, a 1 in 114 chance of losing your money buying any of these 13 companies.
- and an effective zero chance of all 13 going to zero together
Six rating agencies consider their long-term risk-management to be in the 80th percentile. How good is that?
Some Of The Best Long-Term Risk-Management On Earth
| Classification | Average Consensus LT Risk-Management Industry Percentile |
Risk-Management Rating |
| S&P Global (SPGI) #1 Risk Management In The Master List | 94 | Exceptional |
| 13 A-Rated High-Yield Blue-Chips | 80 |
Very Good |
| Strong ESG Stocks | 78 |
Good – Bordering On Very Good |
| Foreign Dividend Stocks | 75 | Good |
| Ultra SWANs | 71 | Good |
| Low Volatility Stocks | 68 | Above-Average |
| Dividend Aristocrats | 67 | Above-Average |
| Dividend Kings | 63 | Above-Average |
| Master List average | 62 | Above-Average |
| Hyper-Growth stocks | 61 | Above-Average |
| Monthly Dividend Stocks | 60 | Above-Average |
| Dividend Champions | 57 | Average bordering on above-average |
(Source: DK Research Terminal)
These are companies whose management teams and corporate cultures have proven to be highly adaptable and capable of overcoming any challenges that arise from the economy or competitors.
And that’s why I trust these A-rated high-yield blue-chips and so can you. And here’s why you might want to buy them today… in case we manage to avoid a recession in 2023.
Wonderful Companies at Wonderful Prices
Dividend Kings Zen Research Terminal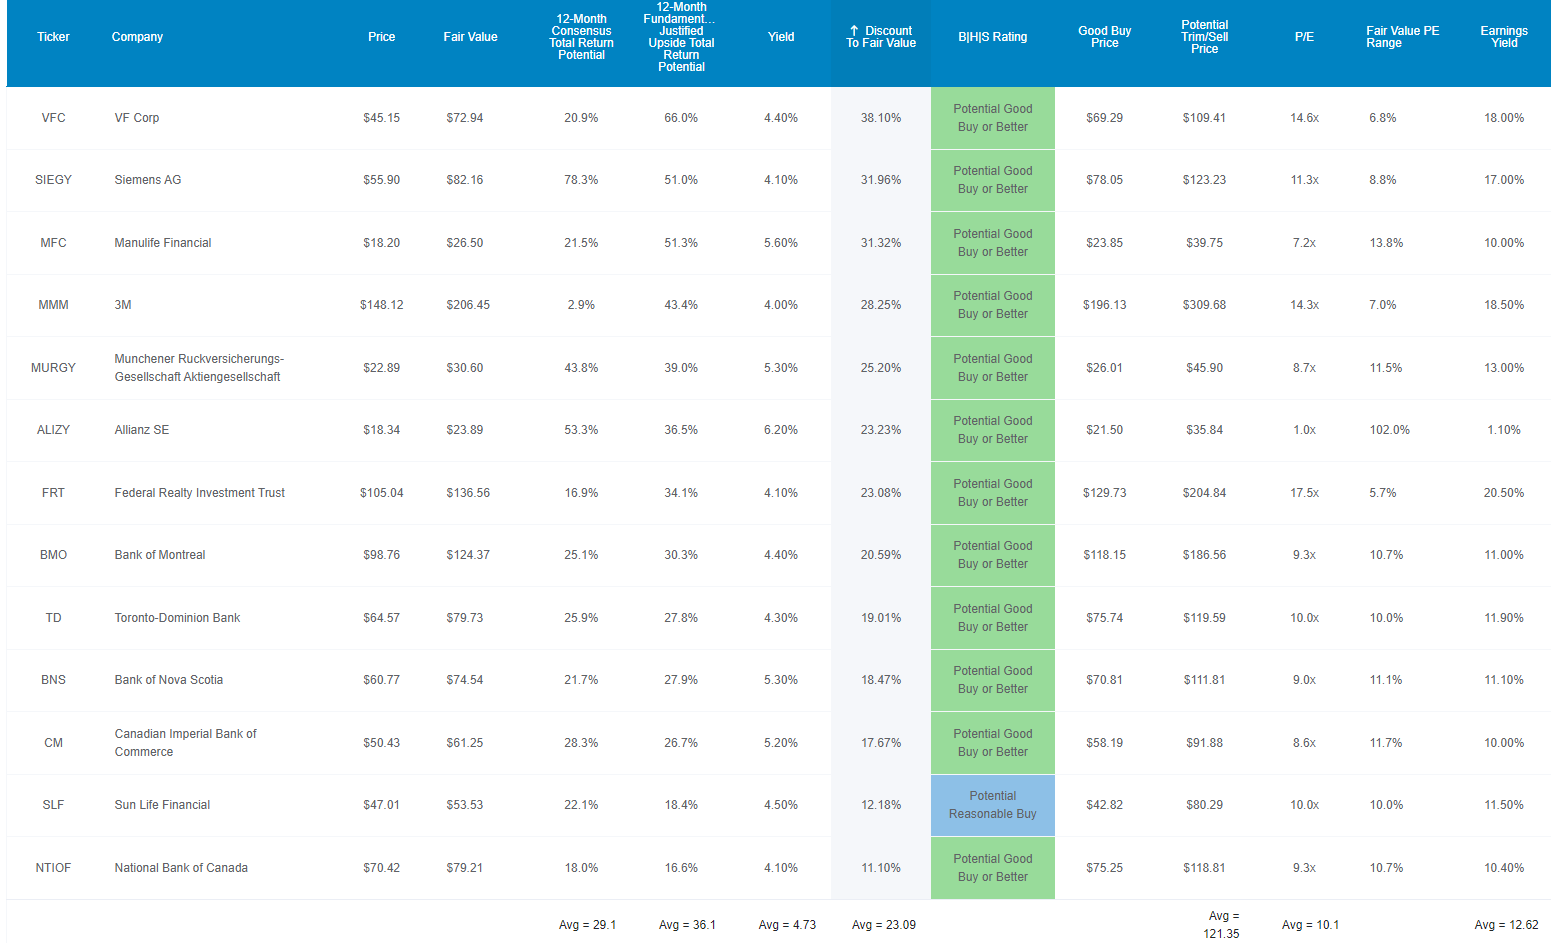
For context, the dividend aristocrats trade at 20.3X forward earnings, basically historical fair value. The S&P 500 trades at 17.7X earnings, a 5% historical premium.
These A-rated high-yield blue-chips trade at 10.1X earnings, a 23% historical discount.
- the S&P 500’s PE bottomed at 10.3X in the Great Recession
- these A-rated high-yield blue-chips are literally trading at financial crisis valuations
Analysts expect them to deliver 29% total returns in just the next year. But their fundamentally justified 12-month total return potential is 36%.
- if they grow as expected and return to historical fair value you earn 36%
But I’m not trying to score you a quick 29% gain or even 36% total returns. I’m trying to help you achieve 20X inflation-adjusted returns over 30 years.
Long-Term Fundamentals That Can Help You Retire In Safety And Splendor
Dividend Kings Zen Research Terminal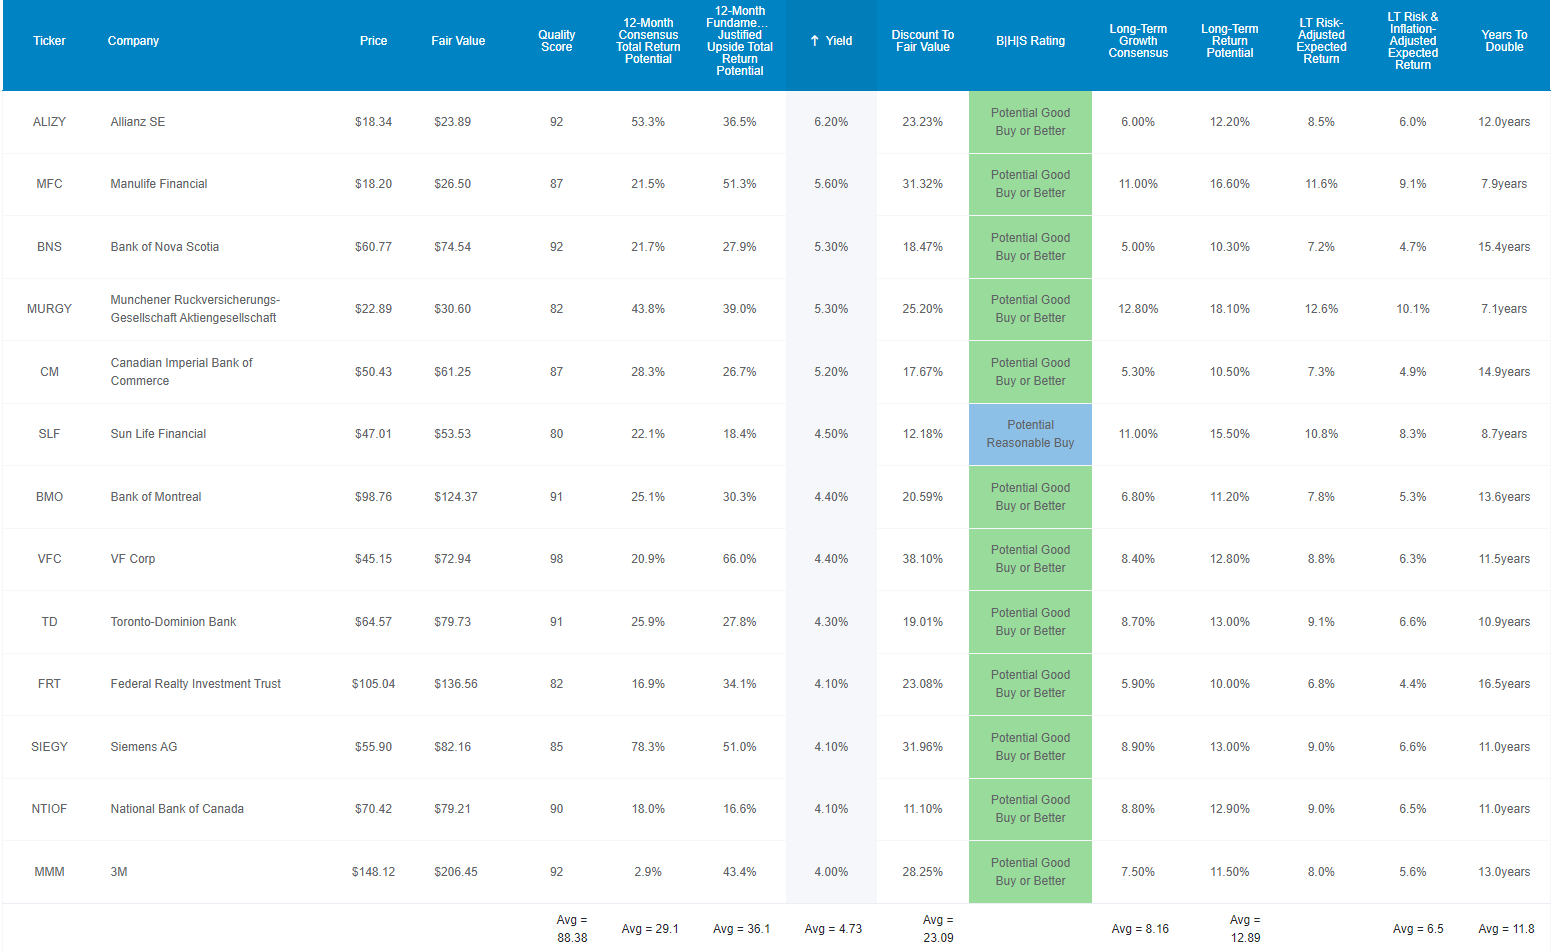
Not only do these A-rated high-yield blue-chips offer one of the world’s safest 4.7% yields, but they are growing at 8.2% analysts think they can deliver nearly 13% long-term returns.
| Investment Strategy | Yield | LT Consensus Growth | LT Consensus Total Return Potential | Long-Term Risk-Adjusted Expected Return | Long-Term Inflation And Risk-Adjusted Expected Returns | Years To Double Your Inflation & Risk-Adjusted Wealth |
10-Year Inflation And Risk-Adjusted Expected Return |
| 13 A-Rated High-Yield Blue-Chips | 4.7% | 8.2% | 12.9% | 9.0% | 6.8% | 10.6 | 1.93 |
| Dividend Aristocrats | 2.5% | 8.6% | 11.0% | 7.7% | 5.5% | 13.1 | 1.71 |
| S&P 500 | 1.6% | 8.5% | 10.1% | 7.1% | 4.9% | 14.8 | 1.61 |
(Sources: Morningstar, FactSet, YCharts)
That’s about 2% more than analysts expect from the dividend aristocrats and 3% more than the S&P 500. Think that 3% higher returns over time don’t matter?
Inflation-Adjusted Consensus Return Potential: $1,000 Initial Investment
| Time Frame (Years) | 7.9% CAGR Inflation-Adjusted S&P Consensus | 8.8% Inflation-Adjusted Aristocrat Consensus | 10.7% CAGR Inflation-Adjusted 13 A-Rated High-Yield Blue-Chips Consensus | Difference Between Inflation-Adjusted 13 A-Rated High-Yield Blue-Chips Consensus And S&P Consensus |
| 5 | $1,461.18 | $1,523.16 | $1,660.91 | $199.73 |
| 10 | $2,135.06 | $2,320.01 | $2,758.62 | $623.56 |
| 15 | $3,119.71 | $3,533.75 | $4,581.81 | $1,462.10 |
| 20 | $4,558.47 | $5,382.46 | $7,609.97 | $3,051.50 |
| 25 | $6,660.75 | $8,198.35 | $12,639.47 | $5,978.71 |
| 30 | $9,732.58 | $12,487.39 | $20,993.00 | $11,260.42 |
| 35 | $14,221.09 | $19,020.28 | $34,867.46 | $20,646.37 |
| 40 | $20,779.62 | $28,970.91 | $57,911.66 | $37,132.04 |
| 45 | $30,362.83 | $44,127.31 | $96,185.98 | $65,823.15 |
| 50 | $44,365.65 | $67,212.91 | $159,756.13 | $115,390.47 |
(Source: DK Research Terminal, FactSet)
Analysts think these blue-chips, which have been growing steadily for decades, can deliver 21X inflation-adjusted returns over 30 years and potentially 160X bagger returns for your heirs.
- You don’t need crypto to earn 100X returns, just the world’s best blue-chips and enough time.
| Time Frame (Years) | Ratio Aristocrats/S&P Consensus | Ratio Inflation-Adjusted 13 A-Rated High-Yield Blue-Chips Consensus vs. S&P consensus |
| 5 | 1.04 | 1.14 |
| 10 | 1.09 | 1.29 |
| 15 | 1.13 | 1.47 |
| 20 | 1.18 | 1.67 |
| 25 | 1.23 | 1.90 |
| 30 | 1.28 | 2.16 |
| 35 | 1.34 | 2.45 |
| 40 | 1.39 | 2.79 |
| 45 | 1.45 | 3.17 |
| 50 | 1.51 | 3.60 |
(Source: DK Research Terminal, FactSet)
2% to 3% better returns won’t change your life in 10 years, but it certainly could over 30 to 50 years.
So 2X the yield of the aristocrats and 3X the yield of the S&P 500, with superior safety and potentially put to 3.6X more inflation-adjusted wealth over time? This must be too good to be true! It’s not.
Historical Returns Since April 2000 (Equal Weight, Annual Rebalancing)
The future doesn’t repeat, but it often rhymes. – Mark Twain
Past performance is no guarantee of future results. Still, studies show that blue-chips with relatively stable fundamentals over time offer predictable returns based on yield, growth, and valuation mean reversion.
Bank of America
So let’s look at how these A-rated high-yield blue-chips performed over the last 22 years when about 92% of total returns were the result of fundamentals, not luck.
(Source: Portfolio Visualizer Premium)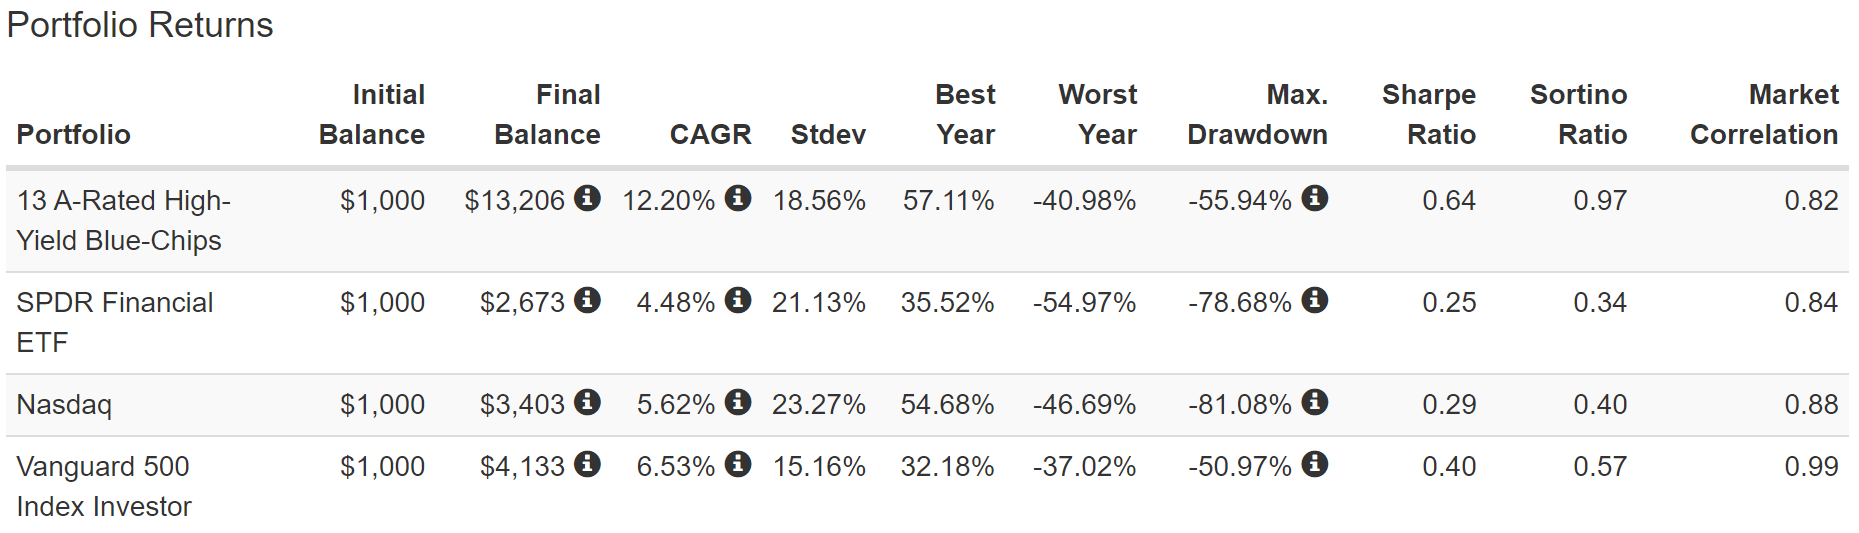
Analysts expect close to 13% long-term returns from this financial heavy portfolio. That sounds crazy, right? US financials have delivered about 1/3rd of those returns over the last 22 years.
But guess who didn’t blow themselves up in the Great Financial Crisis? Canadian Banks and German insurance blue-chips.
In order to win the game, first you must not lose it. – Chuck Noll
These A-rated high-yield Super SWANs delivered 12.2% returns for 22 years, a 13X return that ran circles around US financials, the S&P 500 and even the Nasdaq.
Did they fall a lot in the GFC? You bet. But they fell 30% less than US financials, and let’s not forget the Nasdaq fell 81% during the tech crash.
(Source: Portfolio Visualizer Premium)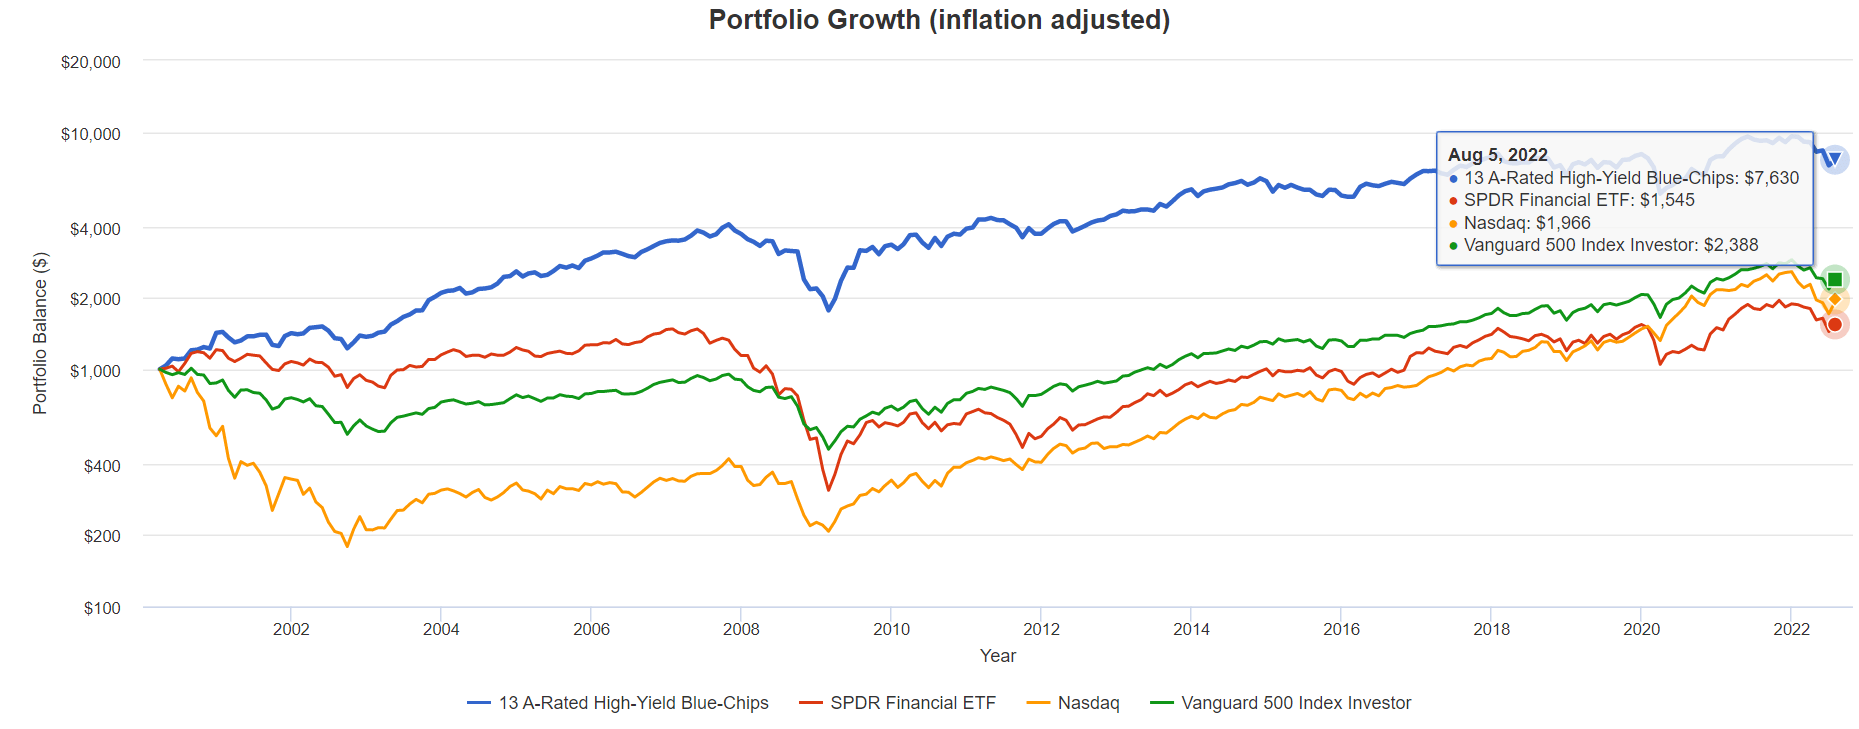
These A-rated blue-chips have delivered almost 8X inflation-adjusted returns over the last 22 years, including this current bear market.
- 5X better returns than US financials
- 4X better than the Nasdaq
- 3X better than the S&P 500
Think it’s impossible for these high-yield blue-chips to beat the market by 3X over the next 50 years? They did it over the last 22 years by focusing on safety and quality first.
- grand slams are the most exciting way to win the World Series
- consistently hitting singles and doubles and striking out the other team is the easiest and highest probability way
(Source: Portfolio Visualizer Premium)
The average one-year return for these A-rated blue-chips is 14% over the last 22 years, higher than the Nasdaq’s 11.5% and 2X that of US financials.
Their average 15-year rolling return is 11.3%, almost 50% better than the S&P 500 and almost 4X higher than US financials.
And let’s not forget about the primary purpose of high-yield investing, dependable income growth!
High-Yield Dividend Growth Blue-Chips You Can Trust
(Source: Portfolio Visualizer Premium) – includes reinvested dividends in USD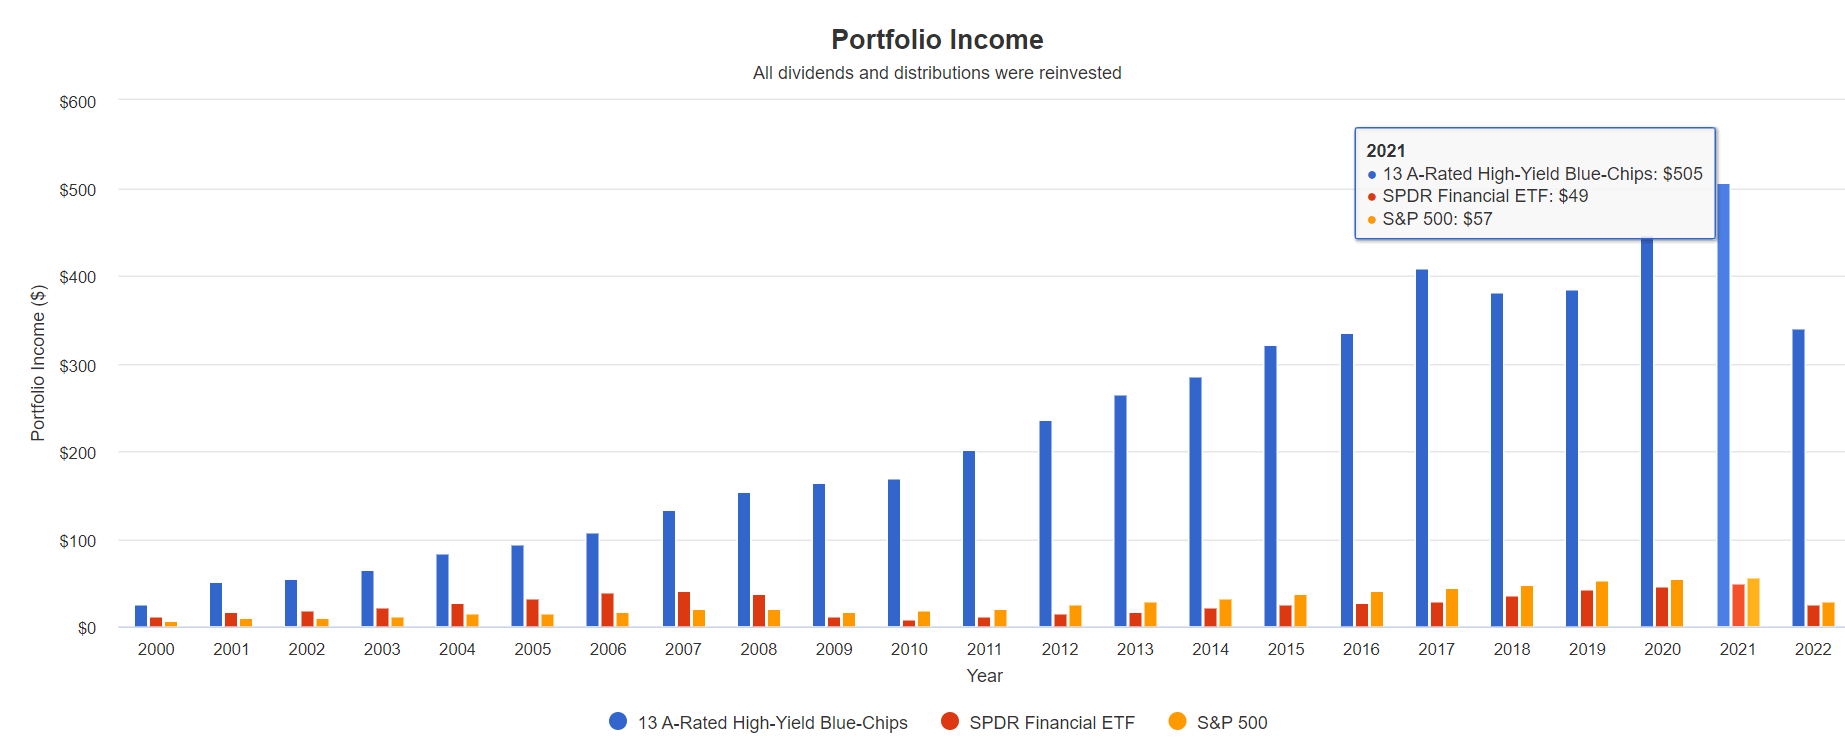
| Portfolio | 2001 Income Per $1000 Investment | 2022 Income Per $1000 Investment | Annual Income Growth | Starting Yield |
2022 Yield On Cost |
| S&P 500 | $10 | $58 | 8.73% | 1.0% | 5.8% |
| SPDR Financial Sector ETF | $17 | $50 | 5.27% | 1.7% | 5.0% |
| 13 A-Rated High-Yield Blue-Chips | $50 | $680 | 13.23% | 5.0% | 68.0% |
(Source: Portfolio Visualizer Premium)
Over the last 21 years, these A-rated high-yield blue-chips delivered over 50% faster annual income growth than the S&P 500 and almost 3X faster growth than US financials.
What about during the Great Recession?
- XLF suffered an 80% income reduction from 2007 to 2010
- these A-rated blue-chips grew their income the entire time, 25% in total
- S&P 500 suffered a 25% dividend cut from 2008 to 2009
- these A-rated blue-chips grew their dividends 7% from 2008 to 2009
Their yield in 2001 was 5%, similar to today’s yield. Their valuations were also similar to today’s dirt cheap. Today they generate a yield on cost of 68%.
A-Rated Blue-Chip Cumulative Dividends Since 2001
| Metric | S&P 500 | 13 A-Rated High-Yield Blue-Chips |
| Total Dividends | $658 | $5,523 |
| Annualized Income Growth Rate | 8.73% | 13.23% |
| Total Income/Initial Investment | 0.66 | 5.52 |
| Inflation-Adjusted Income/Initial Investment | 0.39 | 3.27 |
| More Inflation-Adjusted Income Than The S&P 500 | 8.39 |
(Source: Portfolio Visualizer Premium)
Over the last 21 years, these A-rated high-yield Super SWANs delivered 5.5X your initial investment. That’s 3.3X inflation-adjusted returns and 8.4X more real income than the S&P 500.
What about future income growth?
A-Rated High-Yield Blue-Chip Consensus Future Income Growth Potential
| Analyst Consensus Income Growth Forecast | Risk-Adjusted Expected Income Growth | Risk And Tax-Adjusted Expected Income Growth |
Risk, Inflation, And Tax Adjusted Income Growth Consensus |
| 14.0% | 9.8% | 8.3% | 6.1% |
(Source: DK Research Terminal, FactSet)
Analysts think these 13 A-rated high-yield blue-chips could deliver similar 14% annual income growth in the future, which, adjusted for the risk of the company not growing as expected, inflation, and taxes, is 6.1% real expected income growth.
Now compare that to what they expect from the S&P 500.
| Time Frame | S&P Inflation-Adjusted Dividend Growth | S&P Inflation-Adjusted Earnings Growth |
| 1871-2021 | 1.6% | 2.1% |
| 1945-2021 | 2.4% | 3.5% |
| 1981-2021 (Modern Falling Rate Era) | 2.8% | 3.8% |
| 2008-2021 (Modern Low Rate Era) | 3.5% | 6.2% |
| FactSet Future Consensus | 2.0% | 5.2% |
(Sources: S&P, FactSet, Multipl.com)
- 1.7% post-tax inflation-adjusted income growth from the S&P 500
- S&P 500’s historical post-tax inflation-adjusted income growth rate (current tax code) is 5.8% CAGR
The S&P 500 is now dominated by companies focused primarily on buybacks instead of dividends, which could explain why analysts think future dividend growth will be slower than in the recent past.
What about a 60/40 retirement portfolio?
- 0.5% consensus inflation, risk, and tax-adjusted income growth.
In other words, these A-rated high-yield blue-chips could generate about 3.6X faster real income growth than the S&P 500 and 12X faster income growth than a 60/40.
- and with 3X higher and safer yield on day one
This is the power of high-yield blue-chip investing in a bear market.
Bottom Line: These 13 A-Rated High-Yield Blue-Chips Can Help You Stay Safe And Sane In Any Recession
Don’t get me wrong, Super SWAN (sleep well at night) quality has nothing to do with short-term volatility.
I am not saying that safe A-rated high-yield blue-chips can’t fall if the market tumbles into another leg of this bear market.
What I am saying is that each of these A-rated high-yield blue-chips is a very dependable source of generous safe and steadily growing income over time.
- 4.7% yield = 3X more than the S&P 500 and 2X more than the dividend aristocrats
- stronger credit ratings than the aristocrats (and 70% lower fundamental risk according to S&P)
- 8.2% long-term growth potential and 12.9% long-term total return potential
- similar to the returns and growth rates of the last 22 years
We might still avoid a recession in 2023, but it would take the Fed threading a challenging needle.
- supply chains would have to sort themselves out rapidly
- inflation would have to fall quickly from now on
- and the strong job market would have to keep consumer spending strong enough to survive the fastest Fed tightening cycle in 40 years
A soft landing isn’t impossible; it’s just improbable. Further declines in the market aren’t impossible; they are just highly unlikely given what’s likely coming in terms of rate hikes.
But do you know what doesn’t have to worry about recessions or what the Fed is doing? Investors who own these A-rated high-yield blue-chips.
Do you know how you can sleep well at night and retire in safety and splendor no matter how many recessions we get in the coming years and decades? By focusing on safety and quality, prudent valuation, and sound risk management always.
If you focus on rock-solid fundamentals, you never have to pray for luck on Wall Street; you’ll make your own.
Luck is what happens when preparation meets opportunity. – Seneca the younger
ALIZY, MFC, BNS, MURGY, CM, SLF, VFC, BMO, TD, FRT, SIEGY, NTIOF, and MMM represent 13 great ways to make your own luck in the stock market today.
Not to try to score a quick 29% or 36% gain in 12 months, though these A-rated blue-chips have the potential to do that.
These are the kinds of world-class quality dividend blue-chips that can help you enjoy safe fat yield today but, more importantly, enjoy 20X real returns in the coming decades.
Or, to put it another way, they are a very low-risk way to retire in safety and splendor.
Be the first to comment