

2022 is already a great year for bargain hunters. Terrible year for investors who blindly gambled away their savings. Anastasiia Stiahailo/iStock via Getty Images
Get ready for charts, images, and tables because they are better than words. The ratings and outlooks we highlight here come after Scott Kennedy’s weekly updates in the REIT Forum. Your continued feedback is greatly appreciated, so please leave a comment with suggestions.
Some investors hate all high-yield stocks. We don’t. There are good and bad opportunities within the space. So long as we know how to tell the difference, it can be quite an appealing area for investment. We’re going to share several picks that are currently at huge discounts to our targets.
New Residential
New Residential (NRZ) is on a monster sale, as we said in a recent trade alert:
NRZ’s share price got wrecked. It was holding up reasonably well amid the turmoil in the market for a few months. That made sense, given the strong Q1 2022 results and the extremely positive commentary from the earnings call.
The last 7 days (starting Friday of last week) have been a difficult period for mortgage REIT fundamentals with MBS (mortgage-backed securities) prices falling harder than Treasuries. However, there is an ocean of differences between the damage created in the bond markets and the damage seen in share prices. It isn’t even remotely close.
Remember that so far NRZ has performed quite well against rising rates. Higher rates are difficult for mortgage originations but great for MSR values, which was a big factor for NRZ.
In general, a wider spread between Treasuries and MBS results in lower book values. However, it also means a mortgage REIT can deploy capital more effectively to generate higher returns from their portfolio for each dollar of equity. We refer to this as “widening”.
In theory, investors should be willing to pay higher price-to-book ratios after widening occurs and lower price-to-book ratios after tightening. In practice, investors get it wrong and often do the opposite. That’s when we get really excited about the opportunities.
Some mortgage REITs like NRZ hedge more of the interest rate exposure on their MBS using MSRs (mortgage servicing rights). The math on hedging with MSRs can be more complicated, but it is intended to reduce the exposure to the spread between MBS and Treasuries or interest rate swaps while protecting the mortgage REIT from higher rates.
NRZ has been absolutely wrecked over the last week and we believe the market is precisely wrong about NRZ. We’re backing up that view with a significant investment. We bought another 3,358 shares today. That’s worth about $27,703 at today’s closing price of $8.25 (6/16/2022, when this is prepared rather than 6/17/2022 when it will likely be published). If we’re wrong, this article certainly wouldn’t be enough to cover my losses. Are we wrong? Probably not. It hasn’t happened often. Well, it hasn’t happened often in stock analysis. I’m wrong about other things all the time. Fortunately, I don’t need to be a jack of all trades to succeed.
Do you like analysts who post ratings but don’t have the conviction to buy something they just called out as a strong buy? Me neither. That purchase brings our total up to 7,930 shares of NRZ.
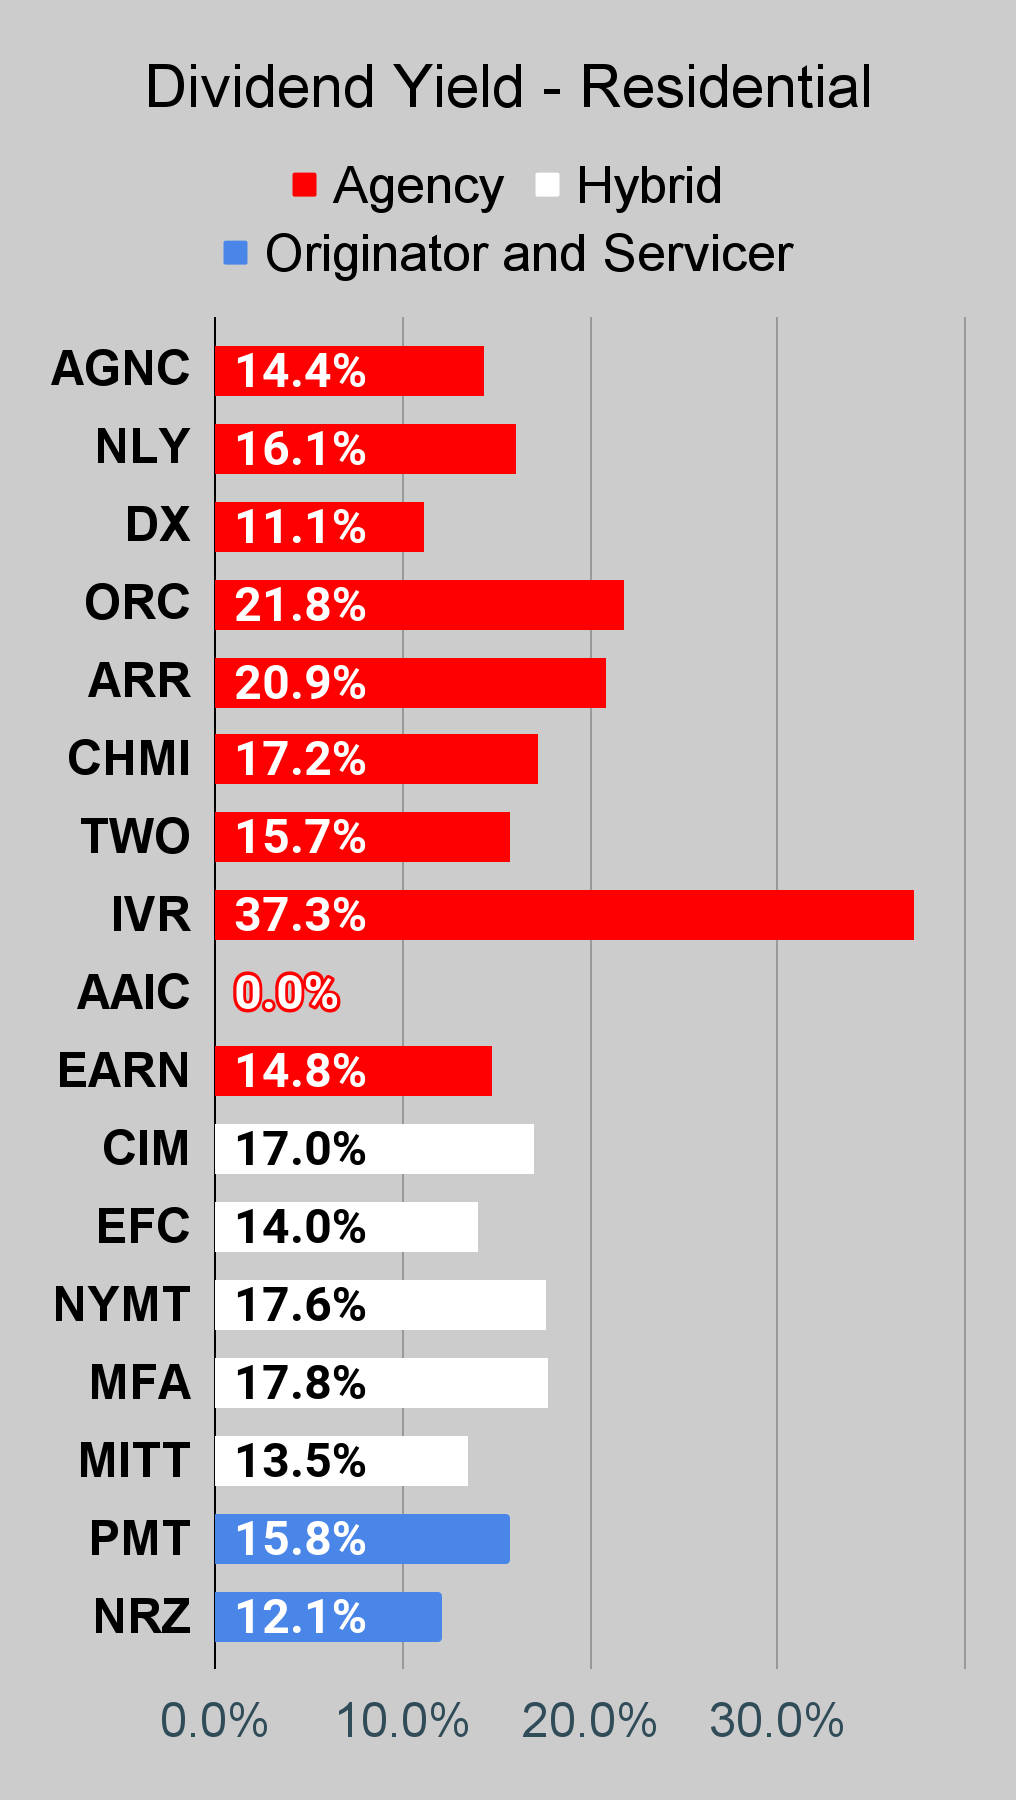
NRZ trades at a price-to-estimated book ratio of .62, using our estimates from last weekend. Even if book value took a hit this week, it would still be a huge discount. For NRZ, that’s an unusually large discount. NRZ comes with a 12% dividend yield. That yield might be increased, though I’d be interested in seeing NRZ simply use any excess capital to buy back shares at these prices.
Ready Capital
Ready Capital (RC) is another good mortgage REIT. Steady book value per share and they performed well in prior quarters against a backdrop of rising rates. Much like NRZ, RC’s share price got obliterated over the last week.
Let’s take a quick look at some highlights from Q1 2022. As you may recall, Q1 2022 also saw rising interest rates and widening spreads between MBS and other interest rates. Was Ready Capital a winner?
Book value per share was $15.22, which was down from $15.35 at the end of Q4 2021. However, it was up from $15.06 at the end of Q3 2021. Given the incredibly difficult market for mortgage REITs during that time, RC sure looks like a winner.
What else did they do?
Ready Capital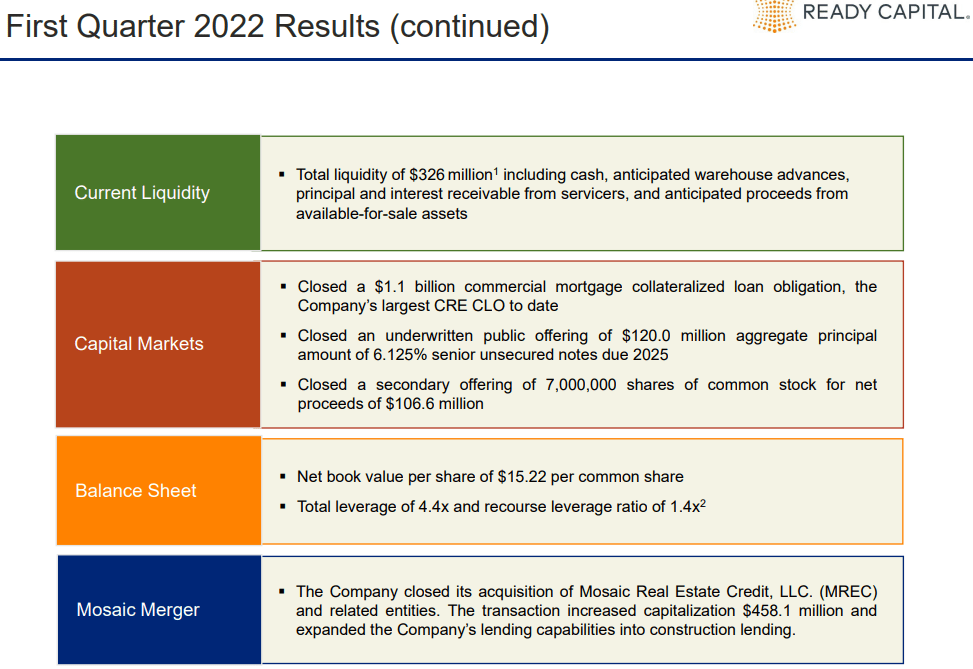
Two things I really want to emphasize there. The company closed another $1.1 billion CRE CLO.
Why does that matter? It means they took more of their assets and transferred them into a CLO (collateralized loan obligation) structure.
Why does that matter? That’s how they have been reducing recourse leverage. While total leverage was 4.4x, recourse leverage was only 1.4x. That’s down from recourse leverage of 2.7x at the end of Q4 2021.
Why do I keep talking about recourse leverage? Remember the pandemic. Remember the financial crisis as liquidity suddenly dried up? That was a problem because a lender could claim market value dropped or that they suddenly needed to keep more capital on hand. By using these CLOs, if someone calls asking for more collateral RC could simply hang up the phone. That’s the “non” in “non-recourse”. Ready Capital will still see that the investors get their cash flows, but they don’t get to change the terms. Plenty of investors will agree to those terms during good economic times because they get a higher return for bearing part of the risk. However, it’s great for the REIT because it eliminates the risk of a lender looking to change the terms or claiming asset values fell to an unrealistic degree.
That financial crisis was a call for mortgage REITs with less liquid assets to look for long-term financing options for those assets. A few mortgage REITs, (which does not include RC), took big losses when banks decided that if they dumped assets quickly enough it would result in a price low enough to justify selling the asset. These banks were “looking out for their own shareholders”, but they also taught their customers the importance of not doing business with that bank.
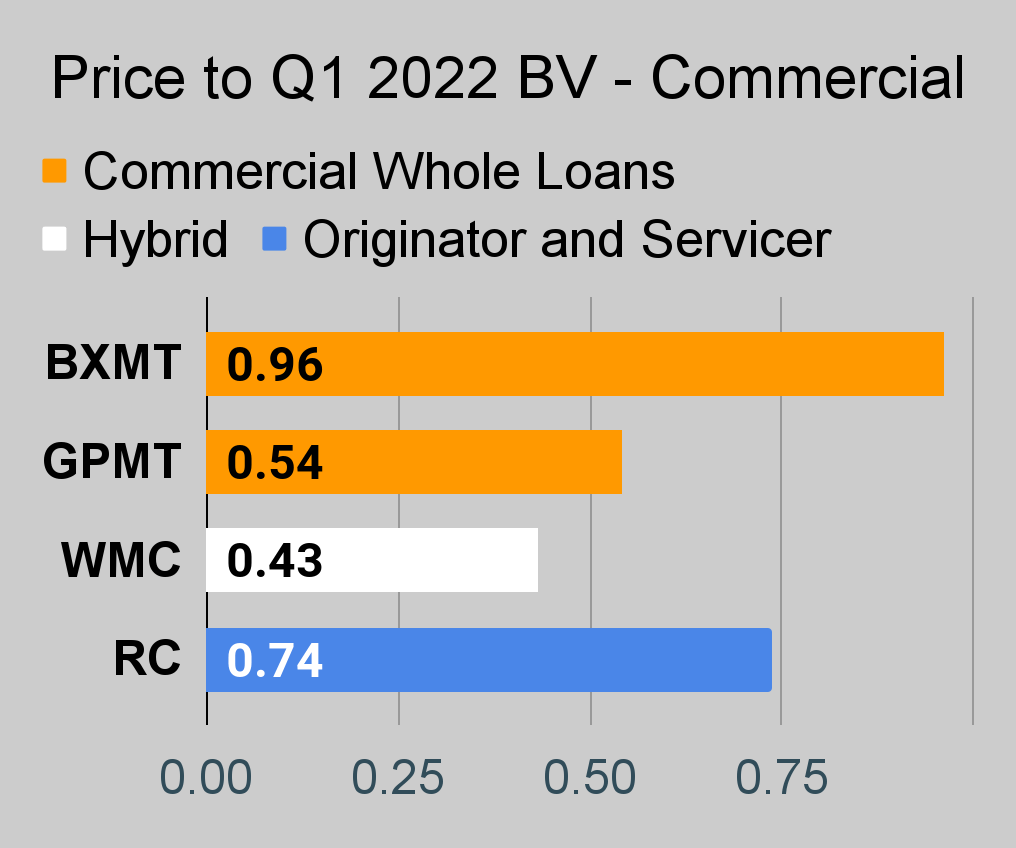
RC trades a price-to-book ratio of .75, using our estimates from last weekend.
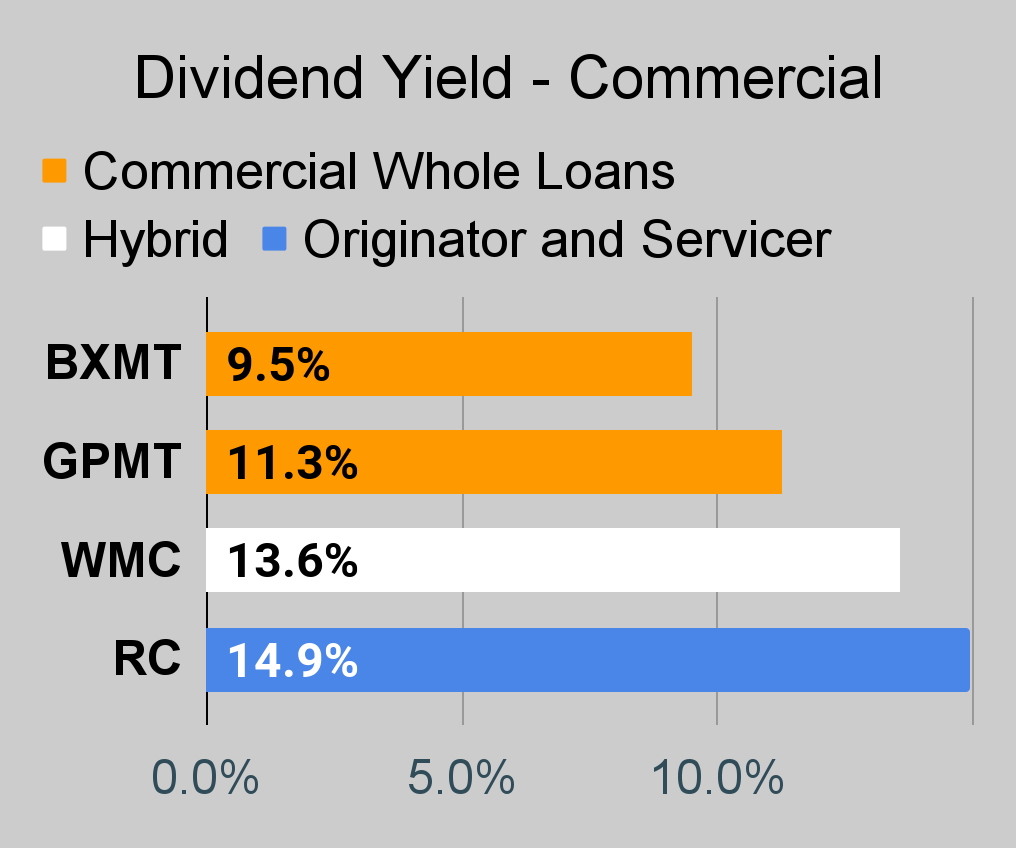
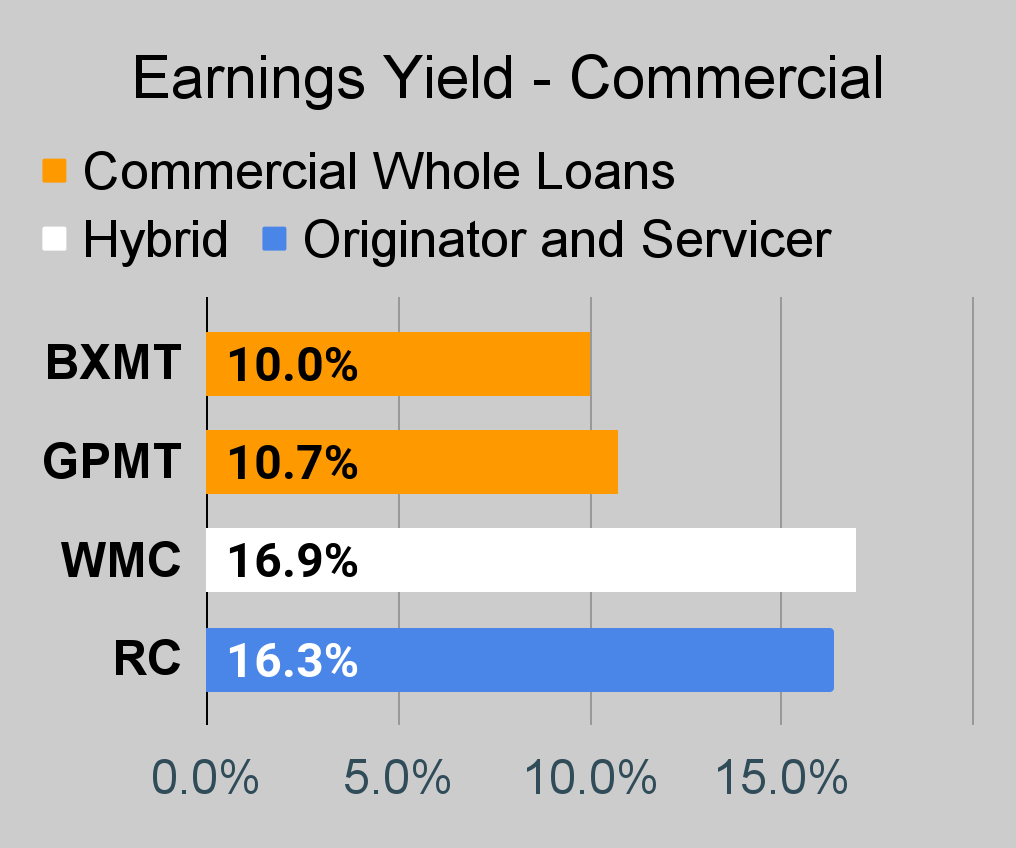
Think RC is about to slash their dividend? Probably not, they declared the same $.42 quarterly dividend rate Wednesday. They knew all about the current bond market when they made that decision. That $.42 per quarter dividend turns into a 14.9% annualized yield.
MFA Financial
MFA Financial (MFA) got demolished as well, though they didn’t just get smacked down in about one week. They were suffering a bit before this as their share price plunged dramatically further than their projected book value. We were previously bearish on MFA quite a few times because we didn’t like the high price-to-book ratio. A high price-to-book ratio didn’t leave a suitable margin of safety. Of course, we think about the margin of safety across multiple quarters, not about a one-week change in price. Now MFA Financial trades a .58 price-to-book ratio, using the estimates from last Friday. Since rates climbed so much, that book value could be down a bit. We’ll see when Scott does the next weekly updates. However, the ratio is still incredibly low.
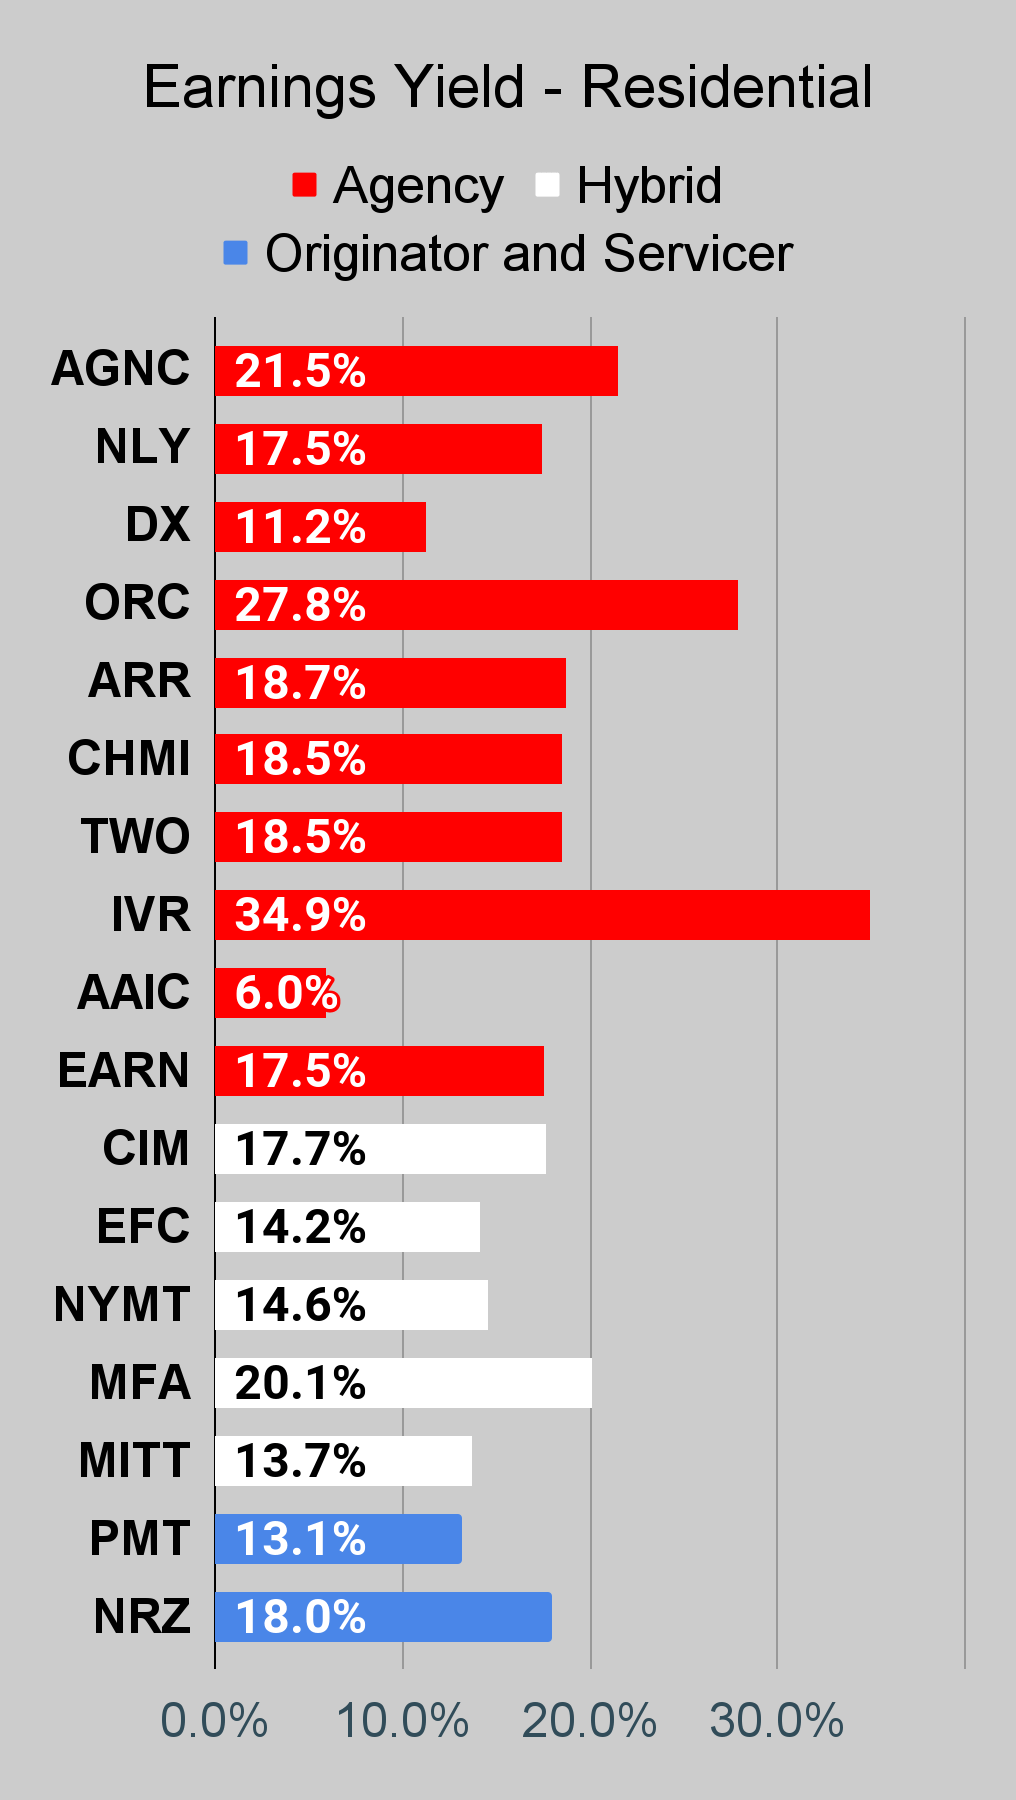
MFA Financial also carries a 17.8% dividend yield. Now, we should point out that anything near 18% is incredibly high. However, the dividend yield is only 10.2% on that projected book value. Earning 10.2% on book value is not unreasonable. Earning 18% isn’t going to happen sustainably, but 10.2% is much more reasonable.
For the guy who says MFA is about to chop their dividend, we would remind him that MFA declared the same $.44 per share dividend on Wednesday. They do take on some credit risk and some interest rate risk, which isn’t a great look right now. However, the discount to book value is absolutely massive and it’s creating an attractive risk/reward profile.
TriplePoint Venture Growth
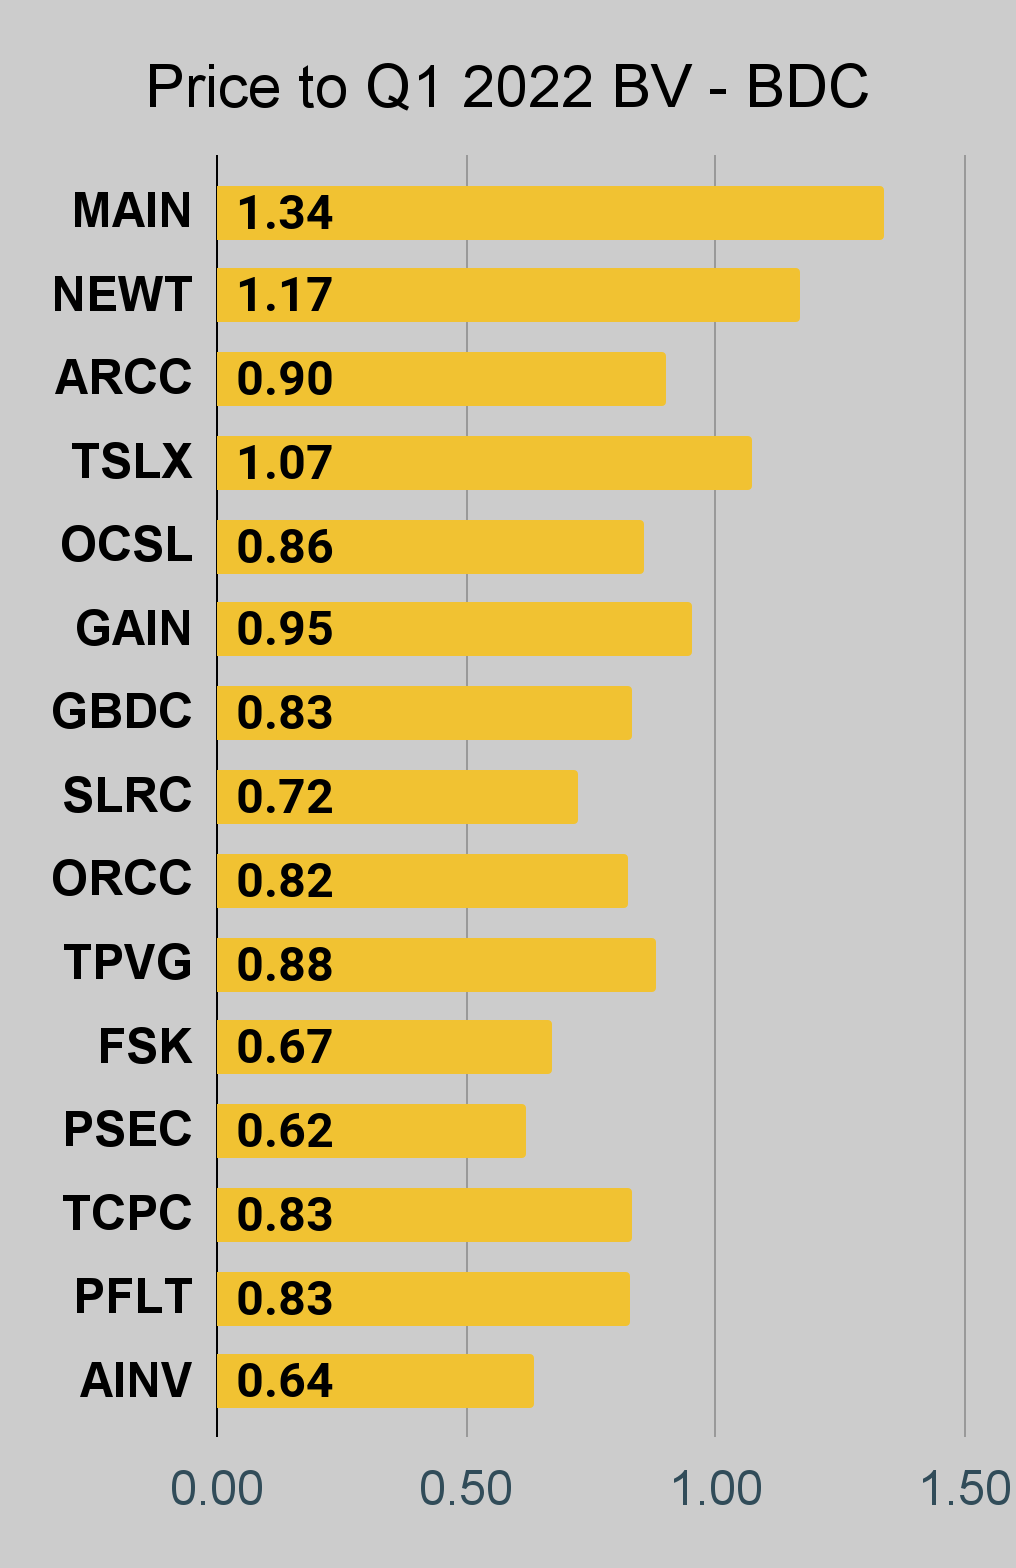
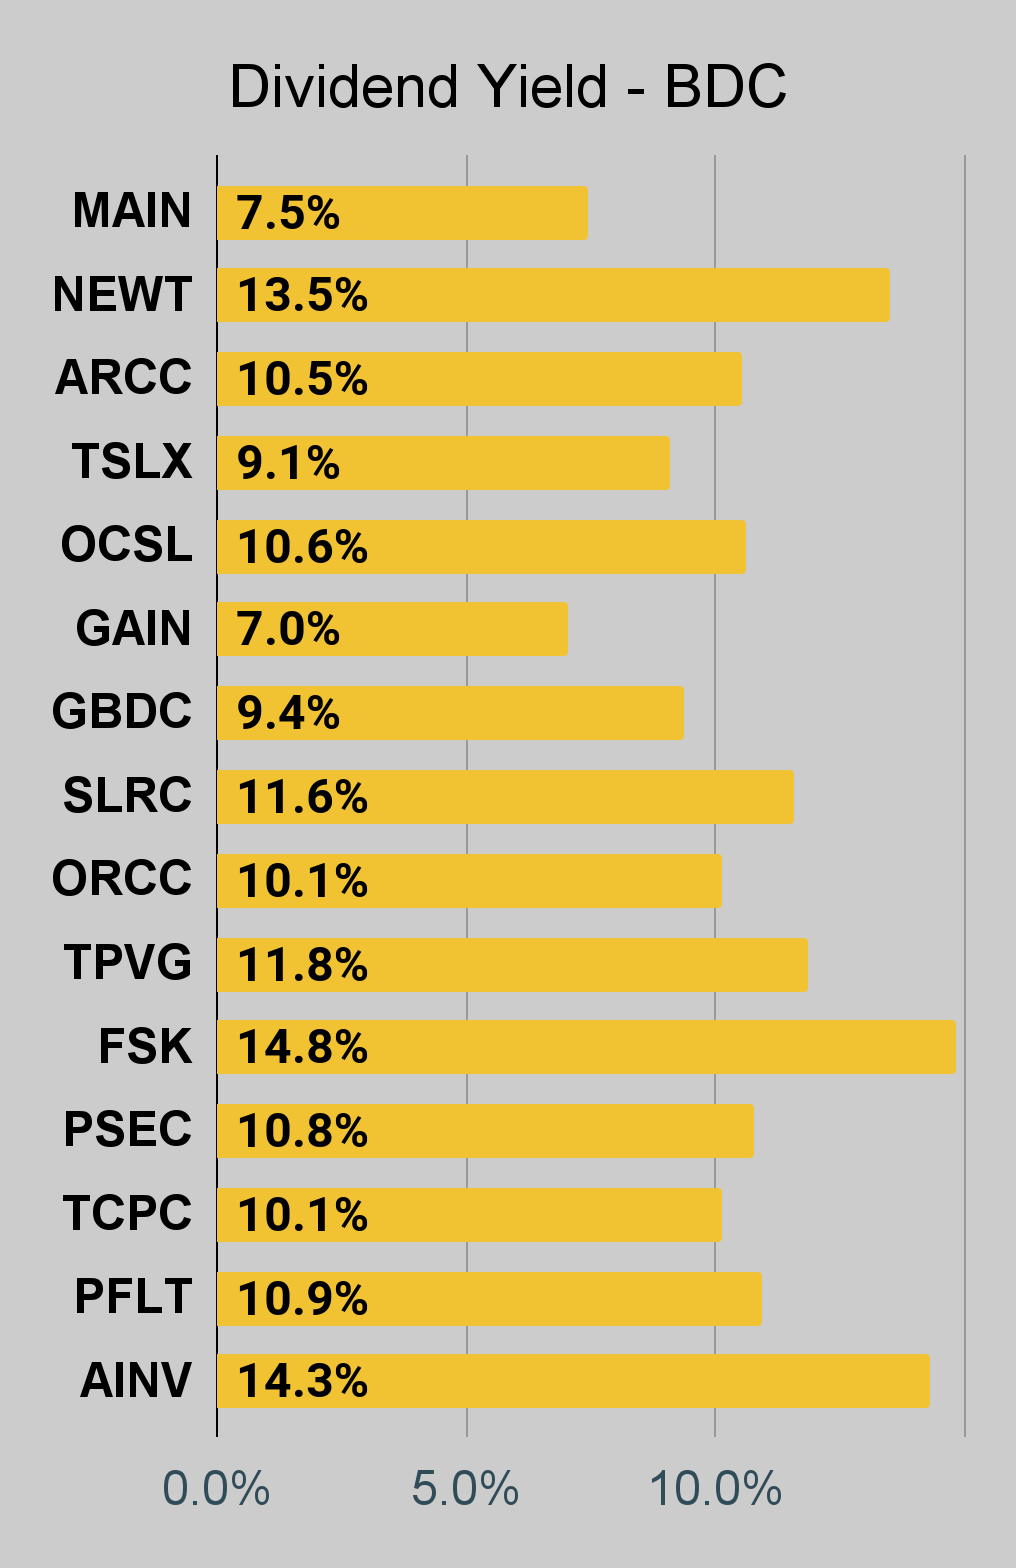
Thought the BDCs were just there to look pretty in the chart? Nope! TPVG trades at a price-to-book ratio (using our estimates) of .89 and carries an 11.8% dividend yield. Think an 11% discount to book value isn’t enough? For TPVG, that’s a big discount. Shares have regularly traded at a premium to book value since the start of 2021:
The REIT Forum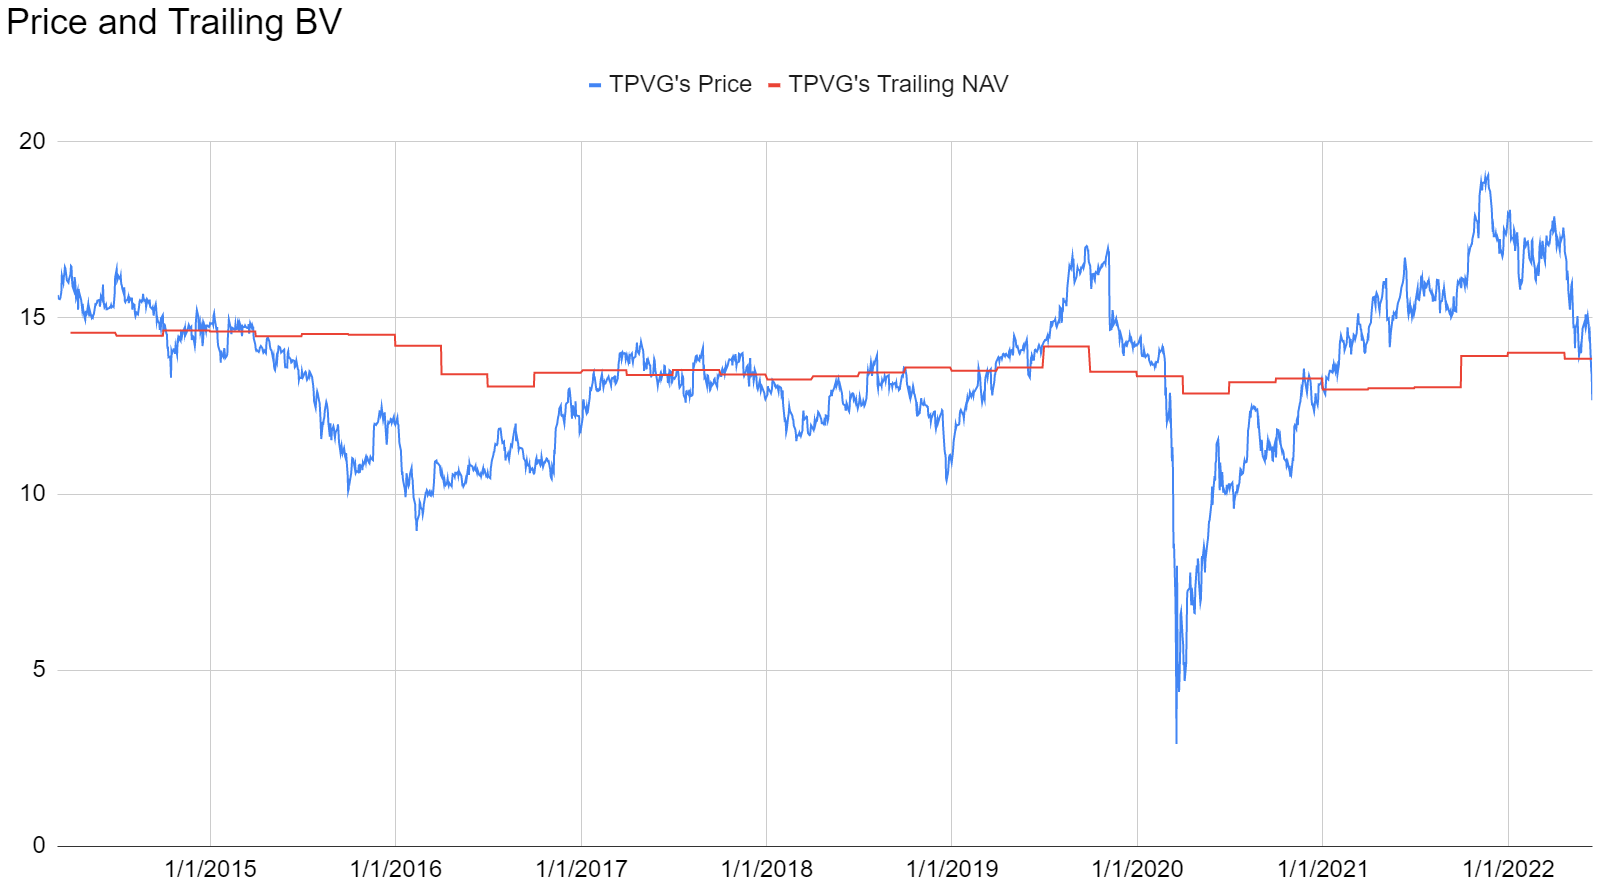
Shares were lower during 2020 while the financial markets were struggling, but they bounced back hard. Meanwhile, the BDC was able to keep NAV relatively stable throughout that period. It’s a bit lower than it was in 2014, but that’s solid for paying out a big dividend.
Dynex Capital
Dynex Capital (DX) joined the sale as well. The discount to book value is smaller as investors seem to have finally grasped that DX deserves as a spot as ‘Best of Breed’ in the agency mortgage REIT space. They outperformed by a substantial margin over the last few years and management has been adamant about controlling risk levels and protecting capital with an eye on rising rates and wider spreads. They correctly predicted the scenario that has been unfolding so far in Q2 2022. By our estimates, the current price (from 6/16/2022) is about a 20% discount to the book value as of the end of last week. That’s a .80 price-to-estimated-book ratio.
Of course, our estimates cannot be perfect. Historically, we’ve been pretty good on our predictions. Even if the current week was rough, it would still be a major discount. Meanwhile, DX also carries an 11% dividend yield.
I’ll bring investors back to this exchange from the Q1 2022 earnings call, where Byron Boston took a few questions about the dividend rate:
Seeking Alpha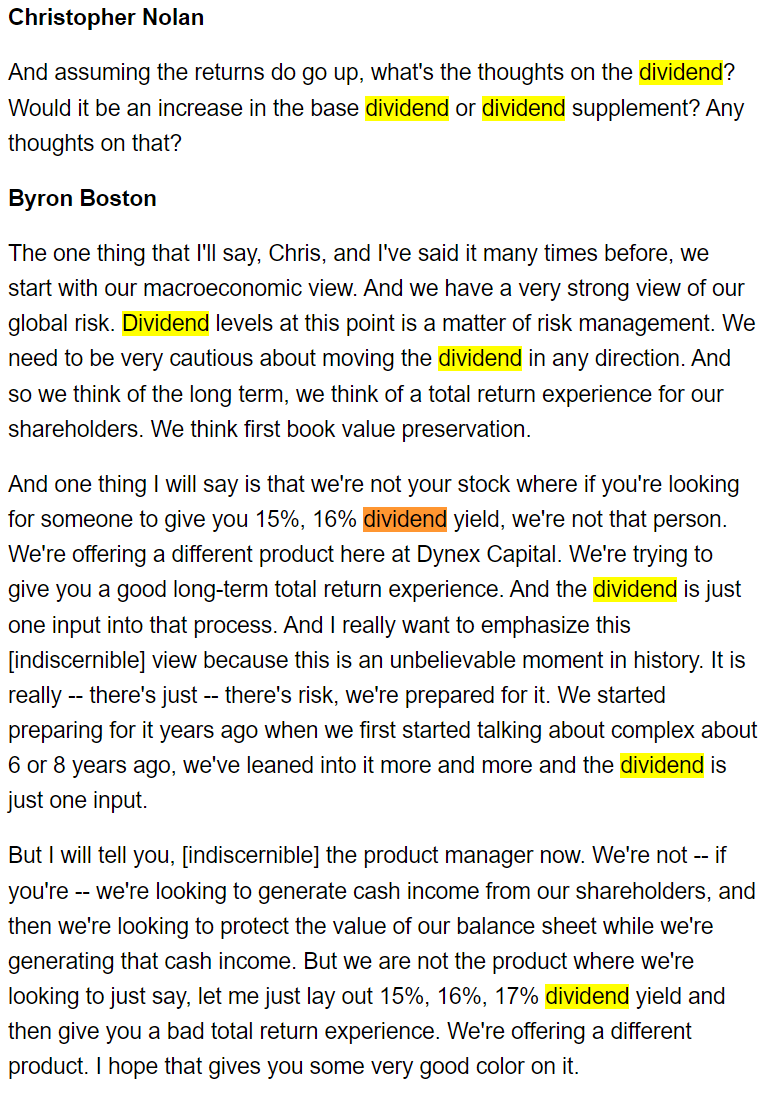
The emphasis has clearly been on managing risk levels as DX was preparing for this environment. They explicitly avoided taking on extra risk to ramp up dividends because they knew the spreads at the time were not wide enough.
They explicitly projected this widening of spreads:
We’ve done a good job of preserving our shareholders’ capital to date, and it is important to understand that at current levels of returns, we believe we can quickly earn back any incremental book value declines. This is supported by the significant dry powder that we have to invest. We are positioned with over $500 million in available liquidity.
Our decision to deploy capital will be driven by 2 factors. First, our view of the overall macroeconomic environment, which we still believe to be vulnerable to unexpected shocks. This necessitates prudent decisions on leverage. And second, the overall level of mortgage spreads which, while already attractive today, may provide better opportunities at the wider spread levels that we expect.
Given that commentary, it’s probably not surprising that our models show DX navigating the quarter better than many of their peers.
Next Update
We will have another update on The REIT Forum soon (probably Sunday or Monday) with the adjustments for the volatility in bond markets this week. When the volatility picks up, those updated estimates are even more valuable.
It’s been a long time since we had this many bullish ratings. Sometime in 2020? We don’t get excited and push targets up simply because prices are high. We don’t shove them down just because prices are low. Targets should be driven by a sense of the real underlying value. Sometimes that means being heavily bullish and other times it means being heavily bearish.
We don’t know what day things will turn around in the sector. Maybe entry prices will get even better over the next week or the next month. However, we can be confident that the risk/reward is already quite favorable and we’re happy to put our capital to work.
The rest of the charts in this article may be self-explanatory to some investors. However, if you’d like to know more about them you’re encouraged to see our notes for the series.
Stock Table
We will close out the rest of the article with the tables and charts we provide for readers to help them track the sector for both common shares and preferred shares.
We’re including a quick table for the common shares that will be shown in our tables:
Let the images begin!
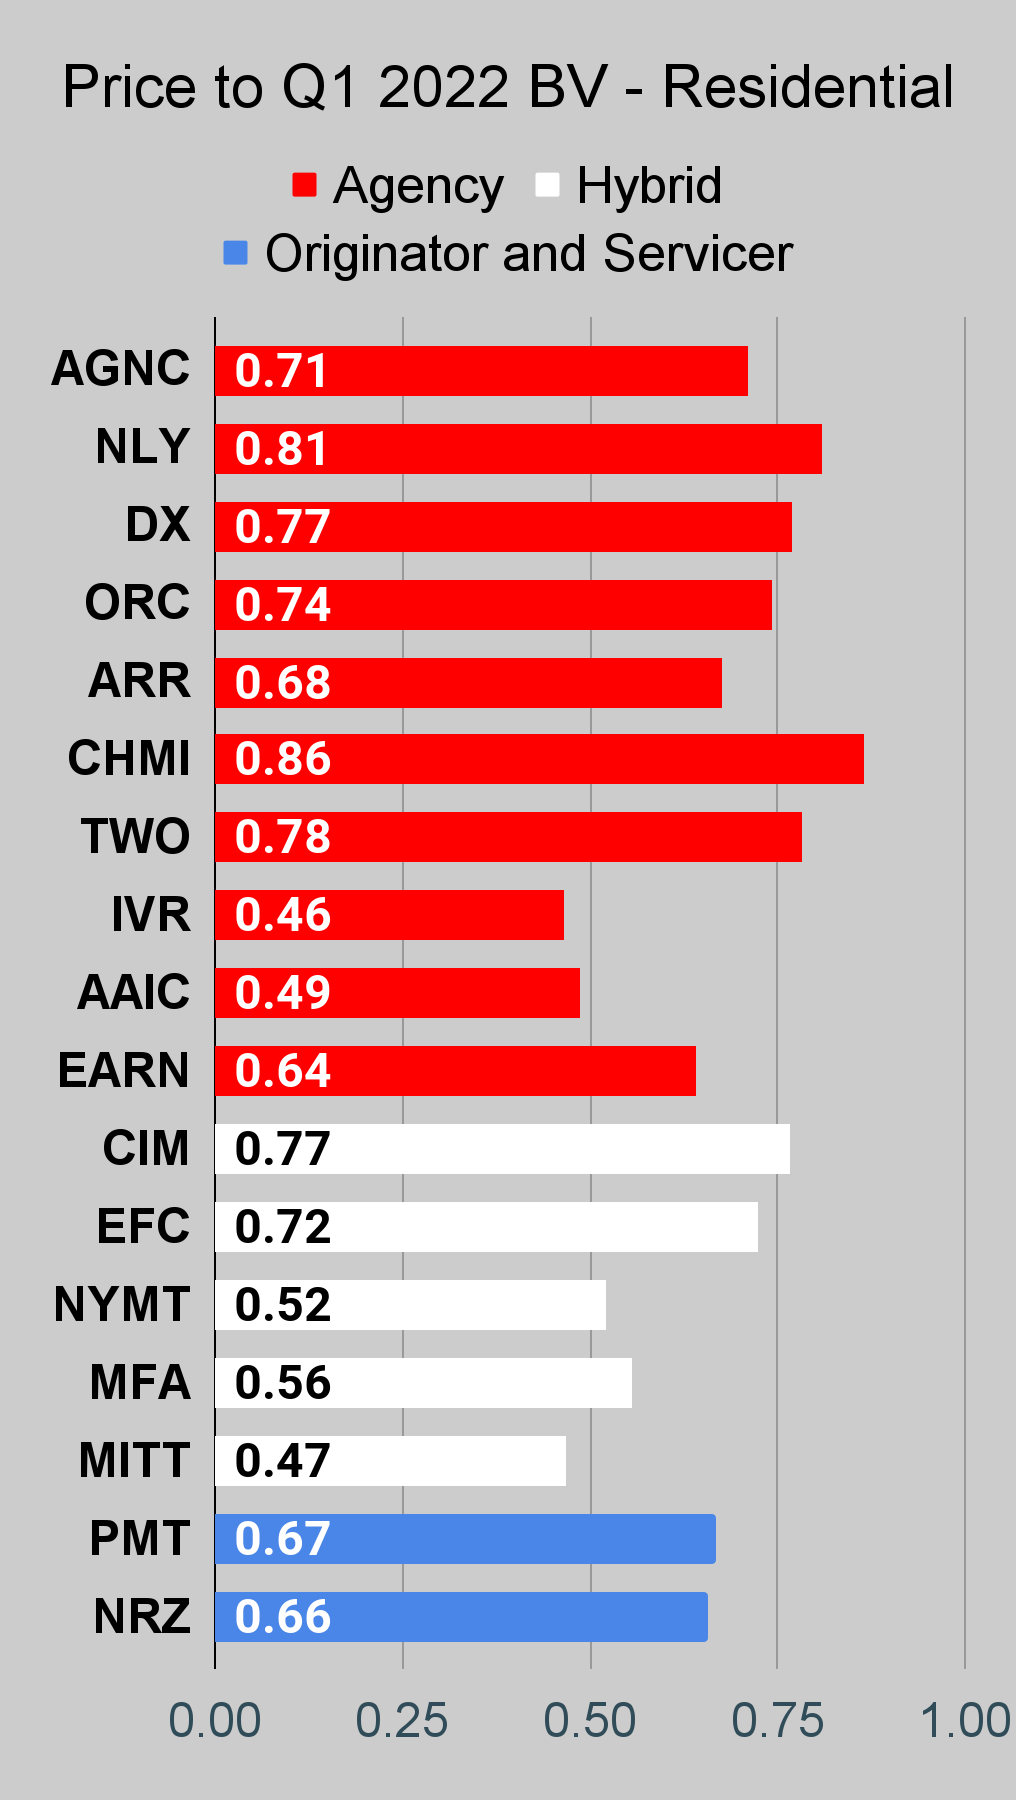
Residential Mortgage REIT Charts
Note: The chart for our public articles uses the book value per share from the latest earnings release. Current estimated book value per share is used in reaching our targets and trading decisions. It is available in our service, but those estimates are not included in the charts below.
 The REIT Forum |
 The REIT Forum |
 The REIT Forum |
Source: The REIT Forum
Commercial Mortgage REIT Charts
 The REIT Forum |
 The REIT Forum |
 The REIT Forum |
BDC Charts
 The REIT Forum |
 The REIT Forum |
 The REIT Forum |
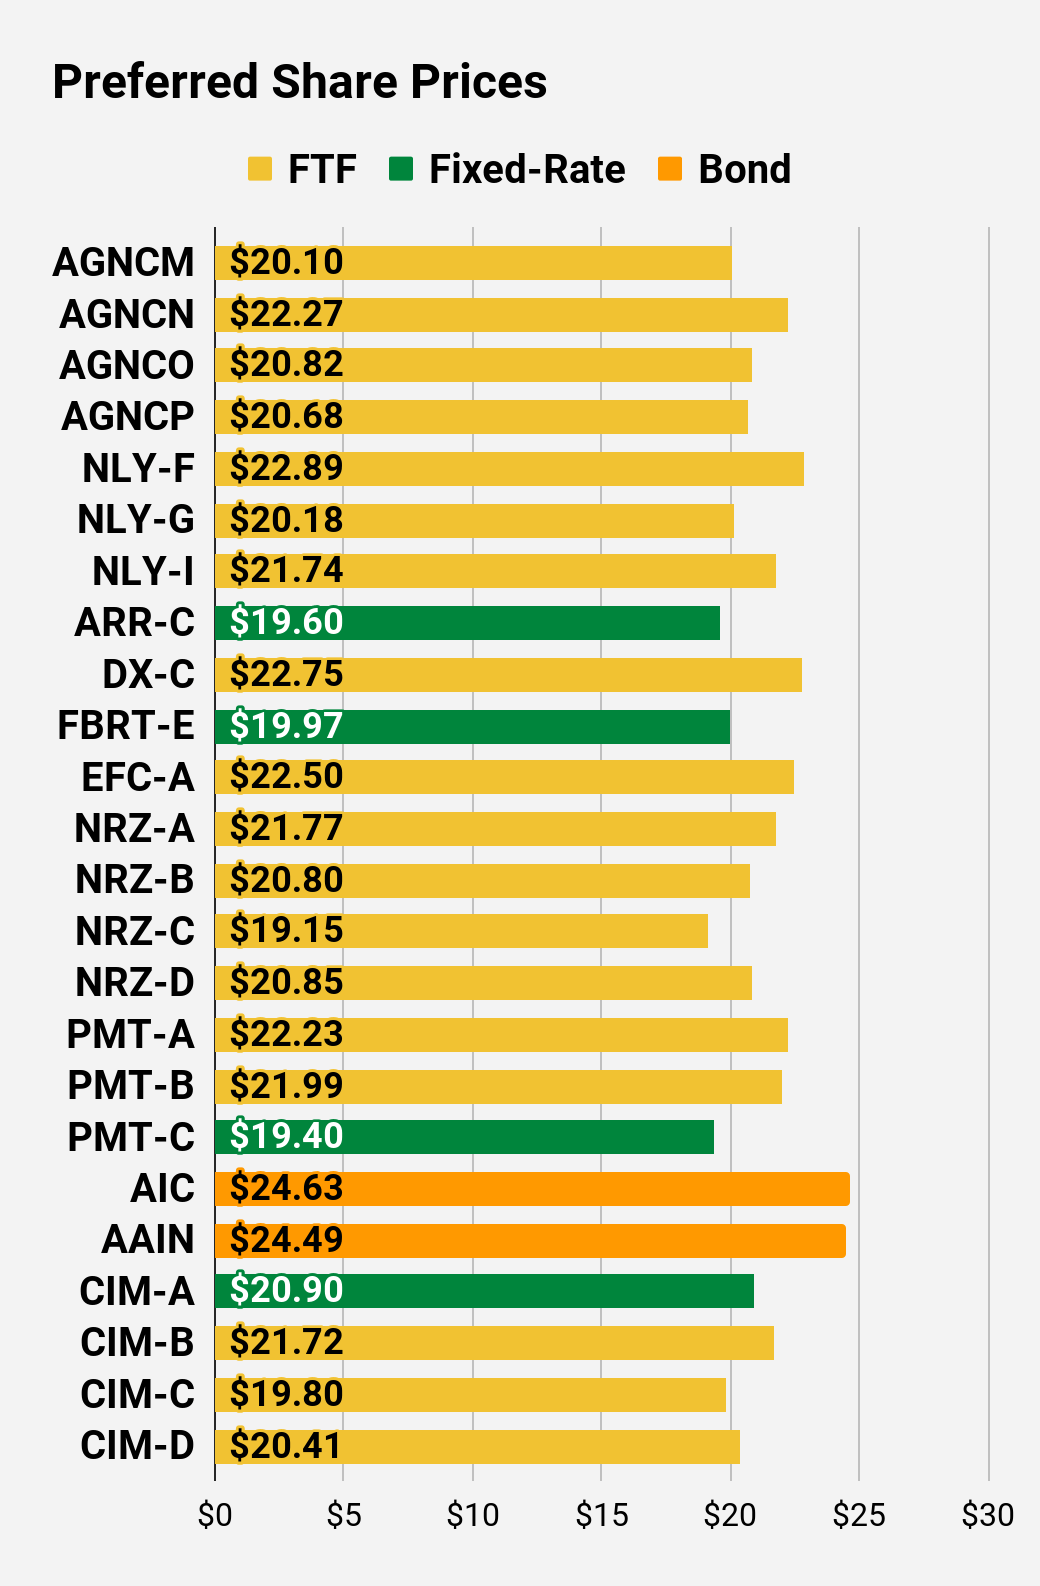
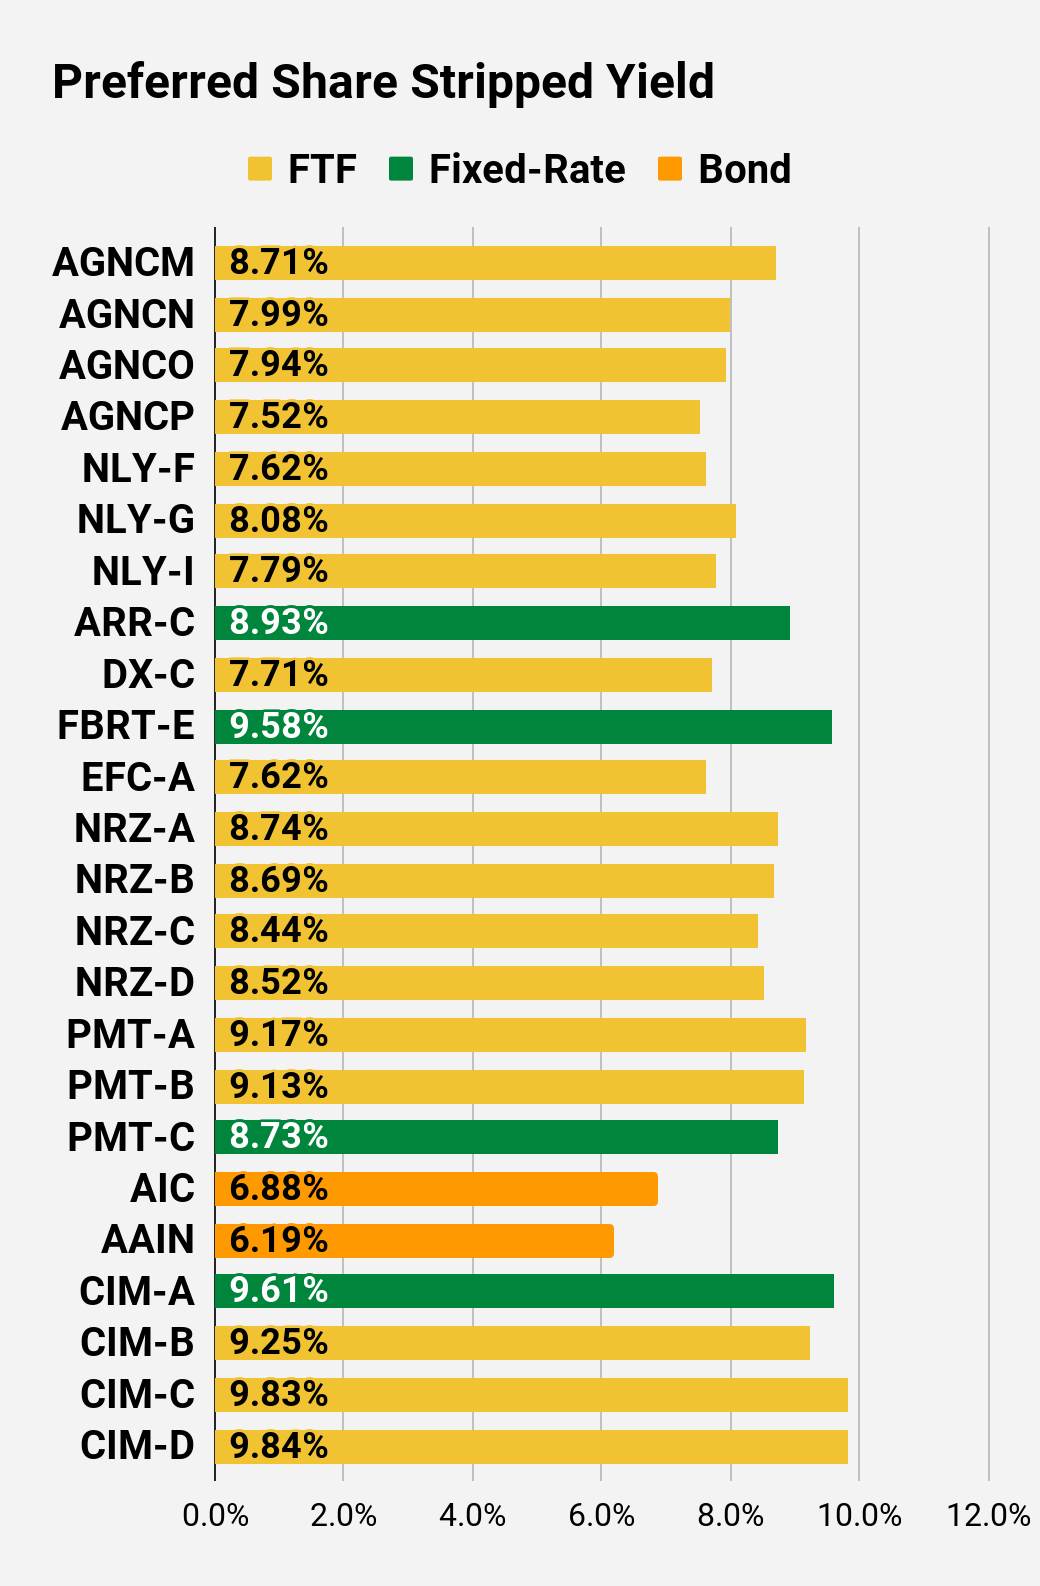
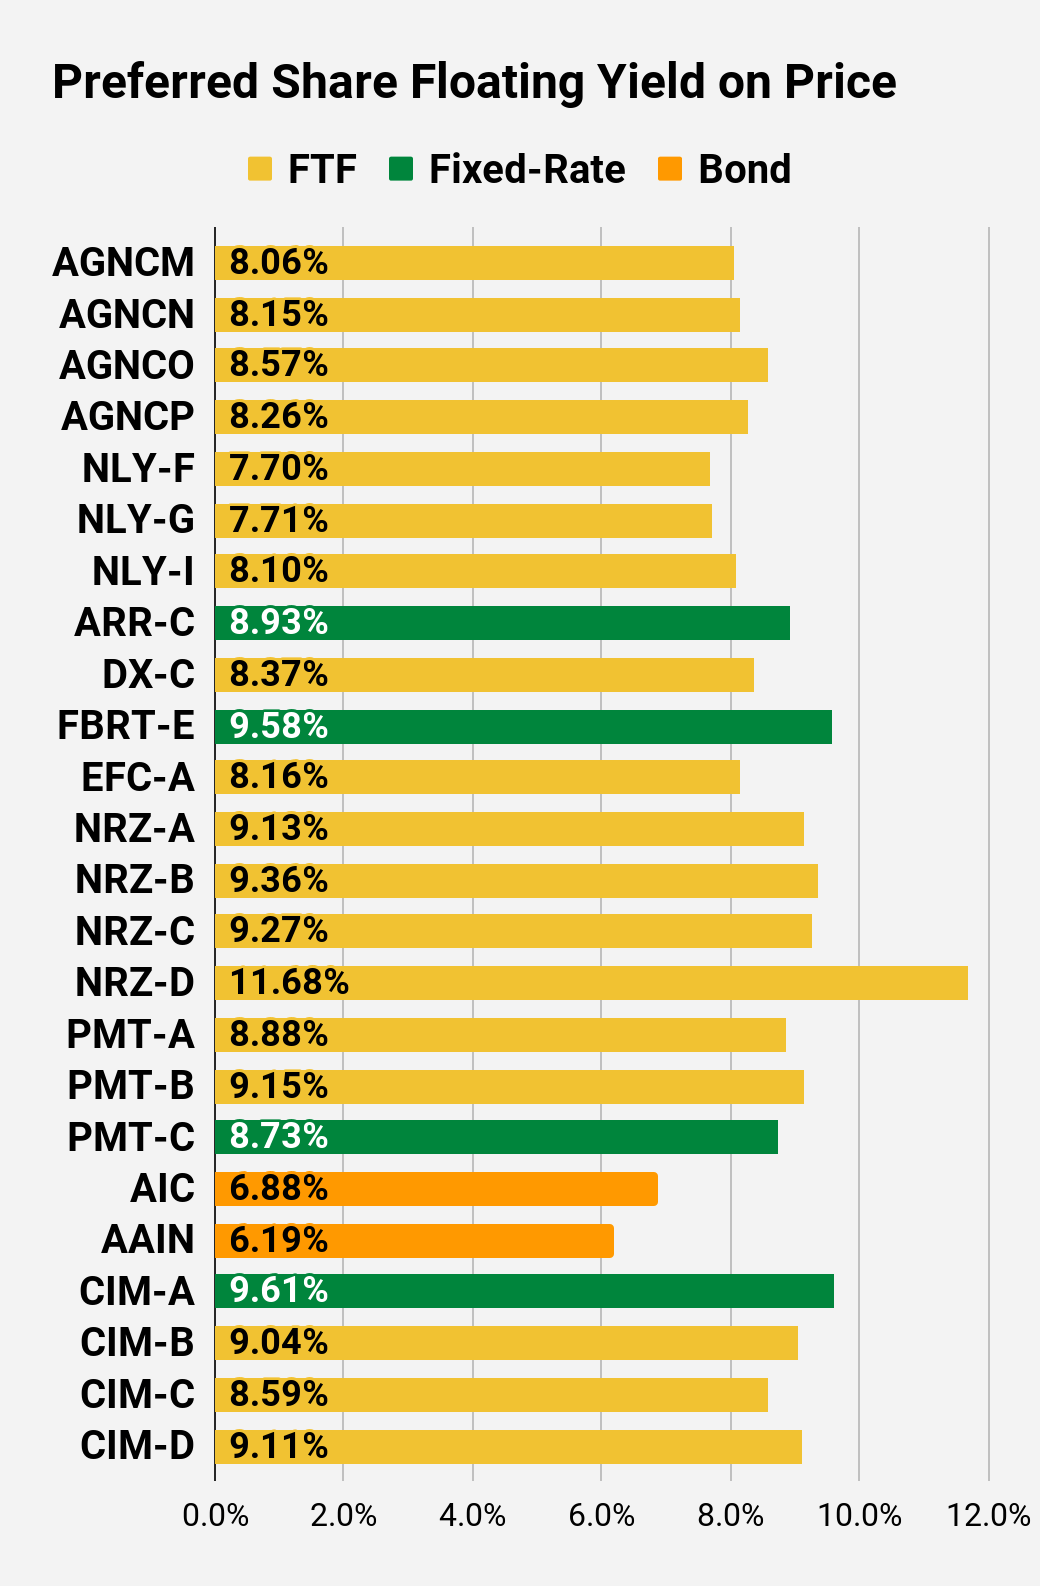
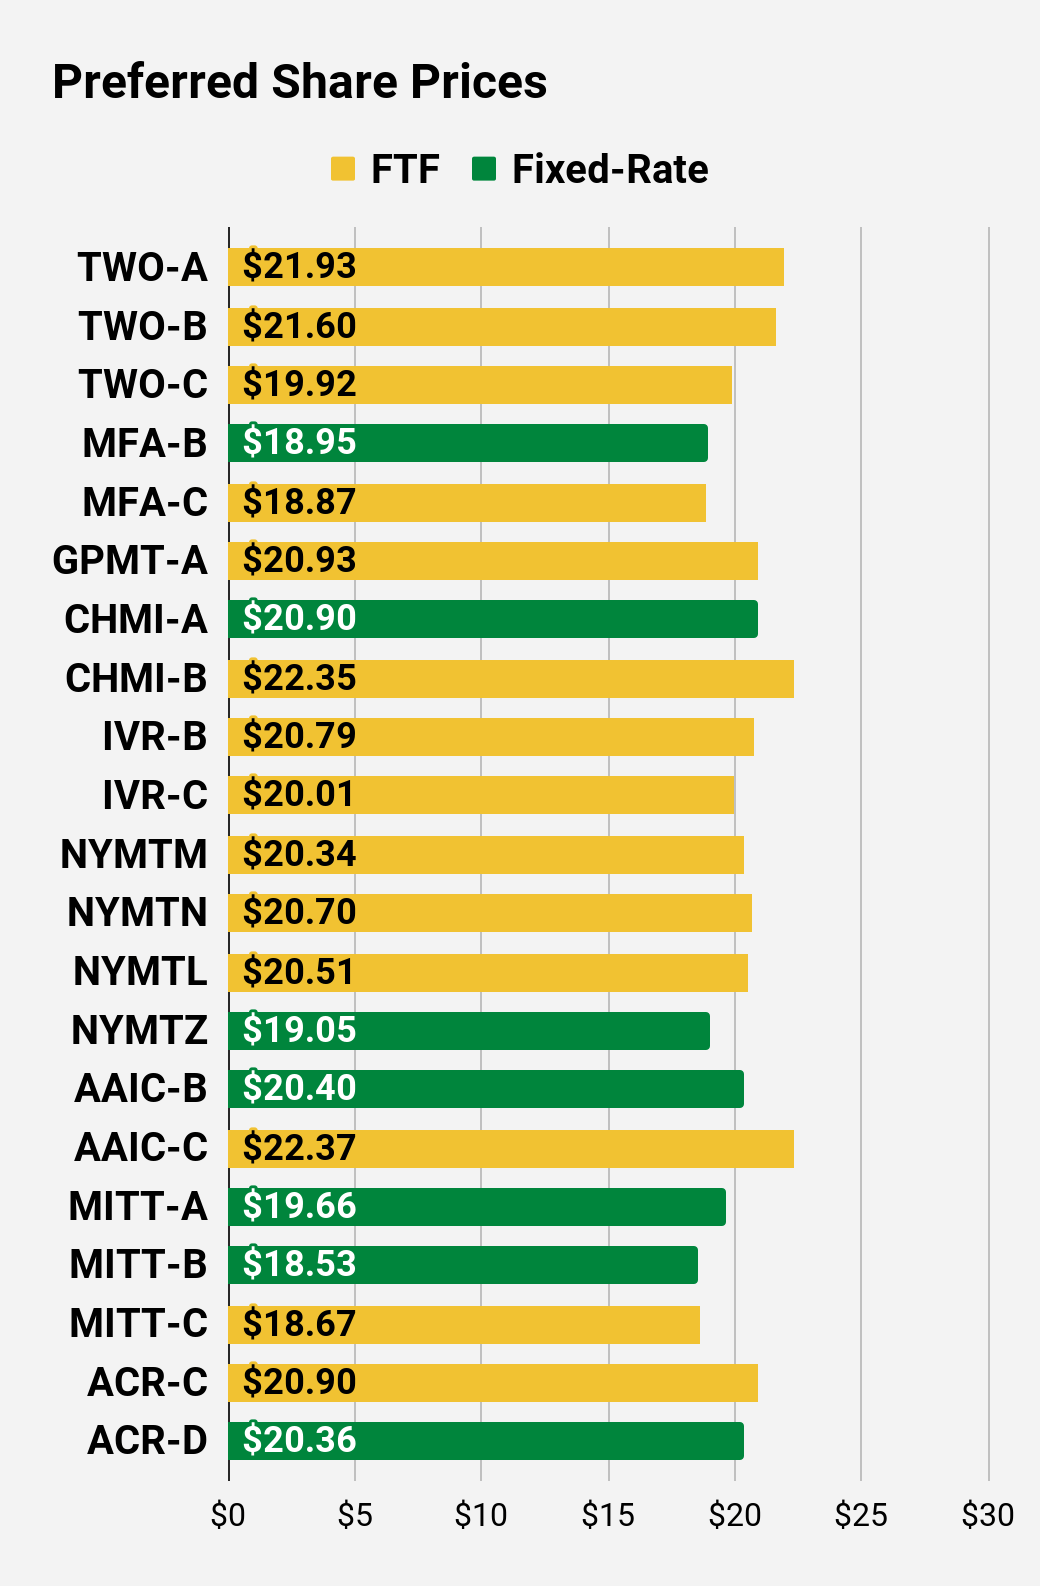
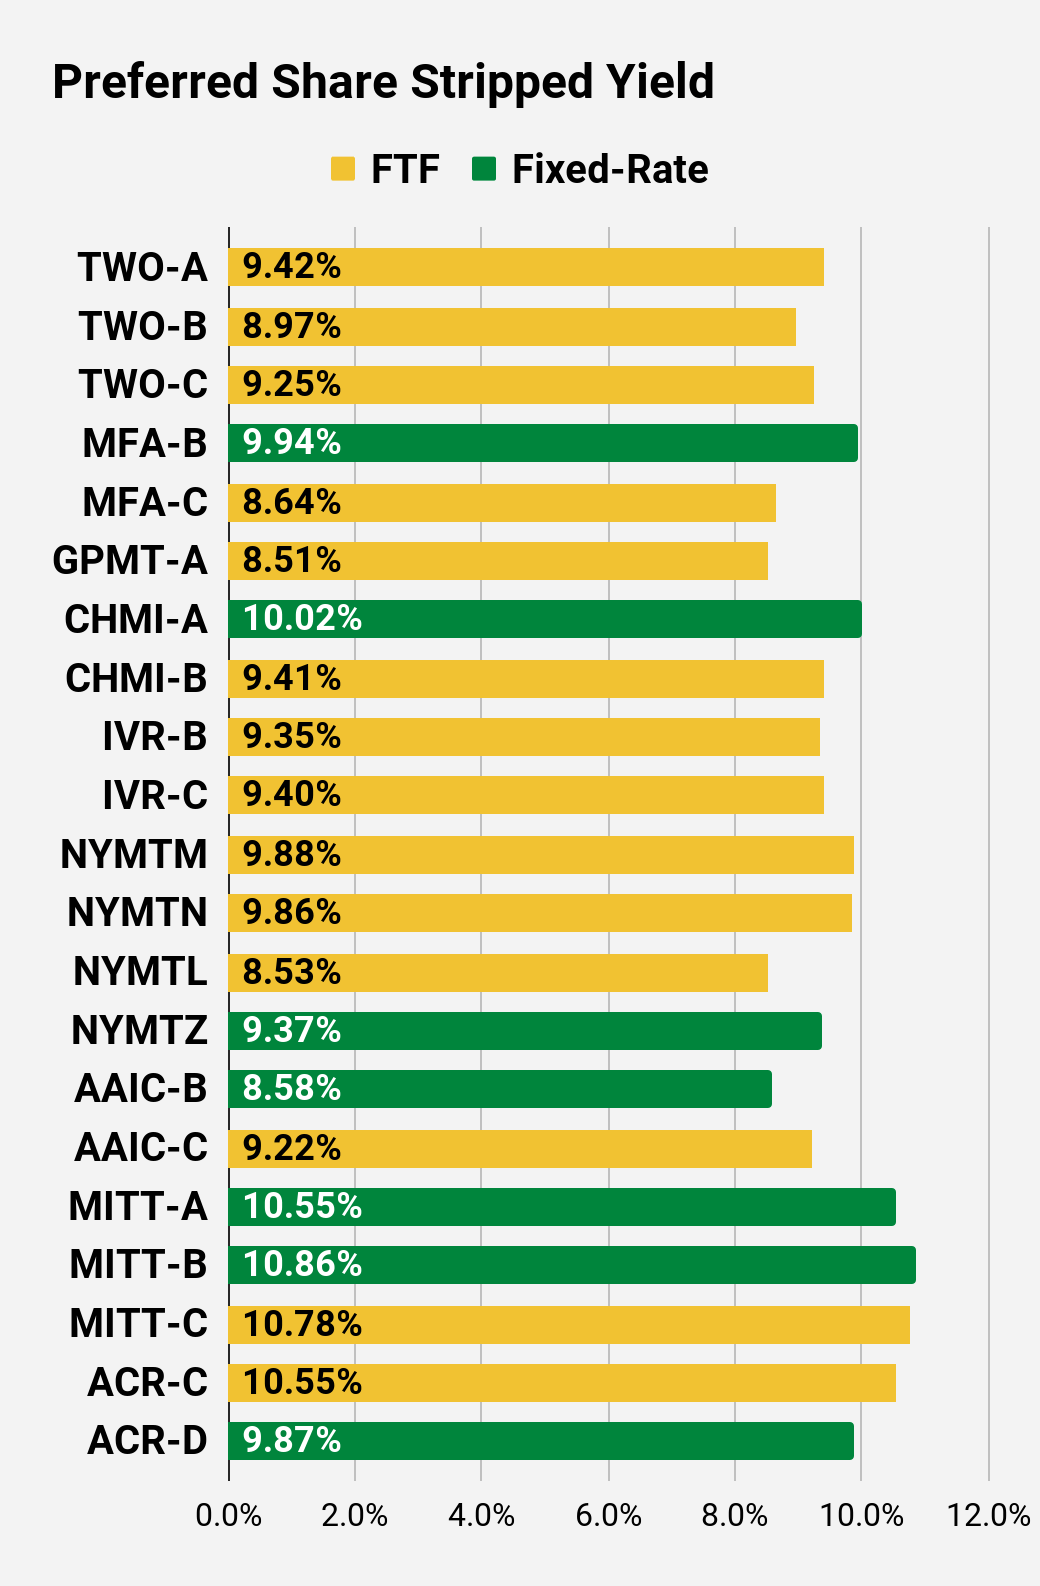
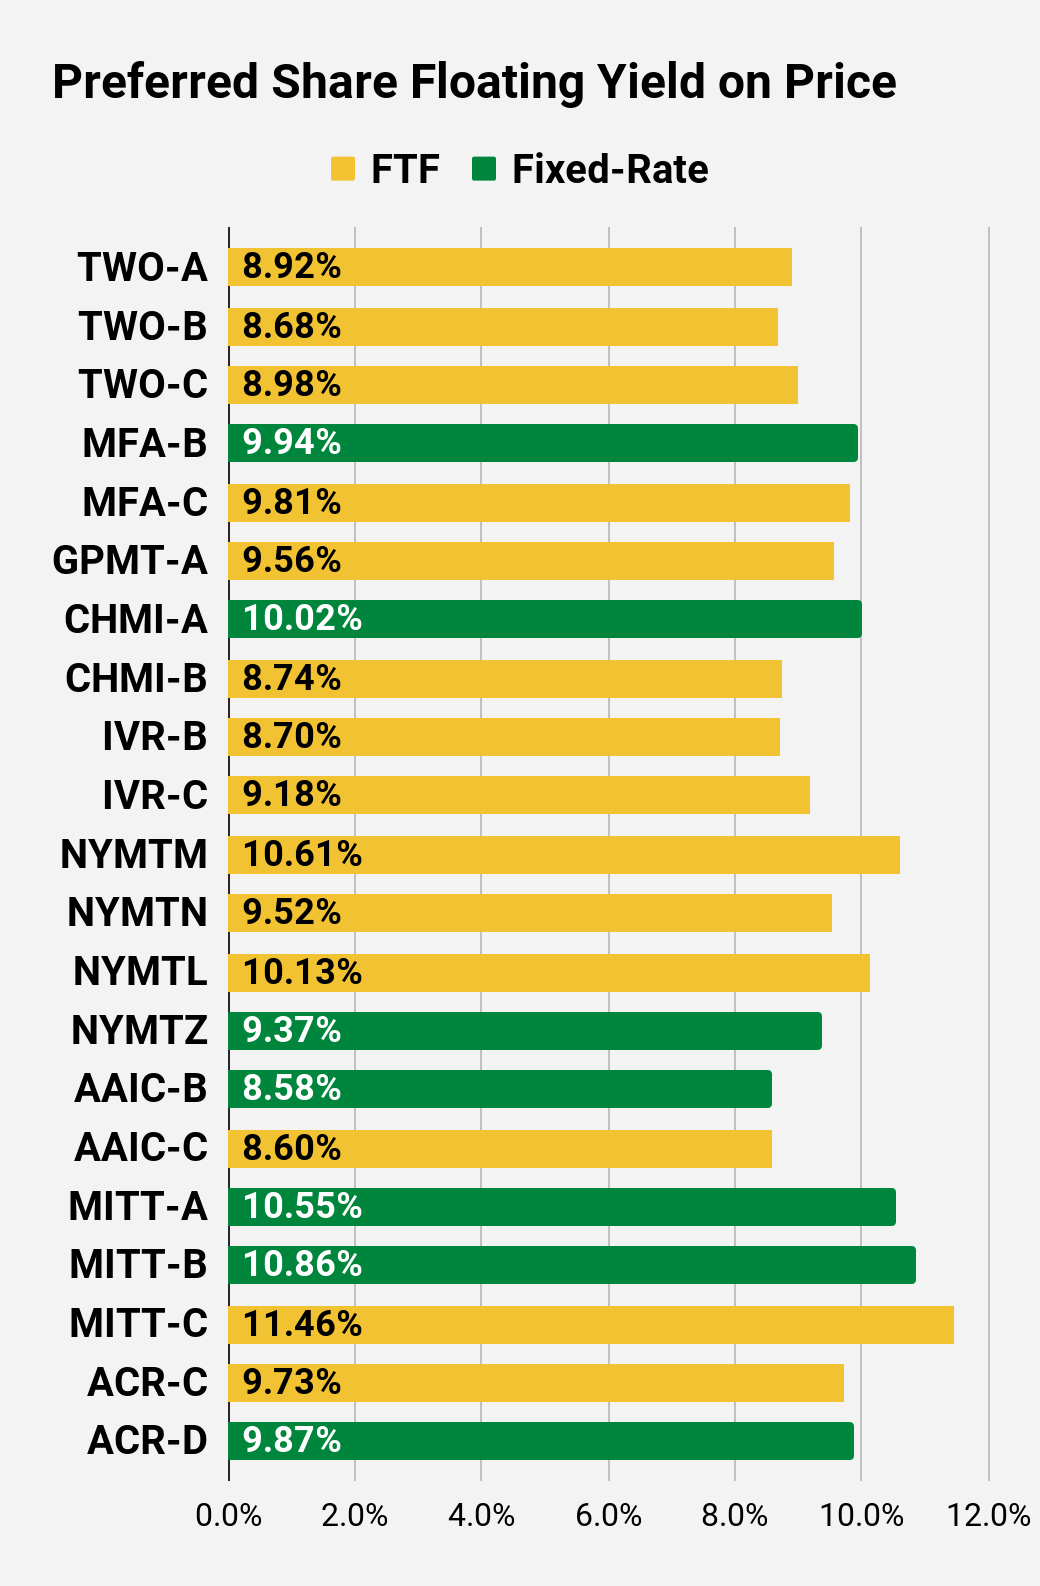
Preferred Share Charts
 The REIT Forum |
 The REIT Forum |
 The REIT Forum |
 The REIT Forum |
 The REIT Forum |
 The REIT Forum |
Preferred Share Data
Beyond the charts, we’re also providing our readers with access to several other metrics for the preferred shares.
After testing out a series on preferred shares, we decided to try merging it into the series on common shares. After all, we are still talking about positions in mortgage REITs. We don’t have any desire to cover preferred shares without cumulative dividends, so any preferred shares you see in our column will have cumulative dividends. You can verify that by using Quantum Online. We’ve included the links in the table below.
To better organize the table, we needed to abbreviate column names as follows:
- Price = Recent Share Price – Shown in Charts
- BoF = Bond or FTF (Fixed-to-Floating)
- S-Yield = Stripped Yield – Shown in Charts
- Coupon = Initial Fixed-Rate Coupon
- FYoP = Floating Yield on Price – Shown in Charts
- NCD = Next Call Date (the soonest shares could be called)
- Note: For all FTF issues, the floating rate would start on NCD.
- WCC = Worst Cash to Call (lowest net cash return possible from a call)
- QO Link = Link to Quantum Online Page
Second Batch:
Strategy
Our goal is to maximize total returns. We achieve those most effectively by including “trading” strategies. We regularly trade positions in the mortgage REIT common shares and BDCs because:
- Prices are inefficient.
- Long-term, share prices generally revolve around book value.
- Short-term, price-to-book ratios can deviate materially.
- Book value isn’t the only step in analysis, but it is the cornerstone.
We also allocate to preferred shares and equity REITs. We encourage buy-and-hold investors to consider using more preferred shares and equity REITs.
Performance
We compare our performance against 4 ETFs that investors might use for exposure to our sectors:
The REIT Forum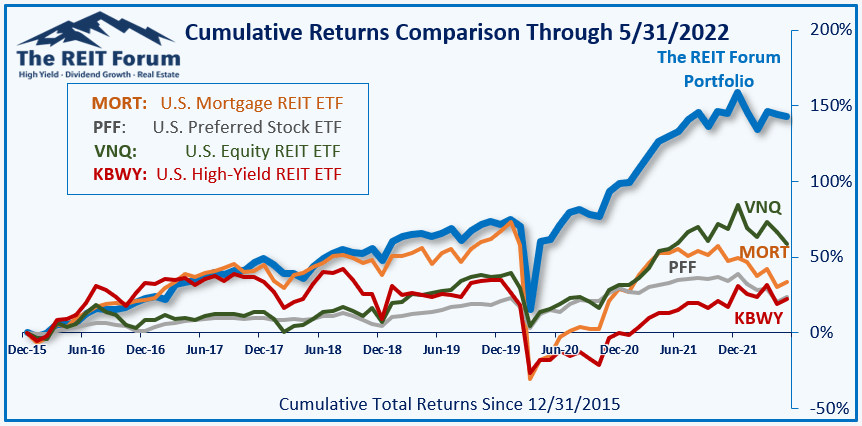
The 4 ETFs we use for comparison are:
|
Ticker |
Exposure |
|
One of the largest mortgage REIT ETFs |
|
|
One of the largest preferred share ETFs |
|
|
Largest equity REIT ETF |
|
|
The high-yield equity REIT ETF. Yes, it has been dreadful. |
When investors think it isn’t possible to earn solid returns in preferred shares or mortgage REITs, we politely disagree. The sector has plenty of opportunities, but investors still need to be wary of the risks. We can’t simply reach for yield and hope for the best. When it comes to common shares, we need to be even more vigilant to protect our principal by regularly watching prices and updating estimates for book value and price targets.
Ratings:
- Bullish on NRZ, RC, MFA, TPVG, DX
Be the first to comment