

peshkov
This article was published on Dividend Kings on Monday, Nov. 28.
2022 has been one heck of a wild ride for investors, and not just in the stock market.
This is the first year in history where both bonds and stocks are down double digits. And that’s hardly the most extreme unprecedented stuff we’ve seen this year.
- long duration UK bonds fell 50% in 2 days during the “mini budget” fiasco
- a “risk free” asset trading 5X more volatile than Bitcoin
The good news is 2023 is likely to finish much better for both stock and bond investors than 2022. But of course, the devil is in the details.
What To Expect With Interest Rates In 2023
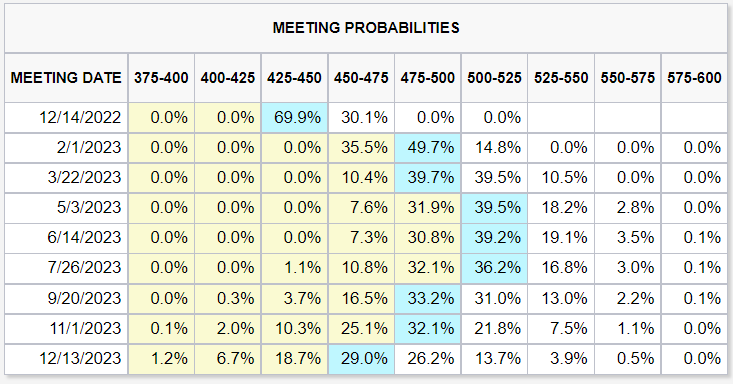
CME Group
The bond market is now expecting the Fed to:
- hike 0.5% in December
- hike 0.5% in February
- hike 0.25% in March
- peak Fed funds rate of 5.0%
The good news? 5.0% is a lot better than the 7% that some Fed presidents said they might have to hike too.
The bad news? It would still be the highest short-term interest rate in 20 years, which means bad news for the US economy.
What To Expect With The Economy In 2023
The bad news is that the bond market is very confident that we’re headed for recession in 2023.
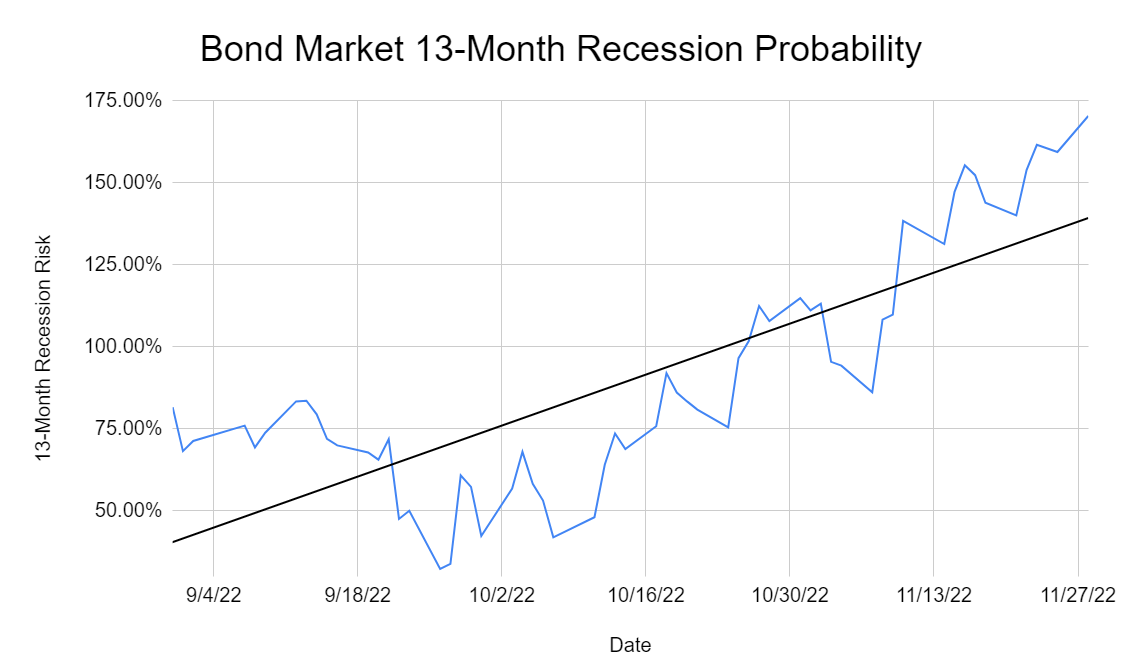
(Source: NY Fed, CNBC, DK S&P 500 Valuation Tool)
The bond market is estimating the probability of recession by the end of 2023 at 170%. How is that possible? It simply means the bond market thinks there’s a 100% chance of recession starting much earlier than the end of next year.
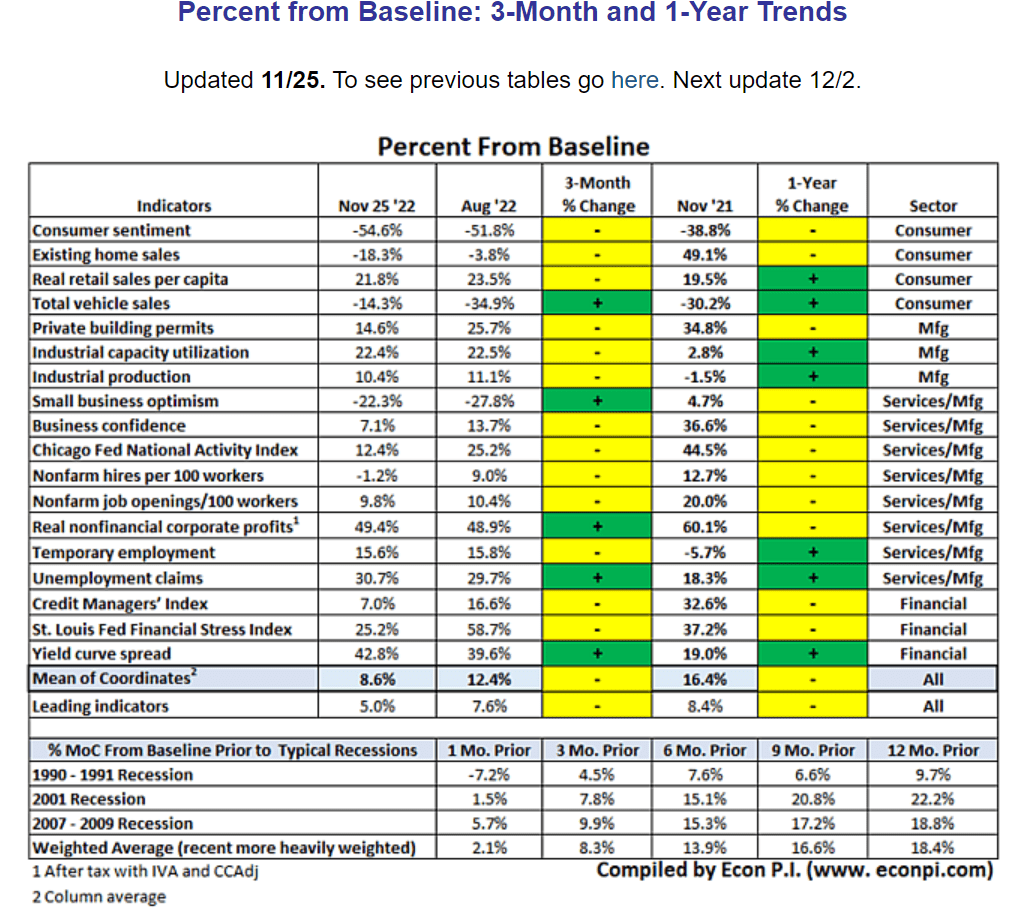
(Source: David Rice)
Based on 18 economic indicators it appears a recession might begin in three to five months.
That’s a recession starting in February to April 2023 based on current economic conditions. Which is consistent with what blue-chip economist teams at UBS and Goldman expect.
But here’s the good news. The Great Recession and Pandemic are not typical recessions. In fact, they were the two worst recessions in 75 years.
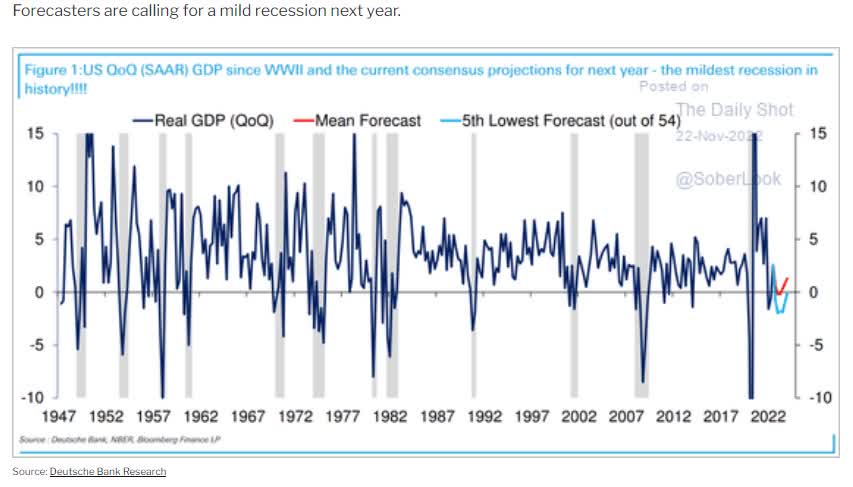
Daily Shot
The blue-chip economist consensus expects a peak GDP decline of about -0.1%, the mildest recession in US history. What about individual blue-chip economist forecasts?
- Bank of America: -0.3% GDP decline in 2023
- Deutsche Bank: -0.5% GDP decline in 2023
- JPMorgan: -1.4% GDP decline in 2023
The Good News For Bond Investors In 2023
Bond yields, which soared by 4.5% in 2022, are expected to peak and start falling steadily by February.
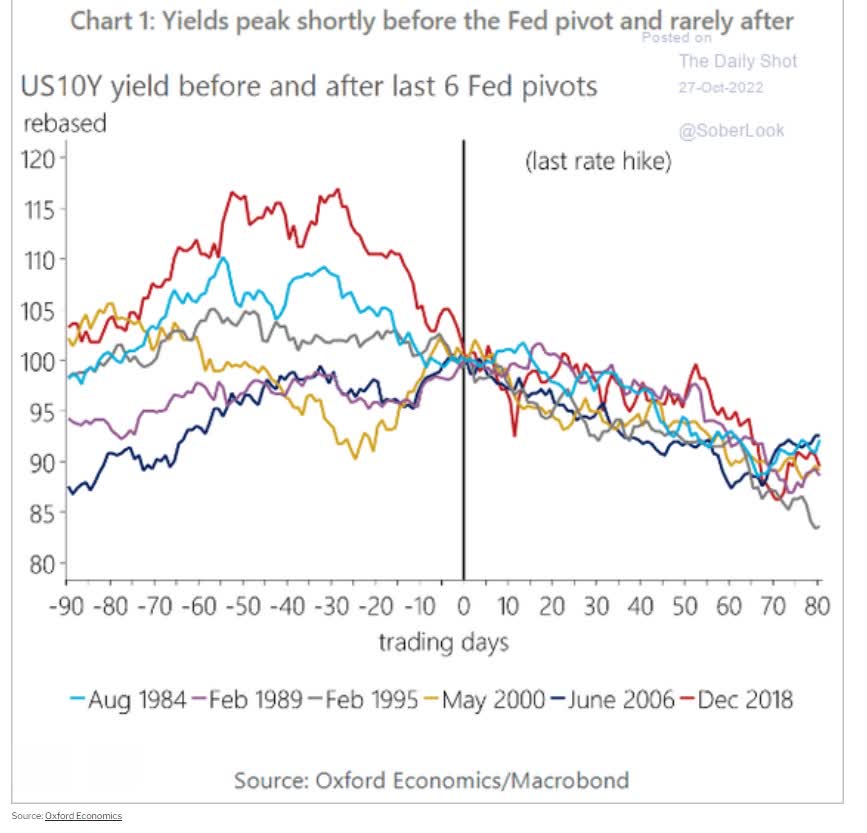
Daily Shot
Historically speaking, long bond yields peak and start falling one month before the last Fed rate hike, which would mean a potential peak in February 2023.
However, given that this is the most anticipated recession in US history, bond yields might have already peaked.
What does this potentially mean for your portfolio? Great news. Because HSBC and Nomura both expect 10-year yields to fall about 2% from recent peaks, to around 2.3% in 2023.
- a potential 1.4% further decline in bond yields in 2023
- a potentially strong tailwind for stocks in the 2nd half of 2023
That means a potential 10% rally for US bonds, and a 35% potential rally in US long duration Treasury bonds. The most hated asset class of 2022 could become one of the hottest next year.
Be Ready For A Painful First Half For Stocks In 2023... Followed By A Potentially Strong Rally The Rest Of The Year
Stocks began 2022 trading at 21X forward earnings, a 24% historical premium.
The 28% peak decline we’ve seen so far in 2022 was merely a stock bubble deflating.
The average recessionary earnings decline since WWII is 13%. Assuming that holds true for the 2023 recession it means stocks are currently trading at 21X earnings, the same valuation they started the year at.
This is why the blue-chip consensus for the 2023 S&P bottom is 3,000 to 3,400, a 16% to 28% further decline.
The good news is that historically stocks price in a recession half way through a downturn, when earnings pessimism peaks.
- Morgan Stanley expects the market to bottom at 3,300 on the S&P in February or March
- Goldman and UBS expect the bottom in June or July
- JPMorgan thinks October 2023 or even the end of 2023
In other words, most likely, based on the economic data we’re facing now, stocks haven’t bottomed yet. The final plunge could feel terrifying for many.
The good news is that the end is finally in sight for the 2022 bear market.
The bad news? The bottom is likely to arrive in a relatively wide range, anytime between Q1 2023 and the end of next year.
In other words, in order to help you stay calm, safe, and sane until the bear market finally ends, low volatility high-yield dividend aristocrats are a great choice for any diversified and prudently risk-managed portfolio.
How To Find The Best Low Volatility High-Yield Aristocrats… In 1 Minute
Why are low volatility high-yield aristocrats perfect for the terminal phase of a bear market?
- they tend to fall a lot less than the rest of the market (helping you sleep well at night)
- they pay generous, safe, and steadily rising dividends even in recessions
When you’re getting paid 4+% to wait out a few months of final market pain, and you know that you own world-class blue-chips that have survived far worse, that’s the ultimate SWAN strategy.
Let me show you how to screen the Dividend Kings Zen Research Terminal, which runs of the DK 500 Master List, to easily find the best dividend aristocrats to buy ahead of the Nov. 8 election.
The Dividend Kings 500 Master List includes some of the world’s best companies, including:
- every dividend champion (25+ year dividend growth streaks, including foreign aristocrats)
- every dividend aristocrat
- every dividend king (50+ year dividend growth streaks)
- every Ultra SWAN (as close to perfect quality companies as exist)
- the 20% highest quality REITs according to iREIT
- 40 of the world’s best growth blue-chips
| Step | Screening Criteria | Companies Remaining | % Of Master List |
| 1 | Reasonable Buy, Good Buy, Strong Buy, Very Strong Buy, Ultra Value Buy (Never Overpay For Stocks) | 330 | 66.00% |
| 2 | 10+ Quality (Blue-Chip Or Better) | 289 | 57.80% |
| 3 | Dividend Champions List | 55 | 11.00% |
| 4 | Yield 3+% | 21 | 4.20% |
| 5 | 8+% long-term return potential | 17 | 3.40% |
| 6 |
Add Annual Volatility To Metrics |
NA | NA |
| 7 | Sort By Lowest Volatility | 10 | 2.00% |
| Total Time | 1 Minutes |
In one minute we went from 500 of the world’s best blue chips to the 10 that are best suited for our goal of ultra-low-volatility high-yield aristocrats.
10 High-Yield Dividend Aristocrats Perfect For What’s Coming Next
I’ve linked to articles exploring each company’s investment thesis, growth prospects, and risk profile.
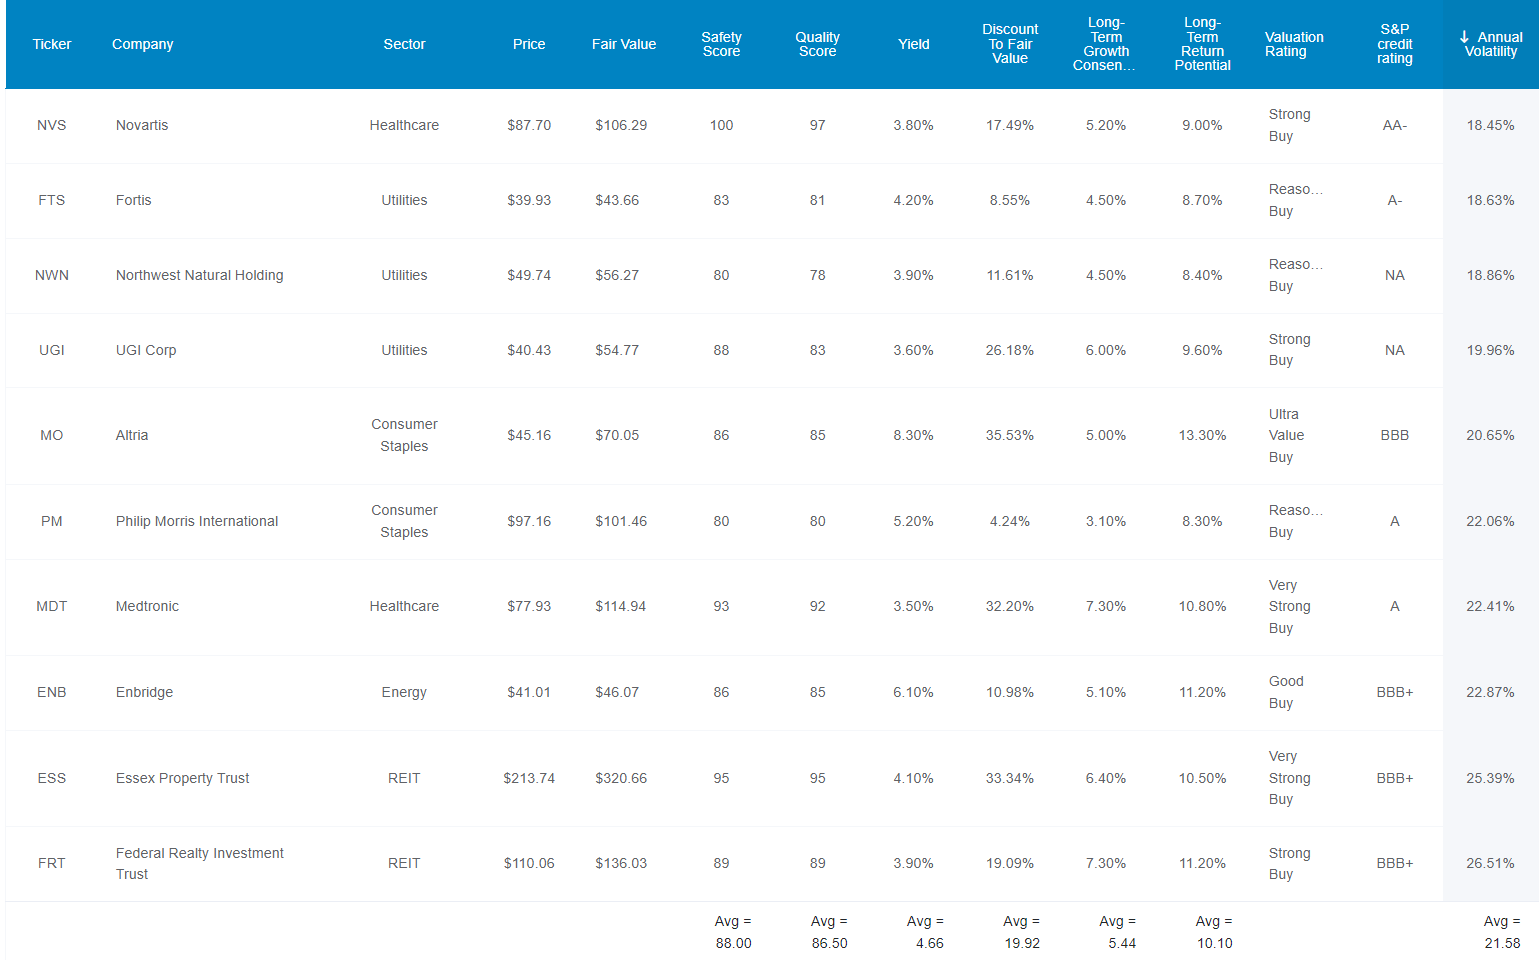
(Source: Dividend Kings Zen Research Terminal)
Here they are in order of lowest to highest average annual volatility over the last 15 years.
- Novartis (NVS)
- Fortis (FTS)
- Northwest Natural Holdings (NWN)
- UGI Corp. (UGI)
- Altria (MO)
- Philip Morris International (PM)
- Medtronic (MDT)
- Enbridge (ENB)
- Essex Property Trust (ESS)
- Federal Realty Trust (FRT)
Tax Implications
- Novartis is a Swiss Company
- 35% default dividend tax withholding
- US investors qualify for a 15% withholding
- but your broker needs to file forms with the Swiss Government to get the lower rate
- tax credit available to recoup the remaining 15%
- own in a taxable account to qualify for the tax credit
- ENB and FTS are Canadian Companies
- 15% tax withholding in taxable accounts
- no withholding in tax-deferred/retirement accounts
- tax credit available for taxable accounts to recoup the withholding
- own in retirement accounts to avoid the withholding and save on tax paperwork
Why are these 10 high-yield low volatility aristocrats you can trust in a 16% to 26% market decline that’s likely coming in the first half of 2023?
10 Of The World’s Highest Quality Low-Volatility Dividend Blue Chips
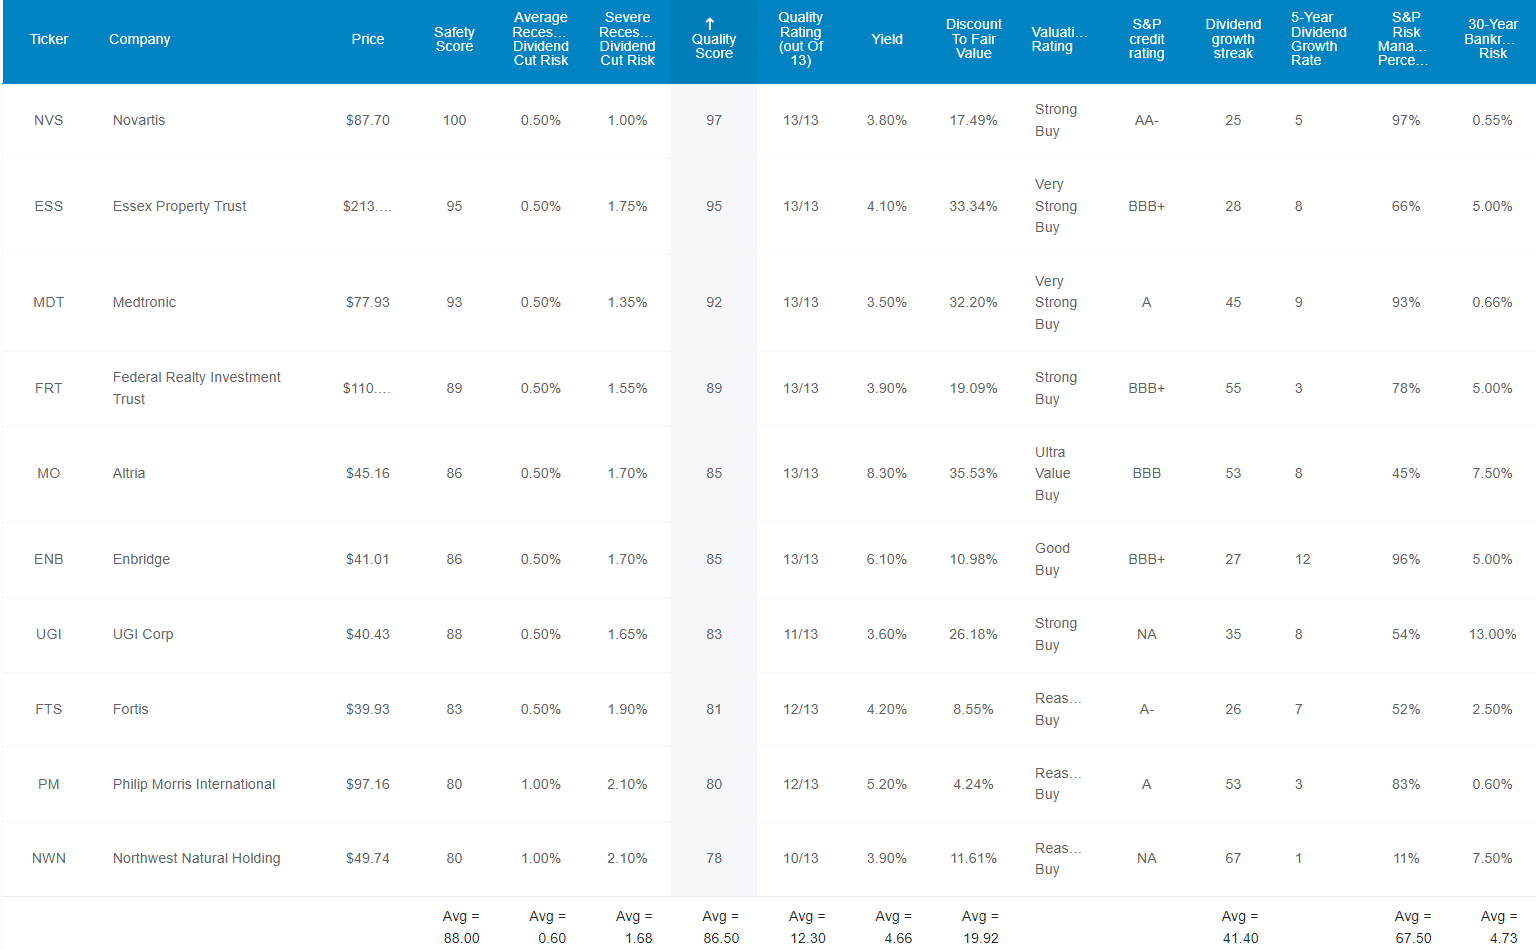
(Source: Dividend Kings Zen Research Terminal)
Here I’ve sorted these 12.3/13 Super SWAN low volatility aristocrats by quality score.
How can we tell that they are Super SWAN quality (on par with the dividend aristocrats)? By looking at their fundamental safety metrics.
- 88% dividend safety score = 0.6% average recession dividend cut risk
- 1.68% severe (Pandemic/GFC level) recession cut risk
Ben Graham considered 20-plus year streaks without a dividend cut to be an important sign of quality and a 20-plus year dividend growth streak a sign of excellence.
These low volatility aristocrats have a 41.4 year average dividend growth streak.
- every year since 1981
- through six recessions
- and two economic crises
- and nine bear markets
S&P estimates their average 30-year bankruptcy risk at 4.73%.
- BBB+ stable credit rating
S&P also estimates their long-term total risk-management global rating at 67th percentile.
DK uses S&P Global’s global long-term risk-management ratings for our risk rating.
- S&P has spent over 20 years perfecting their risk model
- which is based on over 30 major risk categories, over 130 subcategories, and 1,000 individual metrics
- 50% of metrics are industry specific
- this risk rating has been included in every credit rating for decades
The DK risk rating is based on the global percentile of how a company’s risk management compares to 8,000 S&P-rated companies covering 90% of the world’s market cap.
These Aristocrats Score 67th Percentile On Global Long-Term Risk Management
S&P’s risk management scores factor in things like:
- supply chain management
- crisis management
- cyber-security
- privacy protection
- efficiency
- R&D efficiency
- innovation management
- labor relations
- talent retention
- worker training/skills improvement
- customer relationship management
- climate strategy adaptation
- corporate governance
- brand management
If you can think of a risk factor that might hurt a company’s business, S&P has included it in their model.
- as well as company specific risks you’ve never thought of
These Aristocrats Long-Term Risk Management Is The 230th Best In The Master List (54th Percentile In The Master List)
| Classification | S&P LT Risk-Management Global Percentile |
Risk-Management Interpretation |
Risk-Management Rating |
| BTI, ILMN, SIEGY, SPGI, WM, CI, CSCO, WMB, SAP, CL | 100 | Exceptional (Top 80 companies in the world) | Very Low Risk |
| Strong ESG Stocks | 86 |
Very Good |
Very Low Risk |
| Foreign Dividend Stocks | 77 |
Good, Bordering On Very Good |
Low Risk |
| Ultra SWANs | 74 | Good | Low Risk |
| Low Volatility High-Yield Aristocrats | 67 | Above-Average (Bordering On Good) | Low Risk |
| Dividend Aristocrats | 67 | Above-Average (Bordering On Good) | Low Risk |
| Low Volatility Stocks | 65 | Above-Average | Low Risk |
| Master List average | 61 | Above-Average | Low Risk |
| Dividend Kings | 60 | Above-Average | Low Risk |
| Hyper-Growth stocks | 59 | Average, Bordering On Above-Average | Medium Risk |
| Dividend Champions | 55 | Average | Medium Risk |
| Monthly Dividend Stocks | 41 | Average | Medium Risk |
(Source: DK Research Terminal)
The bottom line is that all companies have risks, and these low volatility high-yield aristocrats are above-average, bordering on good, at managing theirs according to S&P.
OK, so now that you know why these are 10 of the most dependable high-yield Super SWANs on earth, here’s why you might want to buy some of them today.
Wonderful Companies At Reasonable To Wonderful Prices
(Source: Dividend Kings Zen Research Terminal)
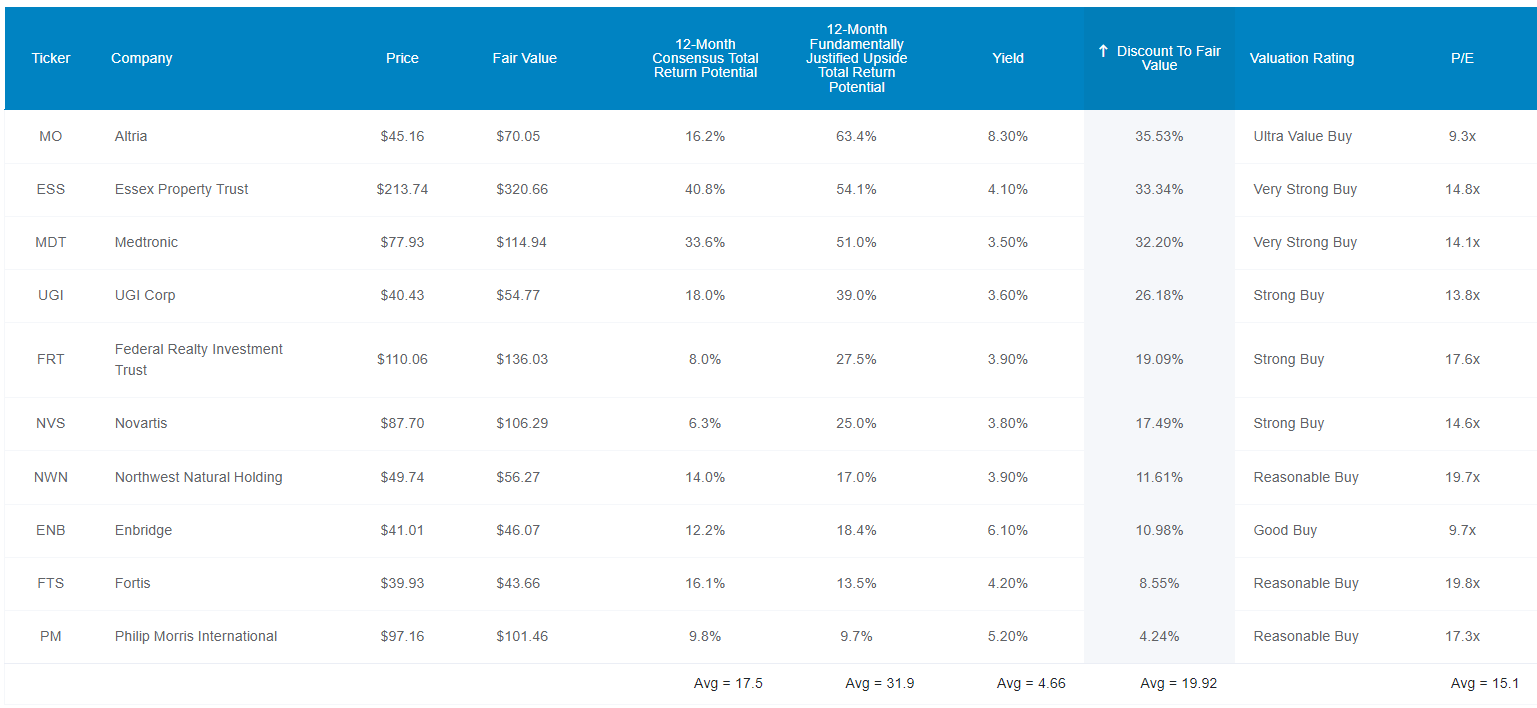
For context the S&P 500 trades at 17.5X forward earnings, a 4% historical premium.
- 21.1X forward recession-adjusted earnings = 24% historical premium
In contrast these low volatility high-yield aristocrats are trading at 15.1X forward earnings, a 20% historical discount.
- recession-resistant business models = minimal risk of 2023 earnings being much lower than currently expected
Analysts expect them to deliver 18% total returns within the next 12 months, but their 12-month fundamentally justified total return to fair value is 32%.
- if they all grow as expected and return to mid-range market-determined historical fair value you’ll make 32% in the next year
But my goal isn’t to help you make 18% or even 32% total returns within a year. My goal is to help you potentially double your money every seven years, for decades, while sleeping like a baby in even the most extreme market crashes.
High-Yield + Low Volatility + Market Level Returns = A Dream Retirement Portfolio
(Source: Dividend Kings Zen Research Terminal)
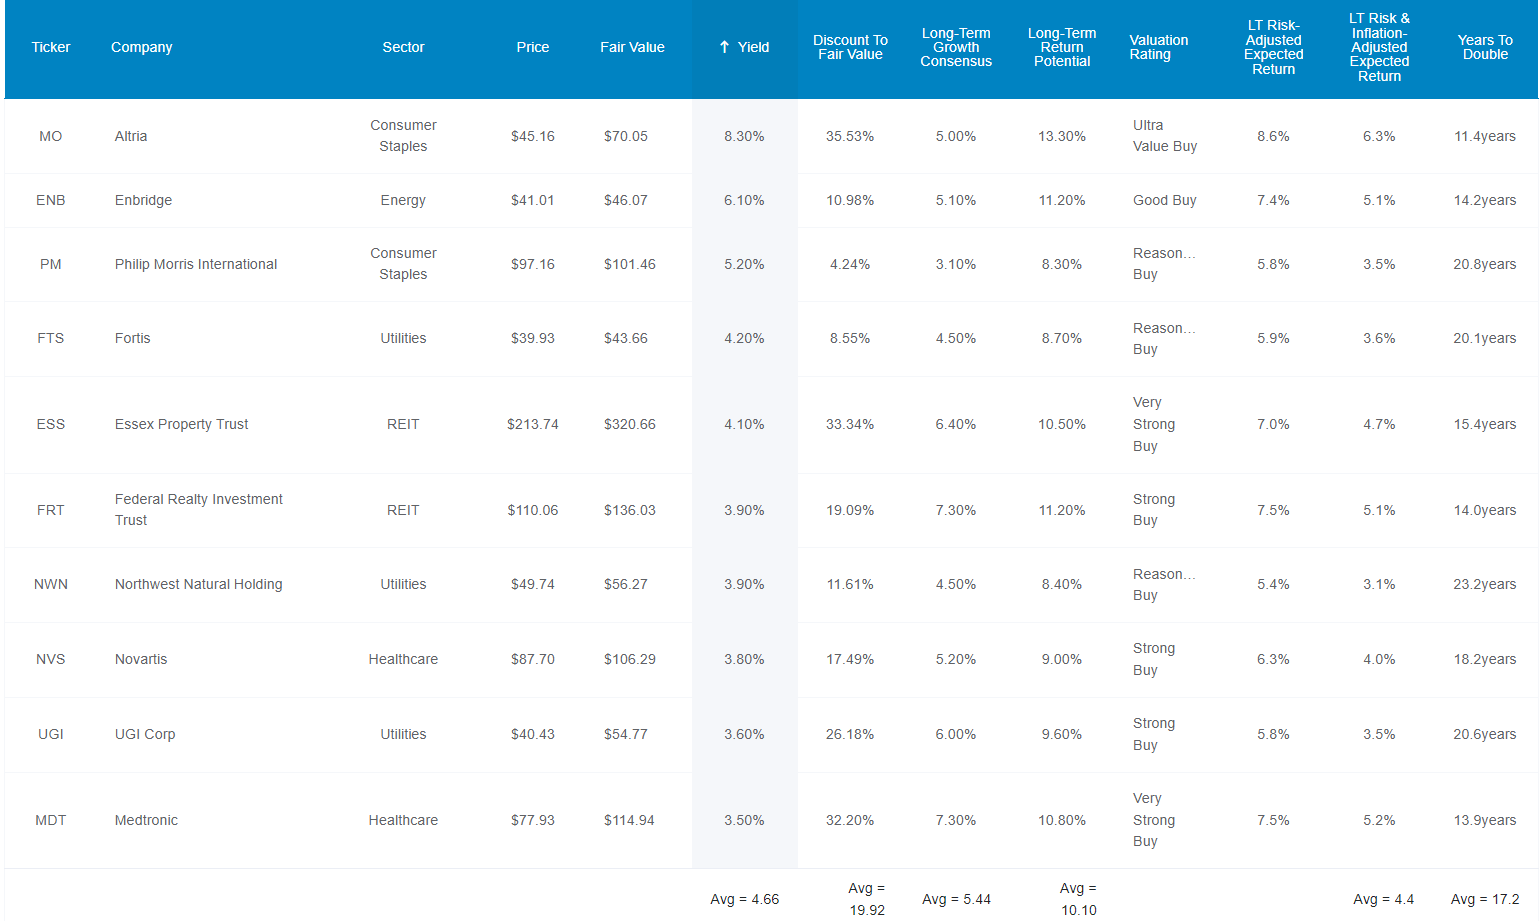
Here I’ve sorted these aristocrats by yield.
Not only do these aristocrats offer one of the world’s safest 4.7% yields, but they’re growing at 5.4% per year, and thus offer 10.1% annual long-term return potential.
| Investment Strategy | Yield | LT Consensus Growth | LT Consensus Total Return Potential | Long-Term Risk-Adjusted Expected Return | Long-Term Inflation And Risk-Adjusted Expected Returns | Years To Double Your Inflation & Risk-Adjusted Wealth |
10-Year Inflation And Risk-Adjusted Expected Return |
| 10 High-Yield Low Volatility Dividend Aristocrats | 4.7% | 5.4% | 10.1% | 7.1% | 4.7% | 15.2 | 1.59 |
| REITs | 3.9% | 6.1% | 10.0% | 7.0% | 4.7% | 15.4 | 1.58 |
| Schwab US Dividend Equity ETFSchwab US Dividend Equity ETF 3.6% 8.5% 12.1% 8.4% 6.1% 11.8 1.81 2.33% | 3.6% | 8.5% | 12.1% | 8.4% | 6.1% | 11.8 | 1.81 |
| Dividend Aristocrats | 2.6% | 8.5% | 11.1% | 7.8% | 5.4% | 13.2 | 1.70 |
| S&P 500 | 1.7% | 8.5% | 10.2% | 7.1% | 4.8% | 15.0 | 1.60 |
(Source: DK Research Terminal, FactSet, Morningstar, Ycharts)
3X the market’s yield, a much safer yield at that, and market like long-term return potential? Now that’s what I call a perfect basket of stocks for a potential 16% to 26% market correction next year.
8% returns from defensive portfolios are considered good, because that’s more than the 7.4% the 60/40 has historically delivered and is expected to return in the future.
Market like returns with super low volatility and high and very safe yield? That’s the stuff retirement dreams are made of.
OK, so this is all very impressive on paper. But what evidence is there that these low volatility, high-yield aristocrats can actually deliver market level or even market beating returns?
Historical Returns Since 1996
The future doesn’t repeat, but it often rhymes. – Mark Twain
Remember, “past performance is no guarantee of future results.”
But studies show that blue chips with relatively stable fundamentals offer predictable returns based on yield, growth and valuation mean reversion over time.
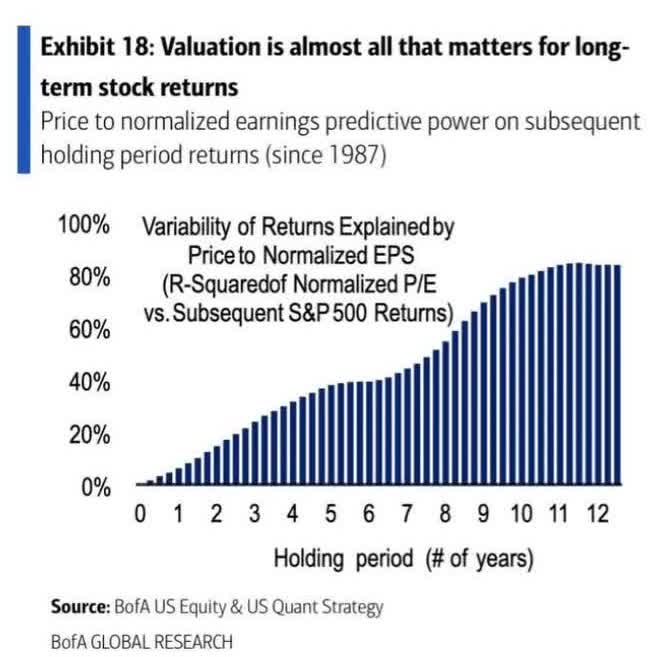
Bank of America
Twenty-six years is a time frame in which 96% of total returns are due to fundamentals, not luck.
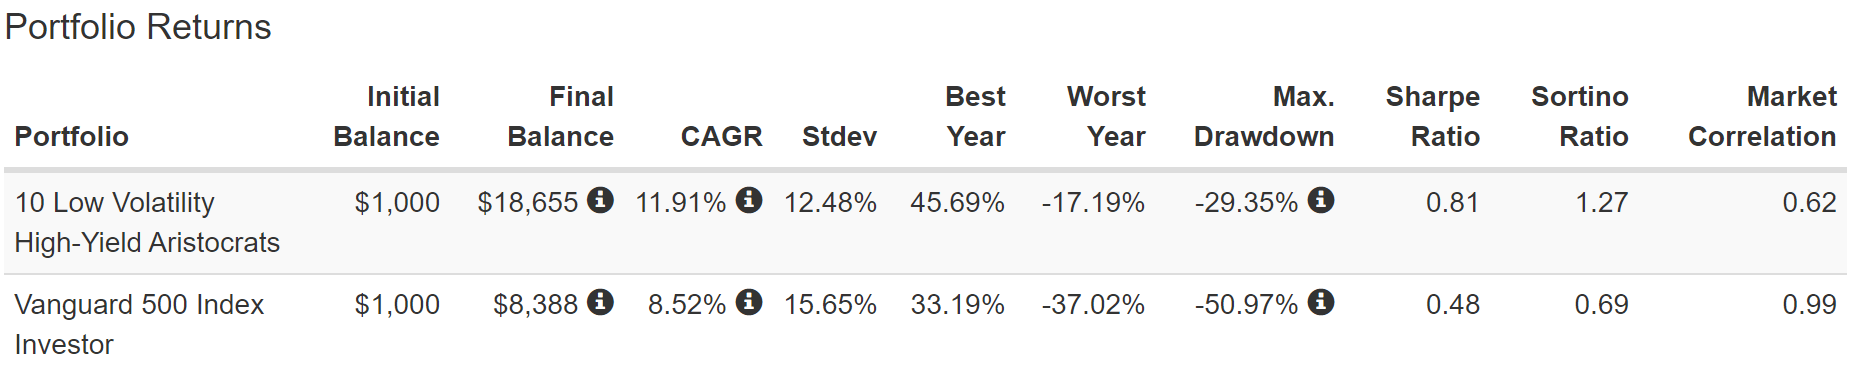
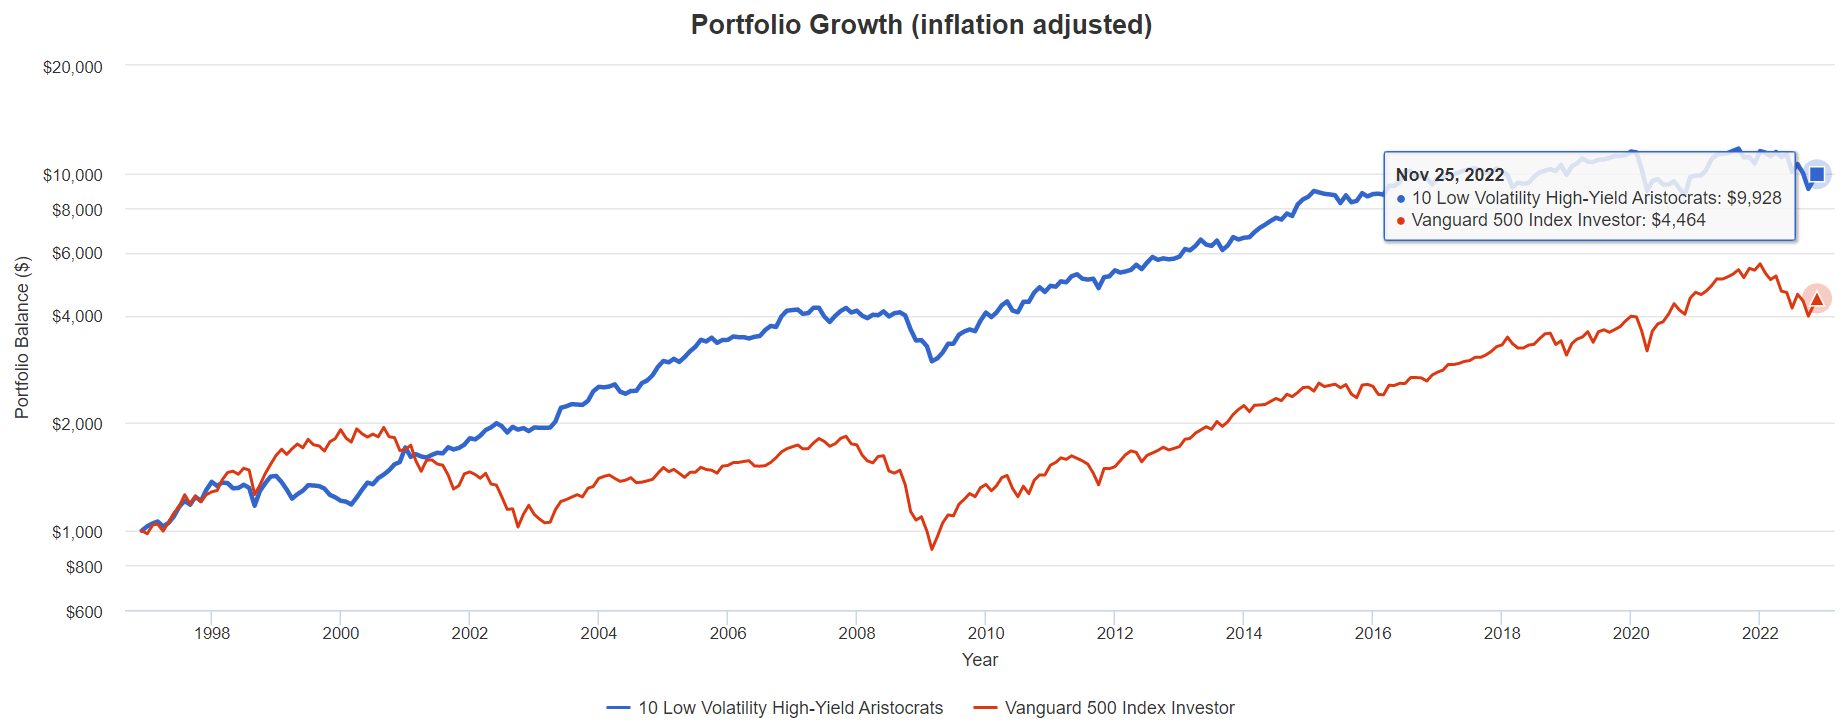
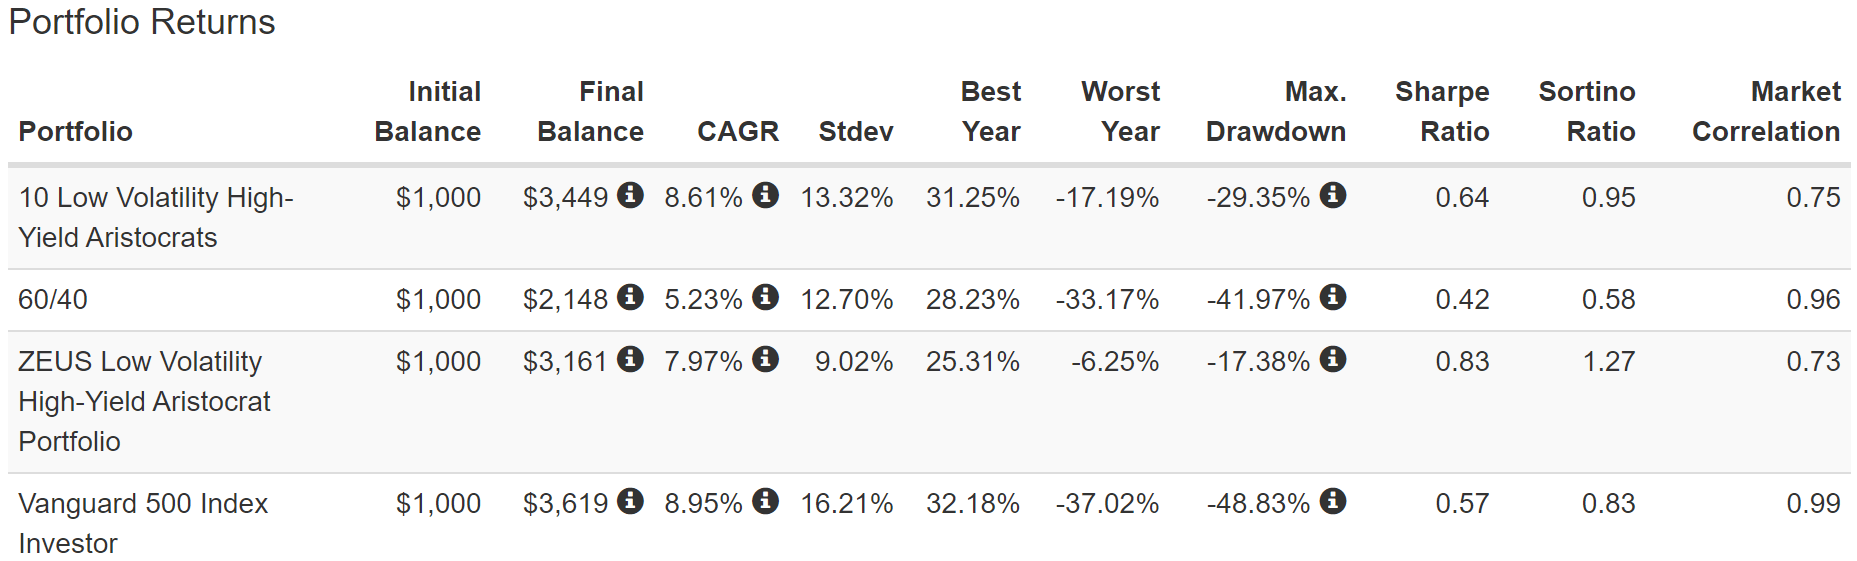
(Source: Portfolio Visualizer Premium)
Twenty-six years of beating the market and with 20% lower annual volatility, and with 50X fewer companies than the S&P 500.
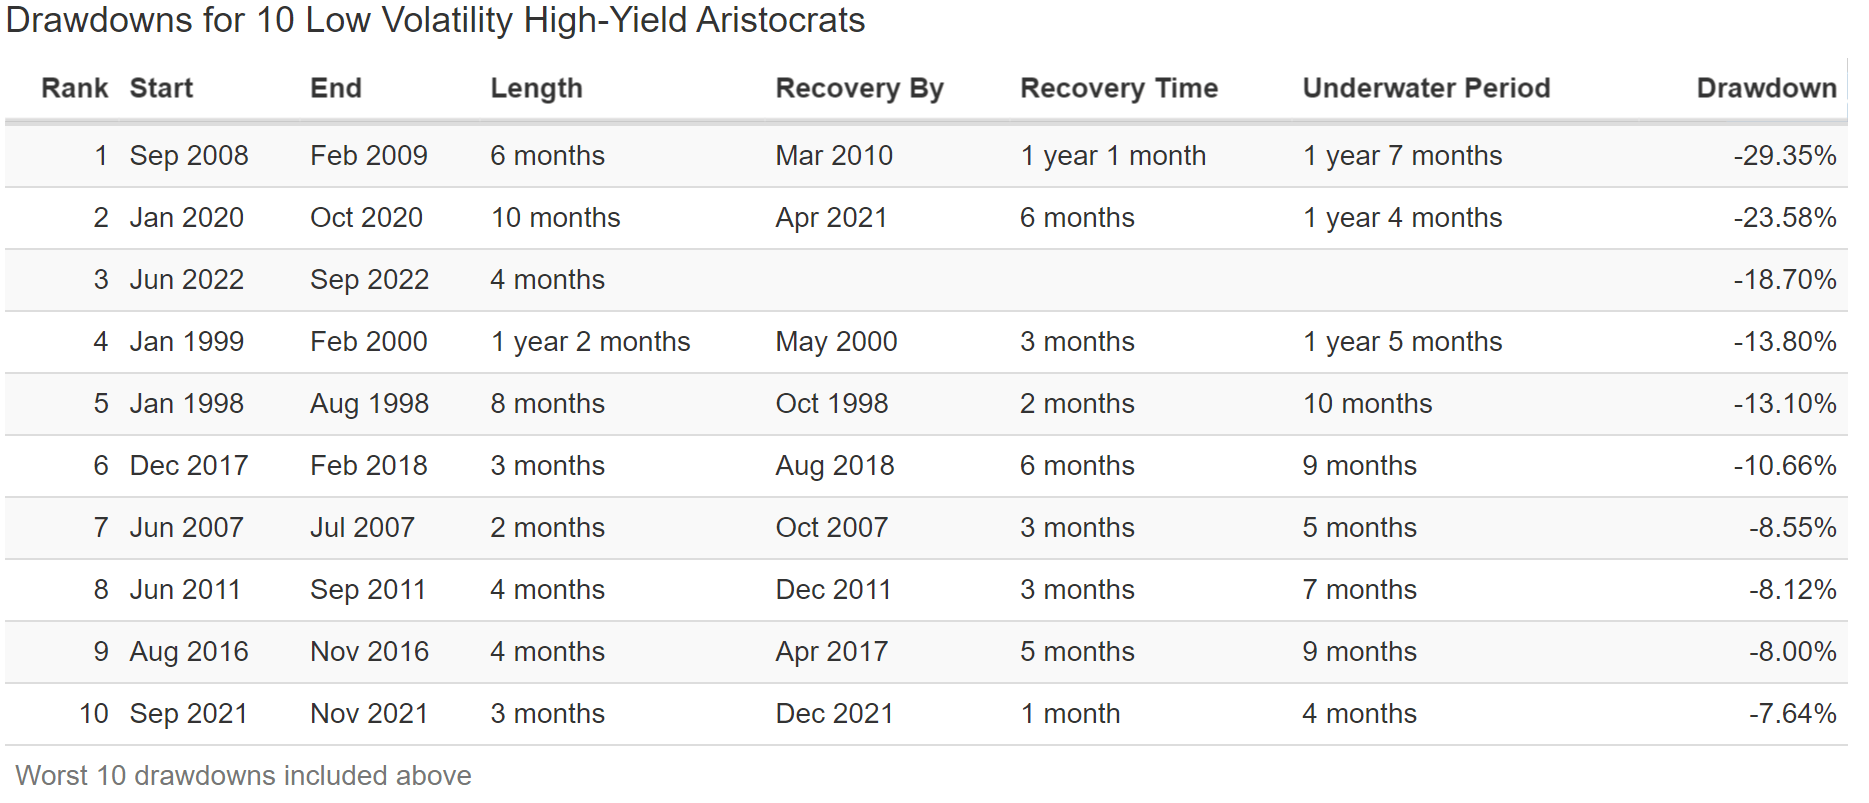
- a 29% peak decline in the Great Recession
- 60/40 fell 44% and the S&P 51% (58% intra-day peak decline)
Lower volatility than a 40% bond portfolio? Yes, you can achieve that with low volatility defensive aristocrats.
(Source: Portfolio Visualizer Premium)
10X inflation-adjusted returns that more than doubled the S&P’s returns and with a far smoother ride.
(Source: Portfolio Visualizer Premium)
Worried about a lost decade for stocks? Guess what? One in every four decades is a lost decade for US stocks.
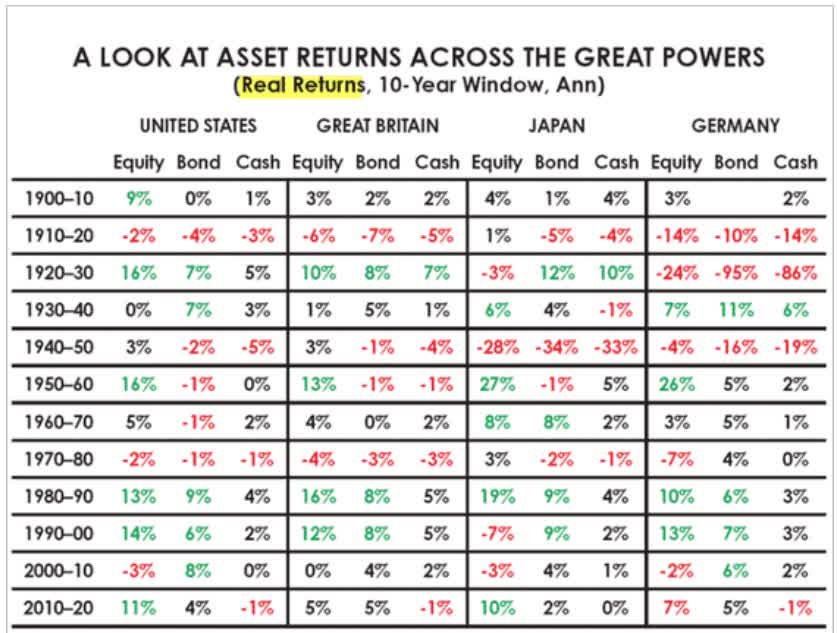
Daily Shot
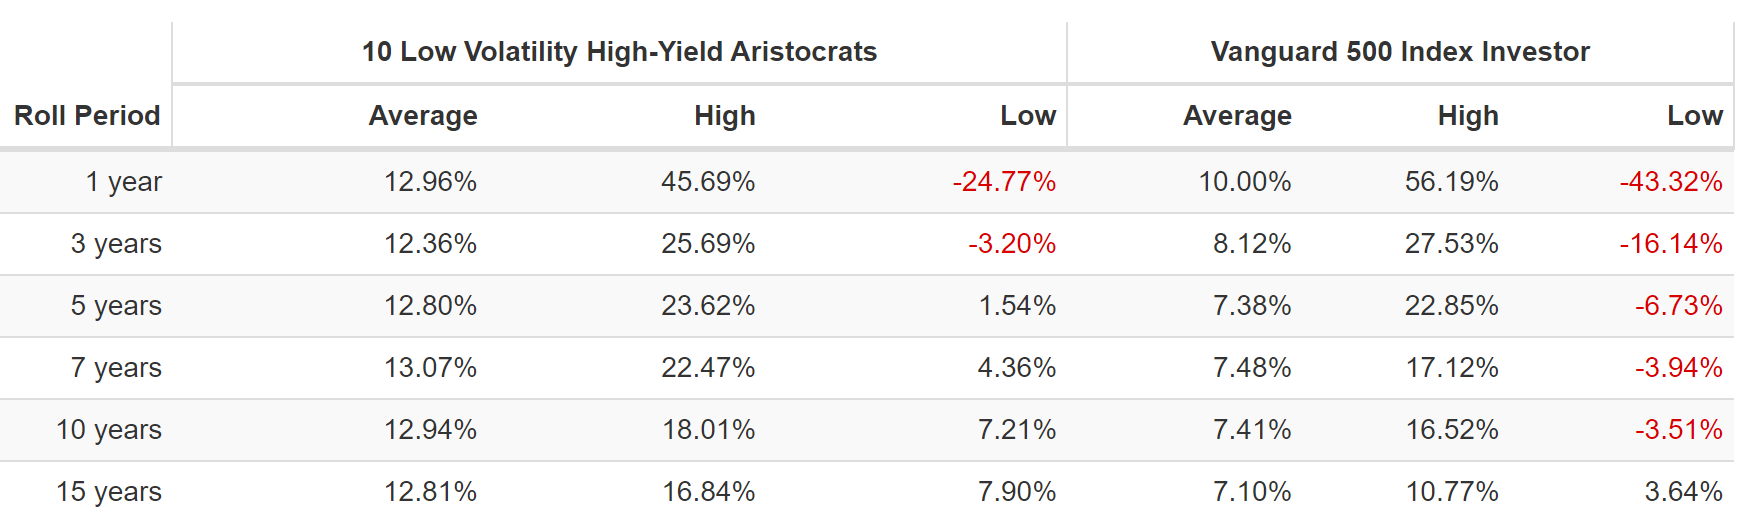
In any investing lifetime you will experience one or two lost decades for stocks. But these aristocrats? They’ve never suffered even a lost five years.
(Source: Portfolio Visualizer Premium)
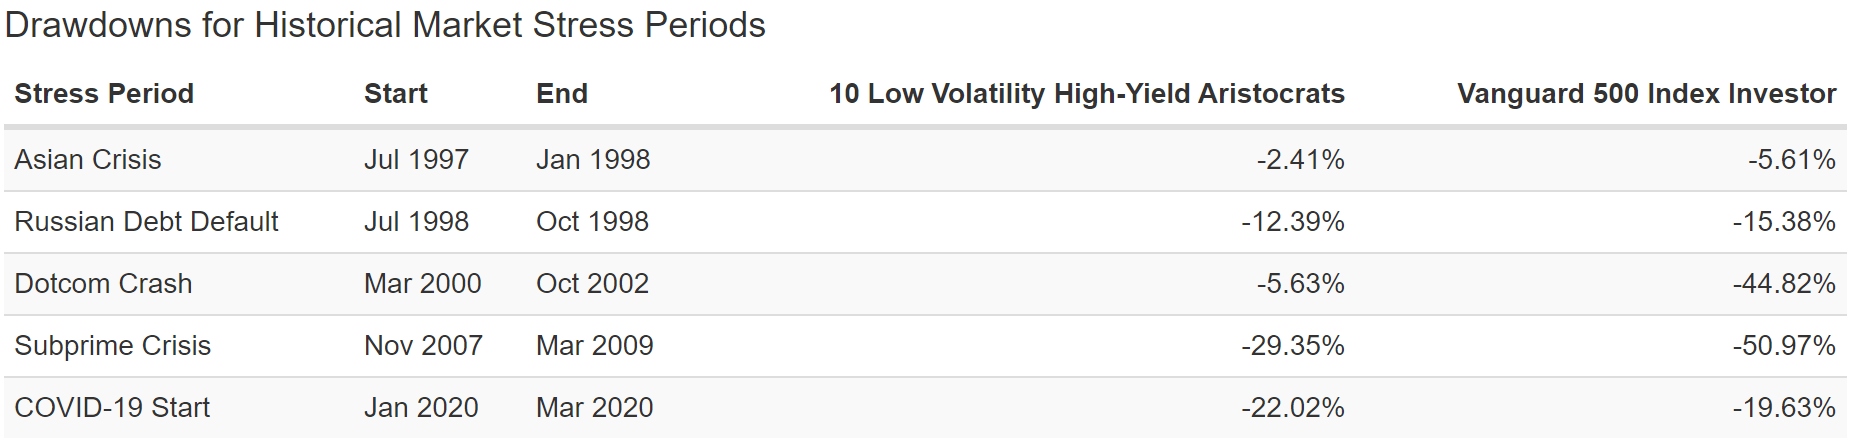
In four out of five market crises, these low volatility aristocrats did their jobs, falling a lot less than the market.
- including a 6% peak decline in the Tech crash
(Source: Portfolio Visualizer Premium)
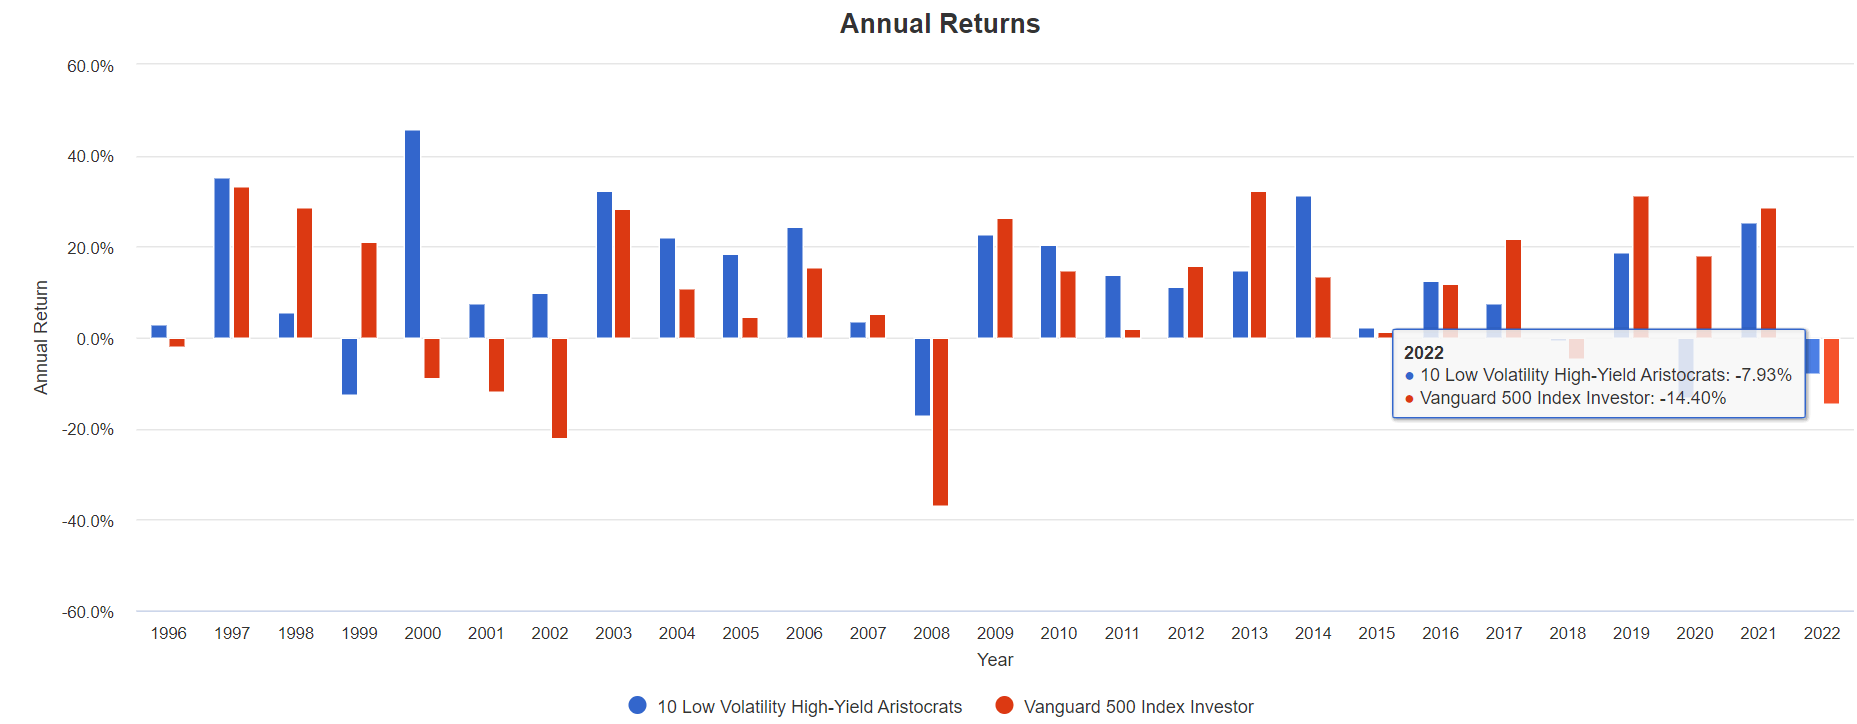
Year-to-date they’re down 8%, half as much as the S&P 500.
In 2008 when the market fell 37% they fell 17%.
(Source: Portfolio Visualizer Premium)
The peak decline in this bear market was 19%.
- Nasdaq -35%
- S&P -28%
- 60/40 -21%
In 26 years the S&P 500 has had six bear markets. These low volatility aristocrats saw just two, and those were caused by the two most severe recessions in 75 years.
Their longest bear market was 19 months, just 1.5 years.
- 60/40’s worst bear market was 3.5 years long
- S&P 500’s was 6.25 years
Market level returns, with far more income, a lot less volatility and bear markets that last one-fourth as long as the S&P 500? Yes, please, I’ll have some of that.
Rich Retirement Income You Can Depend On
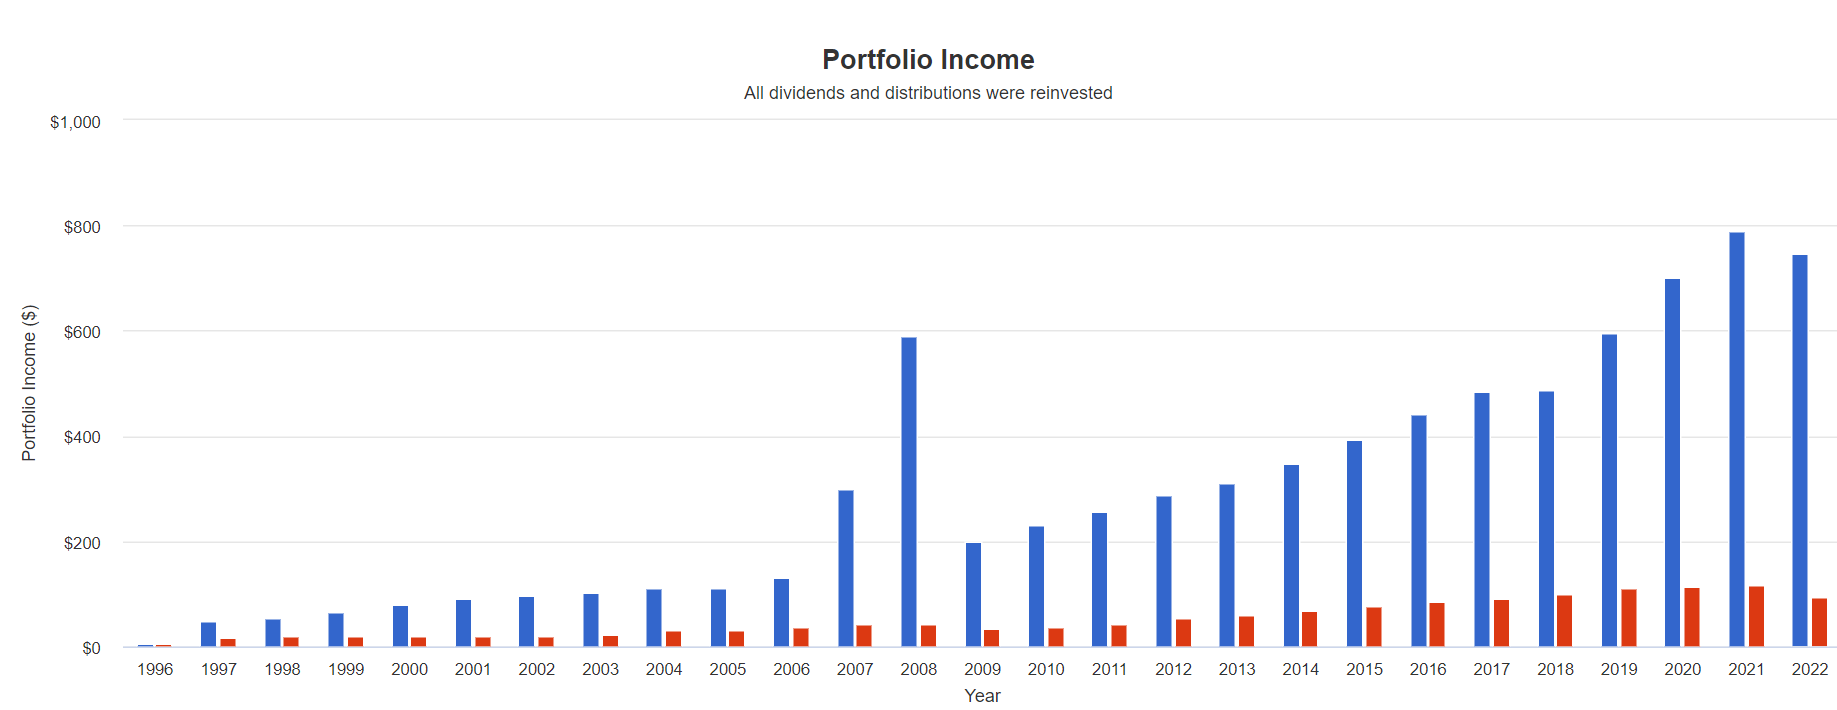
In USD, 2007 and 2008 were 3 spin-offs from MO ((Source: Portfolio Visualizer Premium))
Now that’s what I call dependable income through four recessions.
Cumulative Dividends Since 1997 Per $1,000 Initial Investment
| Metric | S&P 500 | 10 Low Volatility High-Yield Aristocrats |
| Total Dividends | $1,444 | $8,307 |
| Total Inflation-Adjusted Dividends | $772.19 | $4,442.25 |
| Annualized Income Growth Rate | 8.1% | 12.9% |
| Total Income/Initial Investment % | 1.44 | 8.31 |
| Inflation-Adjusted Income/Initial Investment % | 0.77 | 4.44 |
| More Inflation-Adjusted Income Than S&P | NA | 5.75 |
| Starting Yield | 1.8% | 4.8% |
| Today’s Annual Dividend Return On Your Starting Investment (Yield On Cost) | 12.5% | 99.7% |
| 2022 Inflation-Adjusted Annual Dividend Return On Your Starting Investment (Inflation-Adjusted Yield On Cost) | 6.7% | 53.3% |
(Source: Portfolio Visualizer Premium)
Twenty-five years of delivering 50% faster income growth than the S&P 500.
A 4.8% yield in 1997 (same as today’s) became 100% yield on cost and 53% adjusted for inflation.
- for every $1 invested in these aristocrats in 1997 they are now paying $0.53 per year in inflation-adjusted dividends
- that are expected to grow yyyyyy10% to 11% per year
Six times more income than the S&P 500 and 4.4X your initial investment back in inflation-adjusted dividends.
How To Turn These Low Volatility Aristocrats Into An Even Lower Volatility Retirement Portfolio
What if you’re not comfortable with 20% tobacco exposure? What if a 30% peak decline in the GFC, the second-worst market crash in US history, is too much for you to avoid panic selling?
Then look at how we can easily crank up the low volatility to 11.
The DK ZEUS strategy is a way to build a long-term recession optimized portfolio that:
- ZEUS = Zen Extraordinary Ultra SWAN portfolio
- offers far better yield than a 60/40
- offers market-like long-term returns
- but with 33% to 50% lower annual volatility
- and 50% smaller peak declines than the market during even the most extreme market crashes
Here’s how we go about building a ZEUS portfolio.
- 33% blue-chip ETFs
- 33% hedging assets (cash, bonds, managed futures, alternatives)
- 33% individual blue-chips
In this case:
- 11% SCHD or VYM (gold standard high-yield blue-chip ETF)
- 11% IYK (iShares consumer staples ETF)
- 11% VHT (Vanguard Healthcare ETF)
- 16.67% EDV, ZROZ, or TLT (long duration US treasury ETF)
- 16.67% managed futures (DBMF, GIFMX, PQTAX, or AMFAX)
- 33.33% these low volatility high-yield aristocrats (3.33% each)
Now we have a diversified and prudently risk-managed portfolio with the following fundamentals.
ZEUS Ultra Low Volatility High-Yield Aristocrat Portfolio
| Metric | 60/40 | ZEUS Ultra Low Volatility High-Yield Dividend Aristocrat Portfolio | X Better Than 60/40 |
| Yield | 2.25% | 4.7% | 2.09 |
| Growth Consensus | 5.1% | 4.5% | 0.88 |
| LT Consensus Total Return Potential | 7.4% | 9.2% | 1.25 |
| Risk-Adjusted Expected Return | 5.1% | 6.4% | 1.25 |
| Safe Withdrawal Rate (Risk And Inflation-Adjusted Expected Returns) | 2.9% | 4.2% | 1.45 |
| Conservative Time To Double (Years) | 25.0 | 17.3 | 1.45 |
(Source: DK Research Terminal, FactSet)
2X the yield of a 60/40, and with 25% better return potential, and a 45% higher safe withdrawal rate.
What could a 25% higher long-term total return mean for the average retired couple?
- $510,000 average retired couple savings at age 65
Inflation-Adjusted Consensus Total Return Potential: $510,000 Starting Balance
| Time Frame (Years) | 5.1% CAGR Inflation-Adjusted 60/40 | 6.9% Inflation-Adjusted ZEUS Ultra Low Volatility High-Yield Dividend Aristocrat Portfolio | Difference Between ZEUS Ultra Low Volatility High-Yield Dividend Aristocrat Portfolio Consensus and 60/40 Consensus |
| 5 | $654,226.87 | $710,966.64 | $56,739.77 |
| 10 | $839,240.78 | $991,124.63 | $151,883.85 |
| 15 | $1,076,576.22 | $1,381,679.51 | $305,103.29 |
| 20 | $1,381,029.60 | $1,926,133.41 | $545,103.81 |
| 25 | $1,771,581.71 | $2,685,130.58 | $913,548.87 |
| 30 | $2,272,581.10 | $3,743,212.29 | $1,470,631.19 |
(Source: DK Research Terminal, FactSet)
Analyst think this ZEUS portfolio could deliver an extra $1.5 million in inflation-adjusted wealth for the average retired couple over a standard 30-year retirement.
| Time Frame (Years) |
Ratio ZEUS Ultra Low Volatility High-Yield Dividend Aristocrat Portfolio Vs 60/40 Consensus |
| 5 | 1.09 |
| 10 | 1.18 |
| 15 | 1.28 |
| 20 | 1.39 |
| 25 | 1.52 |
| 30 | 1.65 |
(Source: DK Research Terminal, FactSet)
That’s 65% more inflation-adjusted wealth.
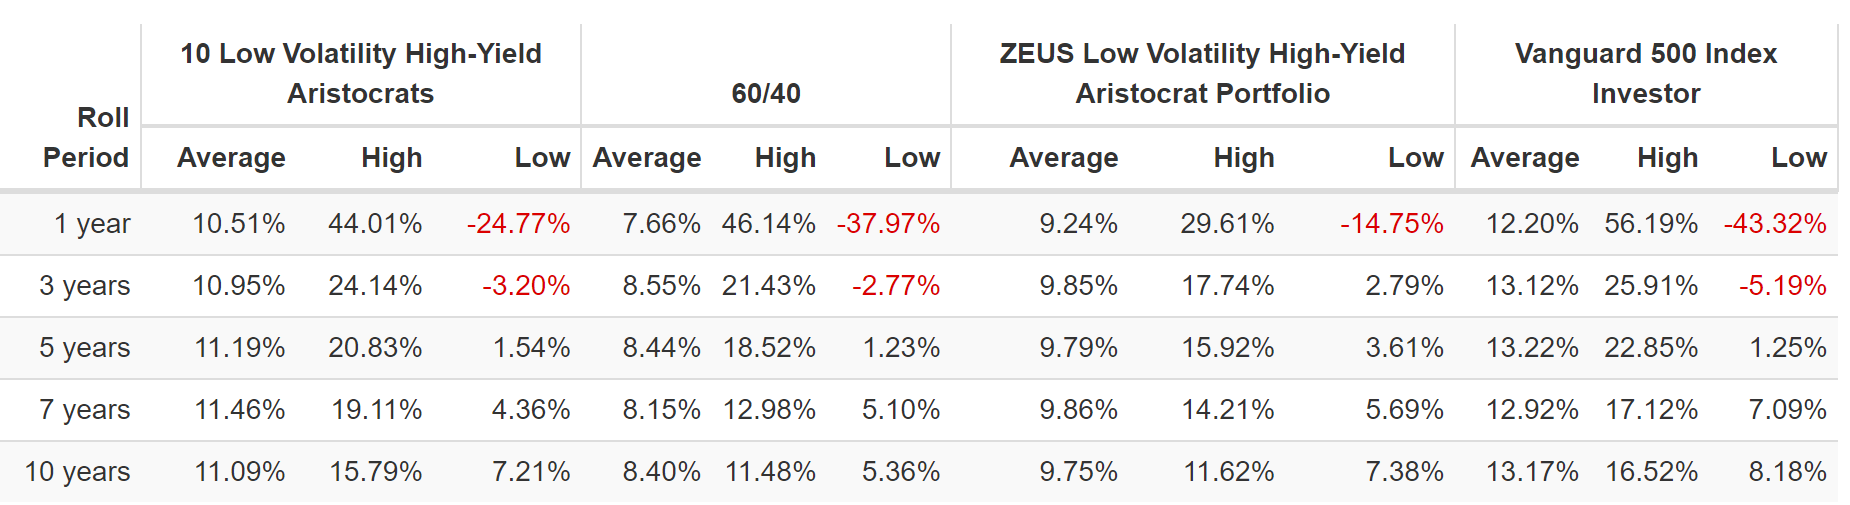
And just take a look at how this portfolio has performed since December 2007, the start of the Great Recession.
Historical Returns Since December 2007
RYMTX for managed futures, VYM for high-yield blue-chips ((Source: Portfolio Visualizer Premium))
Market-like returns? Check.
Much better returns than a 60/40? Yup.
Lower annual volatility? Just 9% per year, 45% less than the S&P 500 and 33% less than a 60/40.
A peak decline of just 17%, almost 1/3rd that of a 60/40 and 1/3rd less than the S&P 500.
2.5X the negative-volatility-adjusted total returns of a 60/40 (Sortino ratio).
RYMTX for managed futures, VYM for high-yield blue-chips ((Source: Portfolio Visualizer Premium))
In 15 years this portfolio has never been underwater for more than two years.
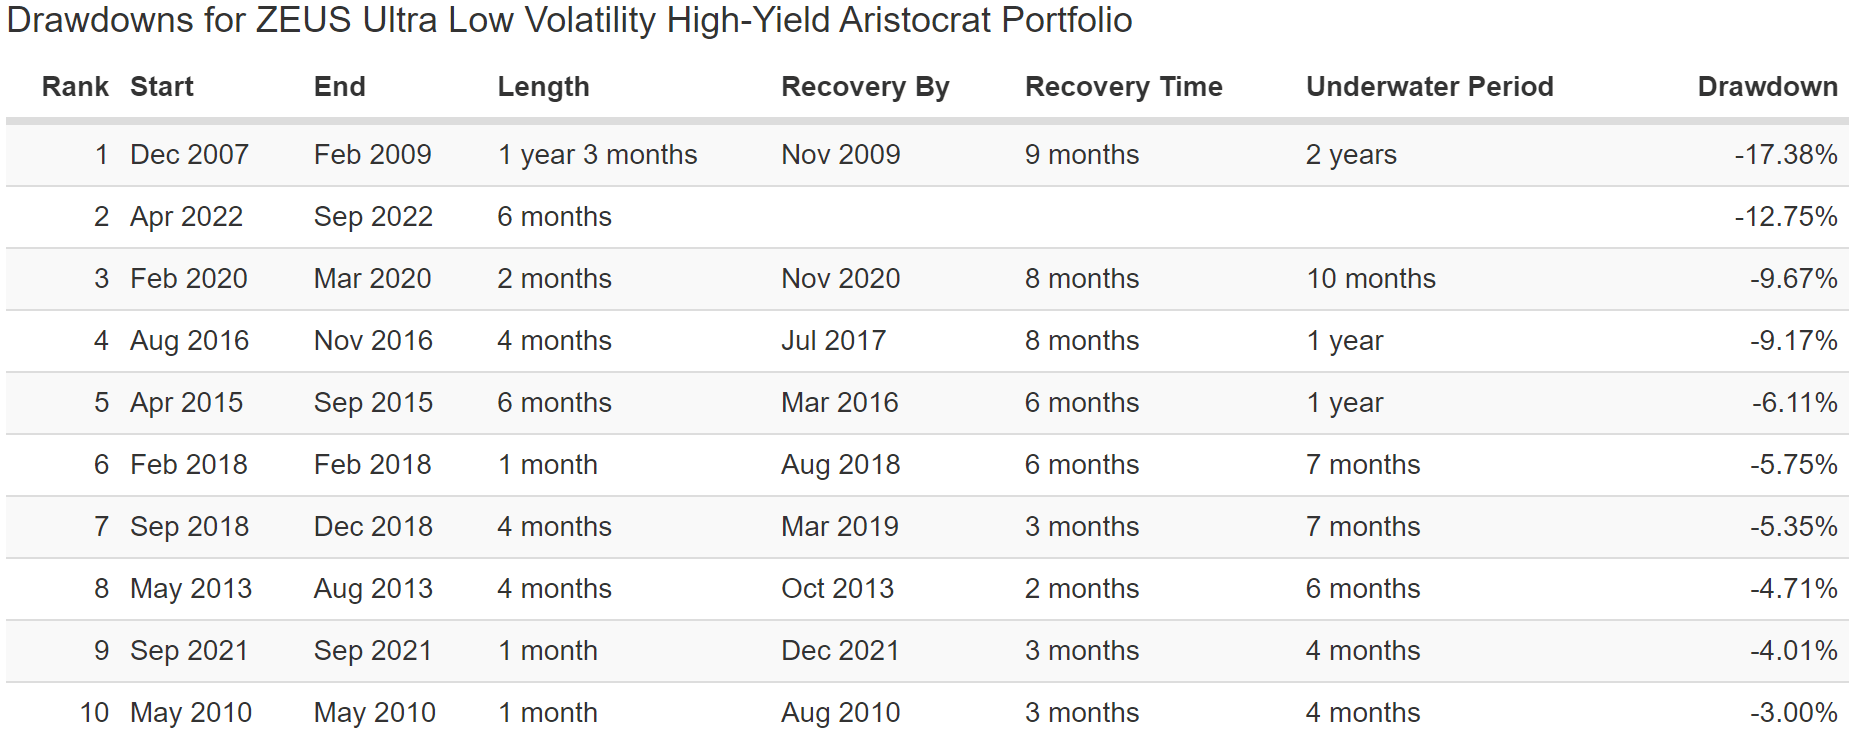
RYMTX for managed futures, VYM for high-yield blue-chips ((Source: Portfolio Visualizer Premium))
Peak decline during the 2022 bear market? -13%, almost 50% less than a 60/40 and 54% less than the S&P 500.
What about the bear markets of the last 15 years?
ZEUS During The 2022 Stagflation Bear Market
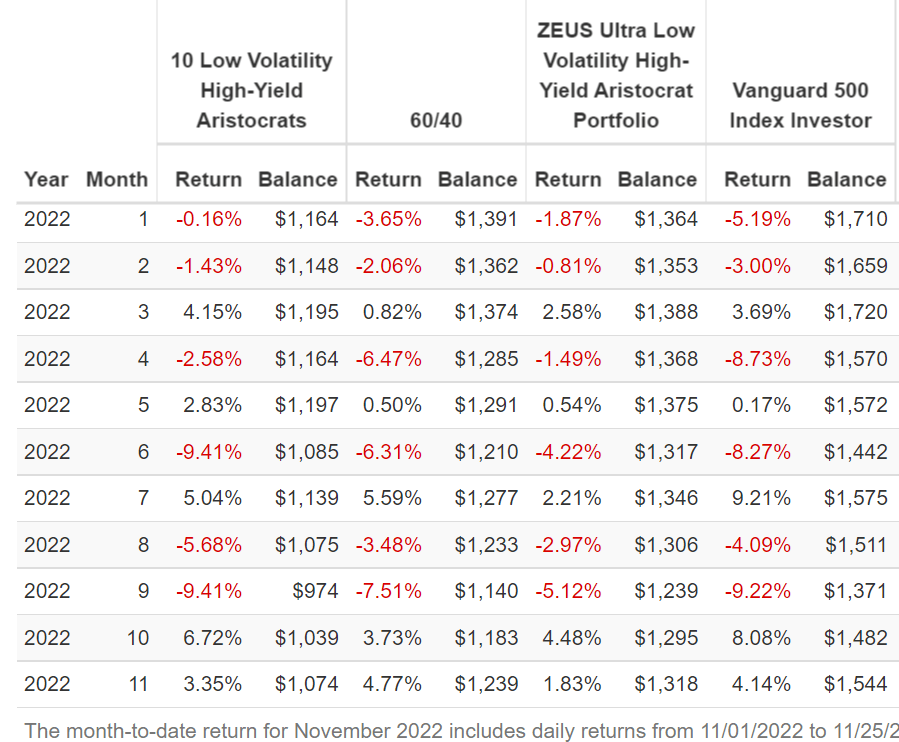
DBMF for managed futures, SCHD for high-yield blue-chips ((Source: Portfolio Visualizer Premium))
A peak decline of 11% during the 2022 stagflation bear market.
When the market fell 9% in September ZEUS fell 5%.
When the market fell 9% in April, ZEUS fell 1.5%.
When the market fell 8% in June, ZEUS fell 4%.
ZEUS During The Pandemic Crash
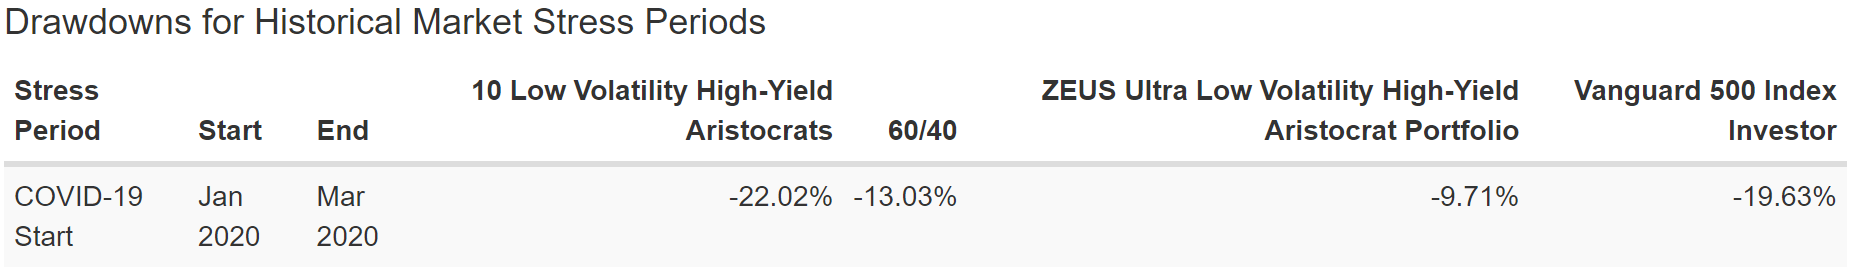
DBMF for managed futures, SCHD for high-yield blue-chips ((Source: Portfolio Visualizer Premium))
ZEUS didn’t even fall 10% during the Pandemic, a decline that was half as large as the S&P 500 and 30% less than a 60/40.
ZEUS During The 2018 Bear Market
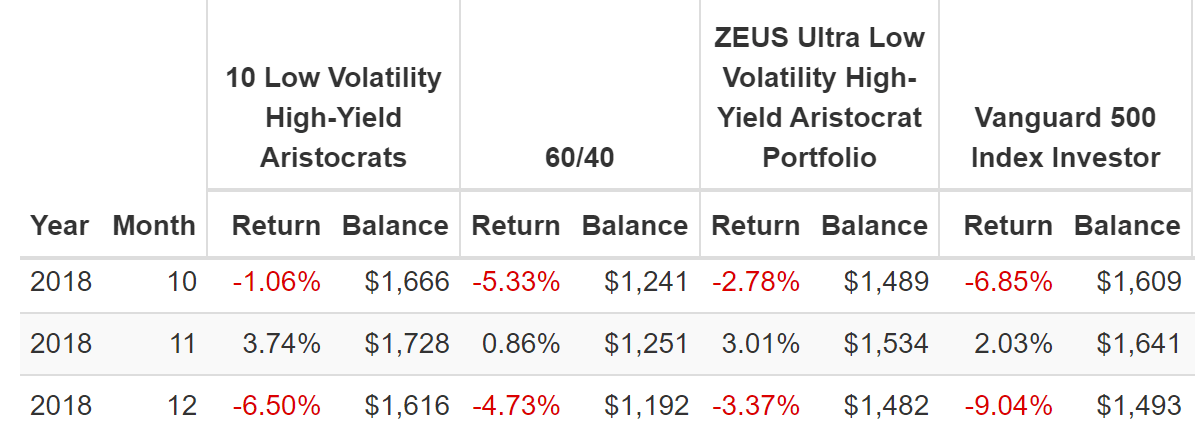
(Source: Portfolio Visualizer Premium) (PQTAX for managed futures, SCHD for high-yield blue-chips)
(Source: Portfolio Visualizer Premium)
On Dec. 24, the S&P hit an intra-day decline of -21% from record highs and a 60/40 fell 9%.
ZEUS fell a peak of 3.6%, 83% less than the S&P 500 and 1/3rd as much as a 60/40.
ZEUS During The 2011 Bear Market
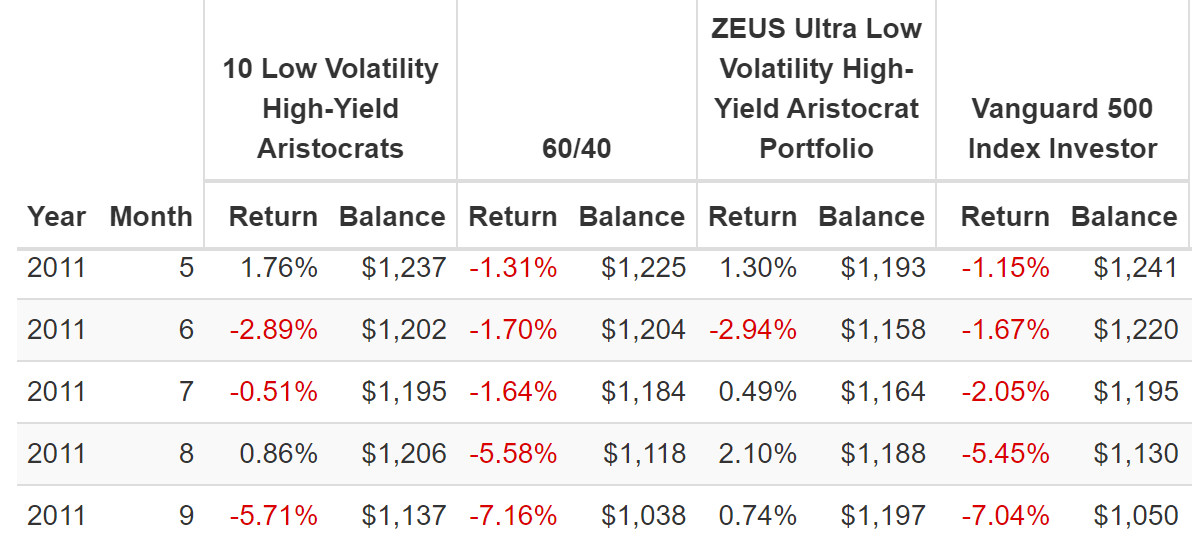
AMFAX for managed futures, VYM for high-yield blue-chips ((Source: Portfolio Visualizer Premium))
During the 2011 bear market the S&P hit a peak decline of -22% and the 60/40 fell 16%.
- ZEUS peak decline 3.9% in June
- it finished the bear market +0.3%
A portfolio that goes up slightly when the market falls by 22%.
- like riding over a major market pothole in a hovercraft
ZEUS During The Great Recession
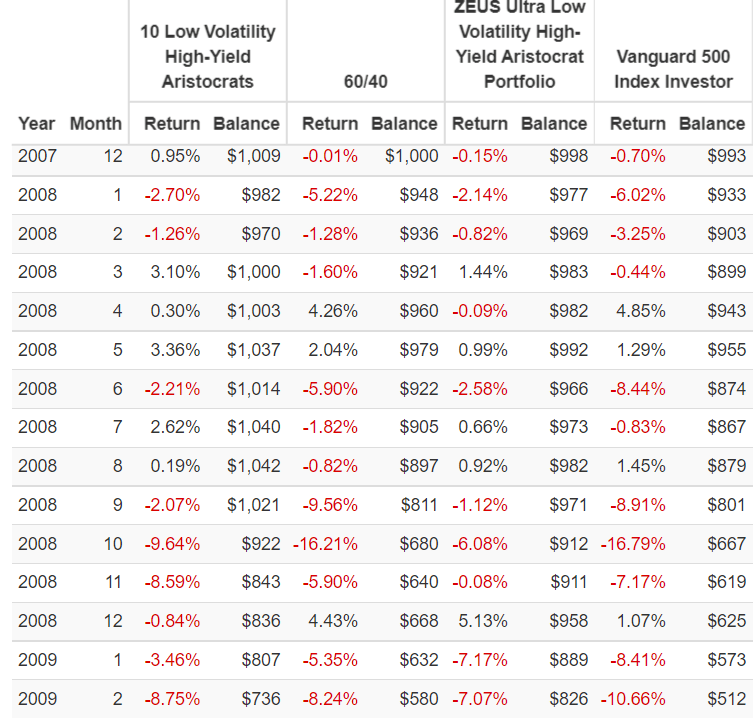
RYMTX for managed futures, VYM for high-yield blue-chips ((Source: Portfolio Visualizer Premium))
The S&P’s peak intra-day decline in the GFC was -58% and a 60/40 -44%.
ZEUS fell just 17% including:
- falling 2.6% in June 2008 when the market fell 8.4%
- falling 1.1% in September 2008 when the market fell 9%
- falling 6% in October 2008 when the market fell 17%
- falling 0.1% in November 2008 when the market fell 7%
- falling 7% in February 2009 when the market fell 11%
This is the power of an ultra low volatility high-yield aristocrat portfolio with prudent diversification and risk-management.
This is how you ride over even the most extreme market potholes in a Rolls Royce.
This is the power of ZEUS, the king of sleep well at night retirement portfolio.
Bottom Line: These 10 Low Volatility High-Yield Dividend Aristocrats Are Perfect For What’s Coming Next
Let me be clear: I’m NOT calling the bottom in these aristocrats or any blue-chip (I’m not a market timer).
Super SWAN quality does NOT mean “can’t fall hard and fast in a bear market.”
Fundamentals are all that determine safety and quality, and my recommendations.
- over 30-plus years, 97% of stock returns are a function of pure fundamentals, not luck
- in the short term, luck is 25X as powerful as fundamentals
- in the long term, fundamentals are 33X as powerful as luck
If you knew for 100% certainty that stocks were going to fall 16% to 26%, then shorting the market with 3X inverse ETFs is the best call.
But we don’t live in a world of certainties, only probabilities.
I have devoted my life to helping people like you build long-term blue-chip portfolio that can:
- generate superior safe and growing income in all economic conditions
- generate superior returns to index funds
- with no more volatility than you can personally stand
And that’s where these low volatility high-yield aristocrats come in: NVS, FTS, NWN, UGI, MO, PM, MDT, ENB, ESS, and FRT.
- 4.7% very safe yield
- average dividend growth streak 41.4 years (since 1981)
- average credit rating BBB+ stable
- 5.4% annual growth
- 10.1% long-term return potential (similar to the returns of the last 26 years)
- 13% annual income growth since 1997
- 10% to 11% consensus income growth in the future
- fell just 30% during the Great Recession vs 58% for the S&P and 44% for a 60/40
If you buy these aristocrats today, you are likely to have a much less scary start to 2023.
More importantly, you’ll be able to achieve strong long-term market-like total returns and super dependable double-digit income growth.
- no hedging asset can offer you this
If you turn these aristocrats into a ZEUS portfolio you give up 1% long-term returns in exchange for the same income and ultra-low volatility.
- 17% peak decline in the Great Recession
- 45% lower annual volatility than the S&P since the Great Recession
Whatever kind of blue-chip portfolio you need, low volatility high-yield aristocrats can help you retire in safety and splendor.
While riding over the market’s largest and scariest potholes in a Rolls Royce retirement portfolio that can withstand anything the economy or stock market can throw at us in the future.
Be the first to comment