

powerofforever/E+ via Getty Images
There are many compelling contrarian investment ideas in the exciting investment climate of late 2022, but few seem “closer to home” than simply buying long-term U.S. government bonds at a fixed rate of around 3.5% per year for 30 years. This trade runs contrary to current inflation fears, with most recent year-on-year inflation rate reported at 8.26%, and counter to the current expectation that the Fed will likely hike rates to 3.75-4% in November. Globally, government bonds are on track for their steepest decline since 1949, so now may be the most contrarian time in decades to not only want to pile into government bonds, but to do so at the longest fixed rate maturity available.
In this article, I will argue that I see the current inflation surge and Fed response as a short-term blip before a return to a “new normal” level of sub-2.5% interest rates over much of the next 30 years, over which a 3.5% long bond offers a 1% annual risk premium. 1% per year may not sound like much of a premium, but when applied to bonds with a duration over 20 years, a 1 percentage point decline in yields can mean a 20%+ rate of return over a very short time period.
My preferred exchange-traded fund (“ETF”) vehicle for this trade is the PIMCO 25+ Year Zero Coupon U.S. Treasury Index Exchange-Traded Fund (NYSEARCA:ZROZ), with the iShares 20+ Year Treasury Bond ETF (NASDAQ:TLT) a distant second choice, but one allowing listed options strategies we will look at later. As the below ETF screen shows, ZROZ has the most negative 1 year total return of any bond ETF as of this writing, with TLT being a much bigger and more liquid ETF with the 8th most negative 1 year total return. For comparison, the Vanguard Total Stock Market ETF (VTI) is only down around 20% over the same period, and even the Vanguard Total International Stock Market ETF (VXUS) decline of 28.5% is less than that of TLT and much less than that of ZROZ.
SeekingAlpha ETF Screener, 25 September 2022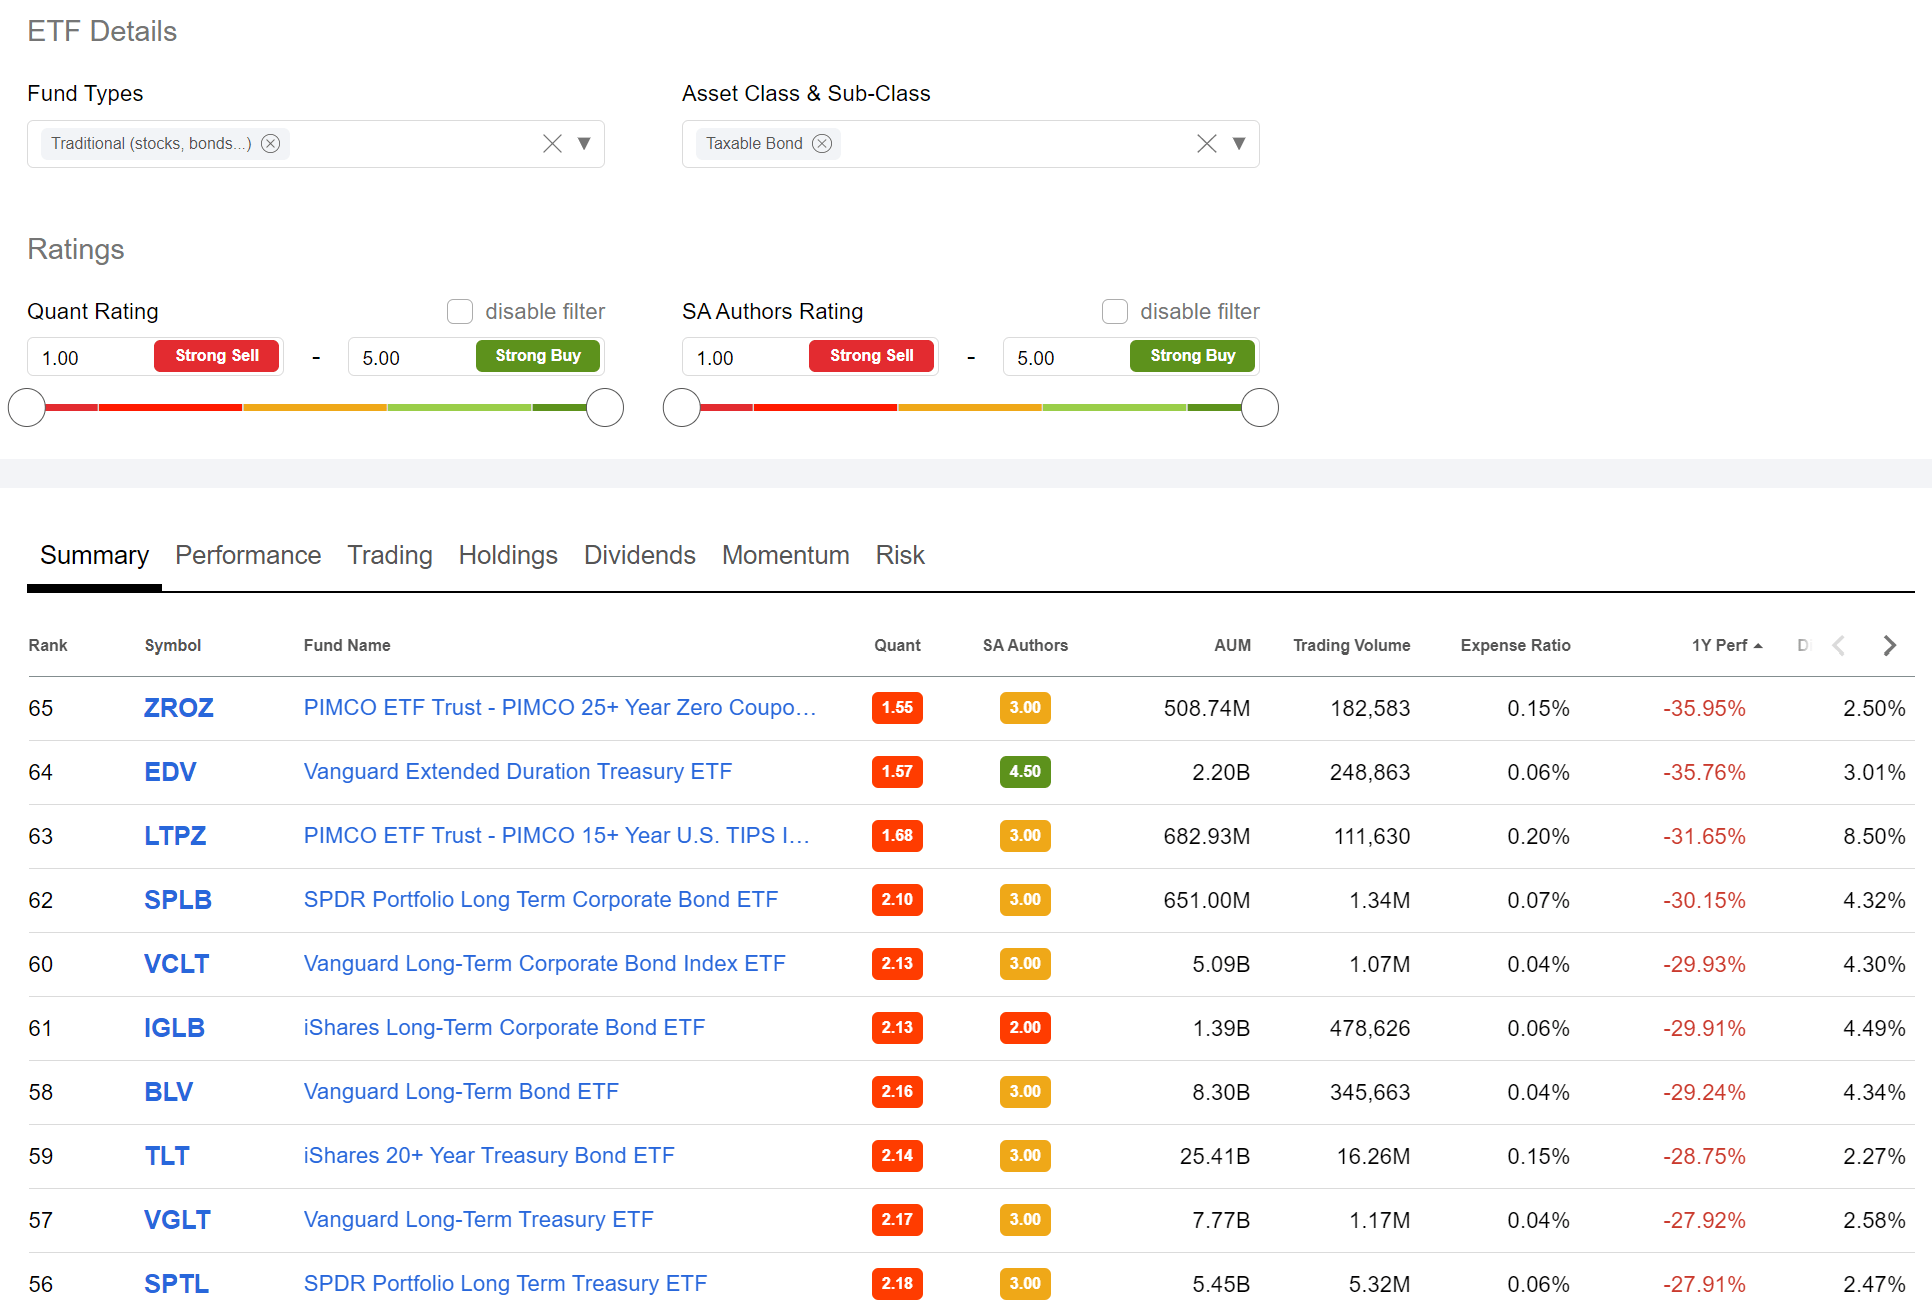
In considering this trade, I am evaluating three different scenarios:
- The U.S. economy returns to the “new normal” seen in much of the 2010s, with the Fed Funds rate cycling between 0-2.5% for the next several decades. This assumes that the current Fed hikes quickly get inflation back under control, and that America’s older demographics are the dominant factor depressing inflation, growth, and interest rates as they have in Japan and Europe for the past decade, or
- The Fed manages to stay behind the curve, and inflation gets out of hand, with the dollar losing half or more of its purchasing power over the next decade, as the U.S. saw in the 1970s, or
- The US manages to enter another golden age of real growth, where inflation rates manage to remain relatively modest at 2-3%, while the U.S. economy “booms” as it did in the 1980s and 1990s.
Scenario #1 is my bull case for ZROZ and TLT, as that is the scenario where those ETFs would have locked in 3.5% over a 30 year period where the average interest rate is much lower. Scenarios #2 and #3 are both bear cases for ZROZ and TLT for two different reasons: one due to inflation, and the other due to higher rates from a strong economy, and for those I present a contrarian “60/40” portfolio later in this article for dealing with those two scenarios.
A Brief History Of Inflation And Interest Rates
The chart below begins a little over 51 years ago on August 15th, 1971, the day Nixon broke convertibility between the U.S. dollar and gold. I believe one of the simplest explanations of the rise of inflation and interest rates in the 1970s is that that was the decade that the Federal Reserve was getting used to the “new order” of managing inflation in a currency whose supply was no longer linked to the supply of gold. Paul Volcker famously raised the Fed funds rate to double digits in the late 1970s and early 1980s (as seen in the “double dip” recession market by the two vertical grey bars), finally putting an end to that inflationary decade and ushering in the 40-year period of low inflation and falling rates since.
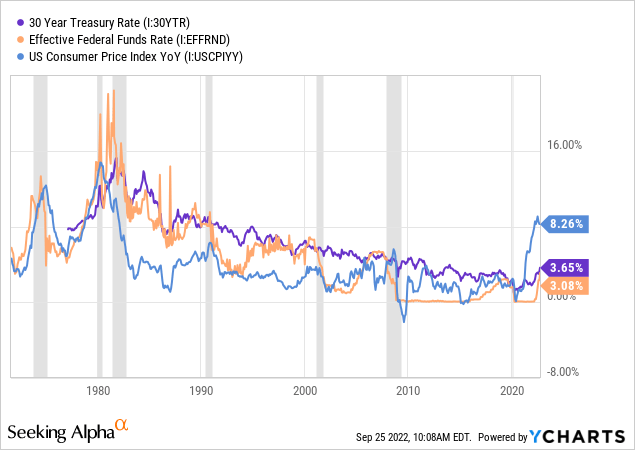
Although we have seen brief periods where the year-on-year inflation rate or Fed Funds rate has briefly shot above the 30-year bond yield, we can see such periods are quickly followed by recessions which drive inflation and the Fed Funds rate back down well below the 30 year bond yield. Current Fed chair Jerome Powell recently made the explicit statement that “recession may be the cost of crushing inflation,” which I see as a clear sign that the long-term bond market is probably right about the recent spike in rates and inflation likely being a short-term blip.
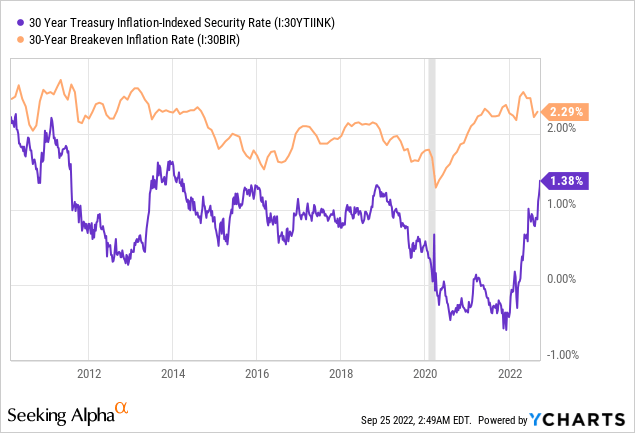
If we break down the 30-year bond yield into real return and inflation expectations (which we can trade separately via Treasury Inflation Protected Securities aka TIPS), we see that the market’s 30-year inflation expectations seem to have settled back around their pre-COVID average between 2-2.5% since early 2021. Much of the rise in yield (decline in value) in long bonds in 2022 then has been due to the sharp rise in real yields back to pre-COVID levels, not a rise in inflation expectations above pre-COVID levels. While some investors might prefer to wait and hope to get 2% real yields sometime in the future, I make the case in the next section why demographics make even 1.38% a good real yield to lock in for the next 30 years.
Demographic Headwinds
In 2018, I made the case that “3% is the new 5%,” with cyclical, technological, and demographic reasons for the “new normal” long-term interest rate being lower in the 2010s than it was in the 1990s and 2000s. In the 2020s, I think it is fair to estimate that “2-2.5% may be the new 3%”, which is why I think 30-year bonds look so attractive at 3.5%. In short, the cyclical and technological deflationary forces I mentioned in 2018 are still here, and the demographic headwinds only seem to have strengthened, with marriage rates being one key number to watch. The below chart from the CDC ends in 2018, but already shows quite clearly how the rise in marriage rates preceded the rise in inflation and interest rates in the 1970s, and how the decline in marriage rates since 1980 match the decline in interest and inflation rates.
CDC.gov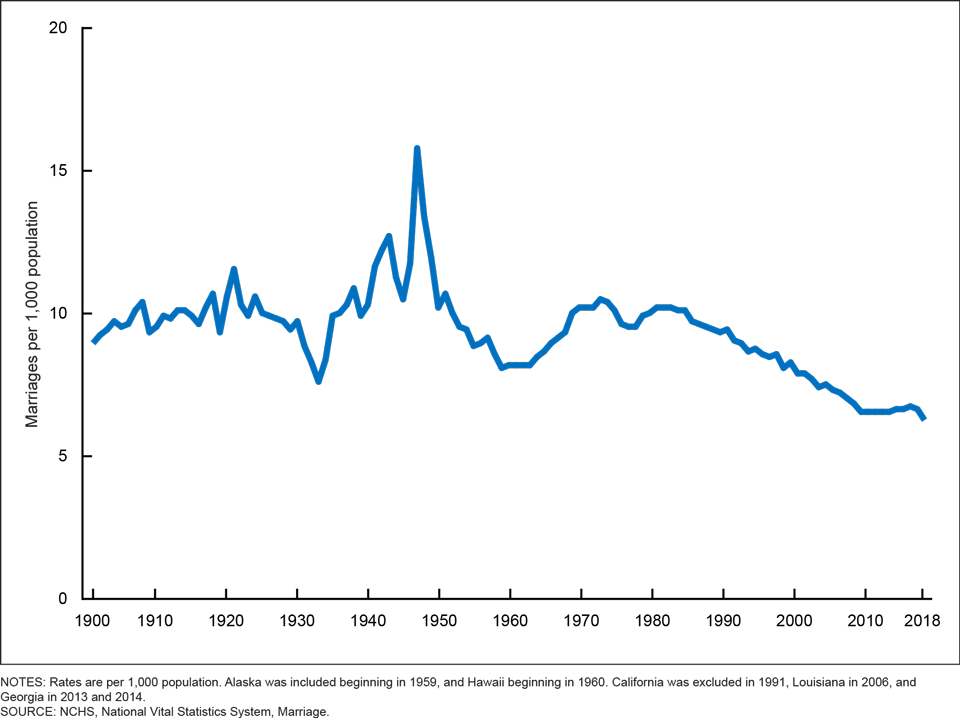
While marriage rates are not a perfect indicator, they are still a “pretty good proxy” for demographic factors driving economic and interest rate variables. Couples get married not only to produce children/population, but also to take out mortgages and buy houses, and to give breadwinners more motivation to go out and produce. I am still looking for reliable data on U.S. marriage rates since COVID, but at least one report indicates the pandemic has had a significant negative impact on marriage and birth rates in China.
Longer-term, one main demographic variable to watch is the population growth rate, which has been volatile during the pandemic, but has been on a clear downtrend in the U.S. since the early 1990s.
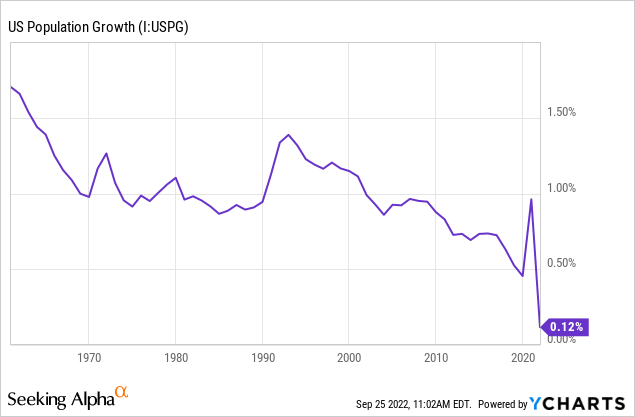
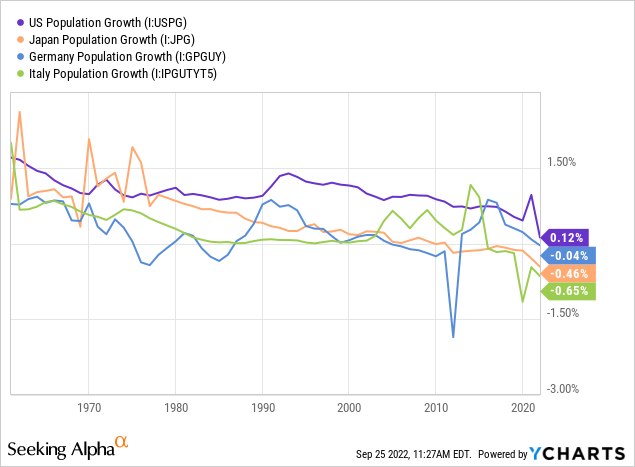
I wanted to chart the U.S. rate above separately to show the downtrend over the past 30 years, but this next chart shows that the U.S. population growth rate is still relatively healthy compared with the rest of the developed world. As examples, I chose countries with among the highest median ages in the world, Japan, Germany and Italy, as examples of countries whose population growth rate decline trends preceded those in the U.S. by about 20-30 years.
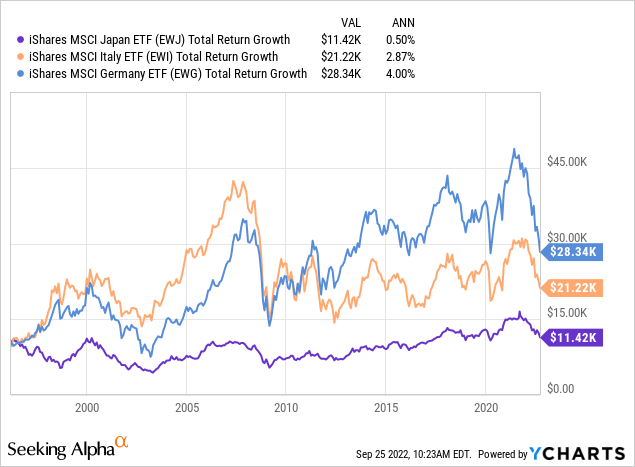
Although ETFs tracking these three countries’ national stock markets only launched in 1996, MSCI Japan’s and Italy’s net U.S. dollar returns over the past 26 years since both averaged less than 3% per year, and MSCI Germany’s average return of 4%/year was only slightly higher than today’s 26-year bond yield. Of course there are many other variables, but it is worth keeping these in mind, as three other data points of what rates of return investors might expect over the next three decades from ageing economies with this kind of volatility, making a guaranteed 3.5%/year seem not too bad by comparison.
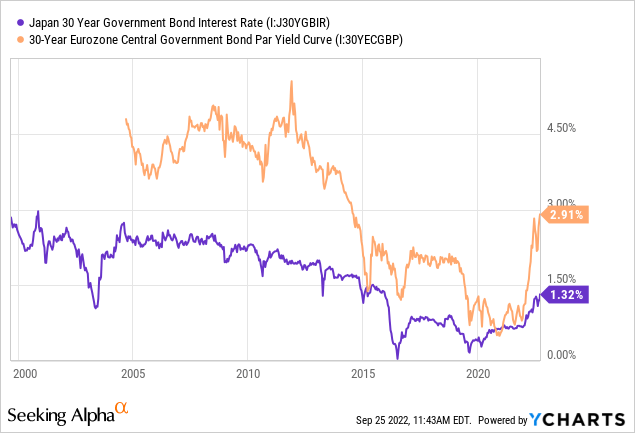
On the bond side, we have also seen Japanese and European long-term bond yields weighed down to consistently lower than U.S. levels, especially since the 2008-2009 financial crisis. We have seen 30-year yields in both markets rise this year as they have in the U.S., but these still remain significantly below the 3.5-3.6% U.S. 30-year yields.
One of my favorite examples of how to make a lot of money in government bonds quickly is the 100-year 2.1% bond issued by Austria in 2017, and that bond soared in value to 200 in 2019 when yields fell to less than 0.7%. The below chart was tweeted by Mohammed El-Erian in 2019:
@elerianm on Twitter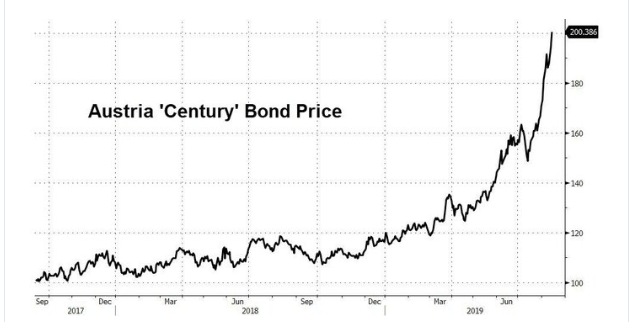
The U.S. treasury unfortunately doesn’t issue 100-year bonds, so the long-term zeros in ZROZ, described next, are about as good as U.S. ETF investors can get for long-term US rate exposure. For what it’s worth, there is a Disney 7.9% bond due in 2095 that last traded at a 5.38% yield last month, but as a rule, I wouldn’t allocate more than 1% of my portfolio to any corporate credit risk, while I could imagine a prudent investor allocating 40% or more to a single T-bond.
Why ZROZ and TLT
If I have to use an ETF rather than buying bonds directly, ZROZ is my top choice for the “long end” of the curve because its portfolio and exposure to long-term rates is so simple. Below is a snapshot of the latest holdings from the ZROZ website, showing an almost equally weighted portfolio across 21 bonds that are probably the simplest bonds in the world to understand. If we take the first one as an example, you can pay $3,905 today to be guaranteed a single payment of $10,000 from the U.S. government on May 15th 2047 – bonds really don’t get any simpler than that. I calculate the yield in the far right column on a continuously compounded basis, for example: -ln(0.3905)/24.6 years = 3.8%.
PIMCO ZROZ website, author’s edit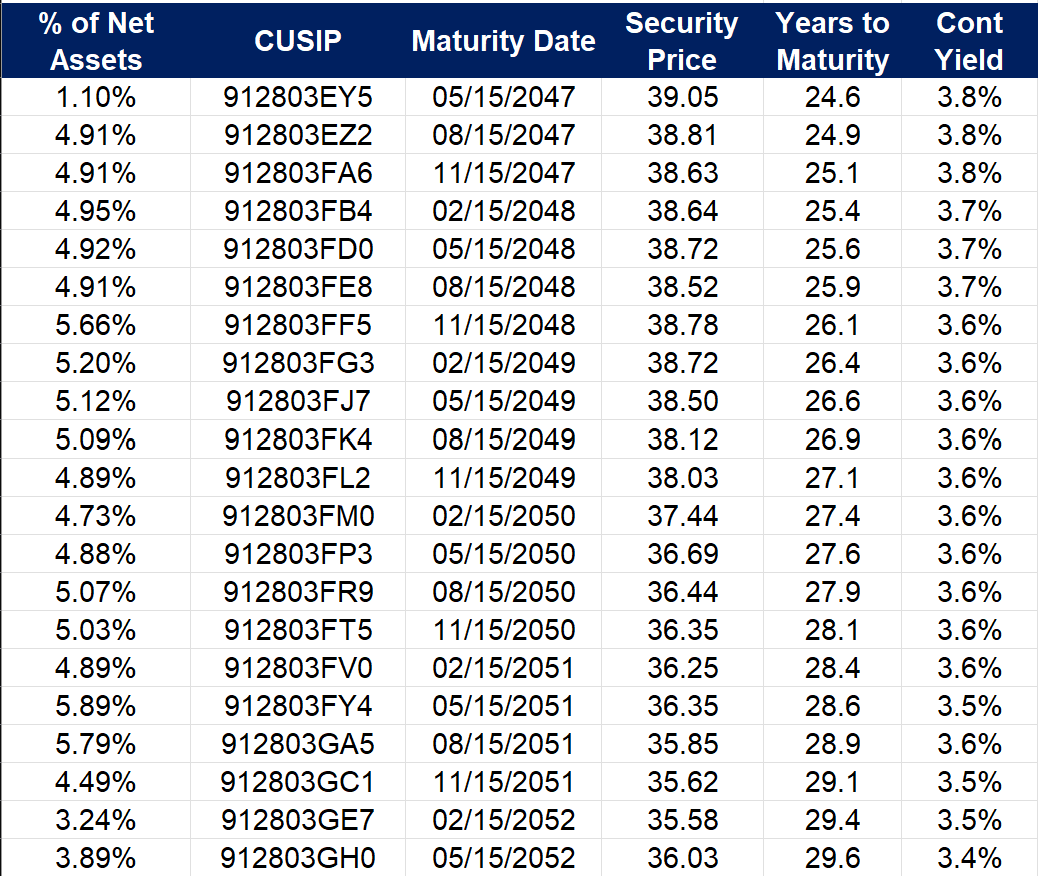
If I am right about long-term yields collapsing back down to around 2.5% over the next 3 years, that would raise the price of the May 2047 zero from 39.05 to 100*exp(-0.025/yr*21.6 years) = 58.27, a 49% return or 14.2% annualized over the three years. On the other hand, if I’m wrong and the yield rises to 5%, that bond only declines in value to 100*exp(-0.05/yr*21.6 years) = 33.96. In other words, I see these long-term zeros as an “asymmetric” trade with more upside than downside given these two assumed future interest rate paths. This asymmetric upside for equal-sized moves in yields is called “convexity” and one reason to prefer longer-term and zero-coupon bonds, which tend to have higher convexity.
One detail that makes bond ETF returns a bit more complicated than trading these zeroes directly is that ZROZ will soon sell all of its bonds maturing in 2047 and replace them with bonds maturing in 2052 and 2053 to maintain the “25+ year” exposure it promises. It is not difficult to keep track of these rebalances, but this is something to keep in mind if you use ZROZ, or almost any other bond ETF, instead of trading the bonds directly.
TLT is my very distant second choice for an ETF to gain this long-term interest rate exposure for two main reasons: its use of coupon bonds makes the math a bit more complicated, and TLT’s duration and convexity are significantly lower than ZROZ’s. TLT reports an effective duration of 17.8 years versus 26 years for ZROZ, which is why TLT declined less than ZROZ as yields rose over the past year, but also means TLT will rise less than ZROZ if yields fall as I expect.
The one advantage that might have me use TLT instead of ZROZ, due to its size and greater liquidity, is that TLT has many more listed options than ZROZ. The below option chain is for TLT options expiring in January 2024, and there are, of course, many option strategies we could put together with these puts and calls. One simple one I might consider, just off the bottom of this screenshot, is buying the 120-130 call spread, where I would pay around $250 today for a payoff of $1,000 in January 2024 if TLT rises to 130 by then, but the most I could lose is the $250 premium if TLT remains below 120. For reference, TLT started 2022 at just over 140.
SeekingAlpha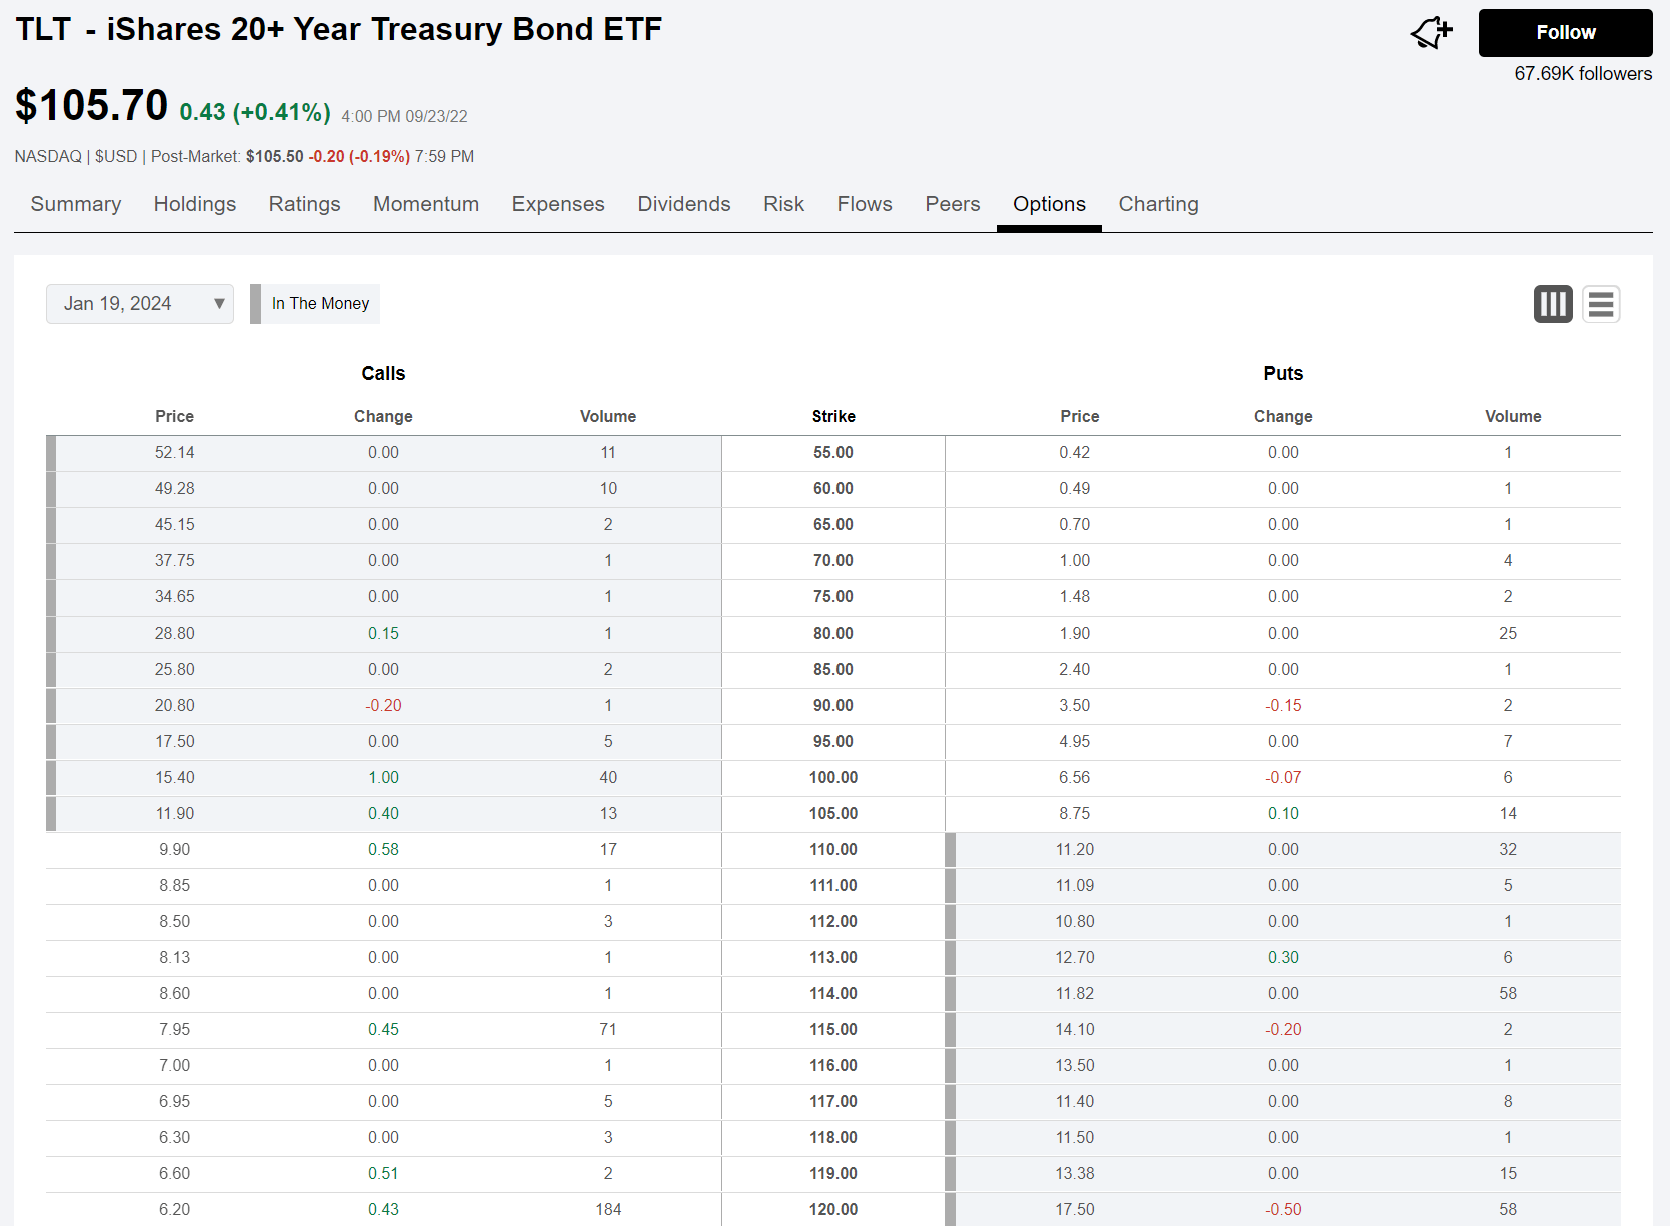
Risks and a 60/40 Solution
At the beginning of this article, in addition to my “bull case” for ZROZ, I also listed two “bear case” scenarios where either a return to 1970s stagflation, or a return to 1980s-1990s strong economic growth, might drive U.S. bond yields back up to 5% or higher. I see both scenarios as bearish for bonds but bullish for equities, though two different categories of equities, and for that reason I say the return of +1.38% real bond yields also spells the return of the traditional “60/40” portfolio of 60% stocks and 40% bonds. In this section, I present two different portfolios that are 40% ZROZ and 60% stocks as a way of balancing exposure to these bull and bear case scenarios.
In my second “back to the 1970s” scenario above, higher rates are due to higher than expected rates of inflation, and not due to economic growth, and so the Fed needs to keep rates lower than it otherwise would to try and keep unemployment from rising too high. This scenario would mean a long-term decline in the U.S. dollar relative to foreign markets, especially emerging markets. For this reason, I would put my 60% equity allocation in this 60/40 portfolio in the Dimensional Emerging Markets Value ETF (DFEV). On the equity side, emerging markets are about as contrarian as equities get in 2022, and while some may consider a 60% emerging market portfolio aggressive, I have proposed 60% EM portfolios before.
My third “ready for the 80s” scenario is one where U.S. stocks might continue doing better than international stocks, and in this case I might be aggressive and chose the Dimensional U.S. Small Cap Value ETF (DFSV) for the 60% equity allocation. A 60% U..S stock + 40% U.S. treasury portfolio may not look contrarian at all, but I still see this equity part as contrarian because of WHY we justify it: we are betting on a very optimistic U.S. economy scenario I believe most would agree is extremely non-consensus. What I find so difficult about being bullish on U.S. equities over foreign equities, even in this optimistic 3rd scenario, is that U.S. equities are starting from valuation levels that are still far more expensive in 2022 than they were in 1981. By the CAPE metric, the U.S. is now at 29 while Europe is at 19, versus both being only around 9 at the end of 1981. In general, higher CAPE ratio has implied lower expected returns over the following decade, and that’s why I would still find this portfolio somewhat “contrarian.” That is also why I believe a 100% small cap value allocation may be the better way to allocate to U.S. equity markets at this time. 60% in all-small value + 40% in 30-year zeros may very well be the most contrarian version of the all-American 60/40 I can think of.
Of course, for those that want to try and straddle all three scenarios, that can be balanced with a 40% ZROZ + 30% DFEV + 30% DFSV portfolio.
Conclusion
In this article, I hopefully made it clear why buying 30-year zero coupon U.S. treasuries at a 3.5% yield is a contrarian idea, but one that would win in a likely “new normal” future where ageing demographics keep Fed Funds cycling between 0-2.5% for decades to come. ZROZ provides especially good exposure to this scenario, as ZROZ will gain significantly more if yields decline by 100 basis points than it would lose against a similar rise in yields.
Japan, Germany, and Italy have each provided a preview of how a rising median age has correlated with slower economic growth, lower stock returns, lower interest rates, and eventually a weaker currency. The most likely risk I see to the long ZROZ is longer-term dollar weakness, which I think is best handled with an equity allocation, especially in emerging markets.
Be the first to comment