

maxsattana
Instead of an investment thesis
All last year and since the beginning of this year, I have been bullish on ZIM Integrated Shipping’s (NYSE:ZIM) stock, which is not exactly in my favor against the backdrop of a 69% drop in the stock price (-50% when dividends taken into account). In my recent article on Danaos Corp (DAC) and Global Ship Lease (GSL) – “Danaos Or Global Ship Lease? A Look At Key Factors” – I admitted that I was wrong in many ways in my thinking about ZIM. However, I should also note that I have always advocated taking into account the cyclical nature of this industry and setting stop losses after each entry. This approach would lead to a positive mathematical expectation when we look at the timing of my calls:
Seeking Alpha, author’s coverage of ZIM stock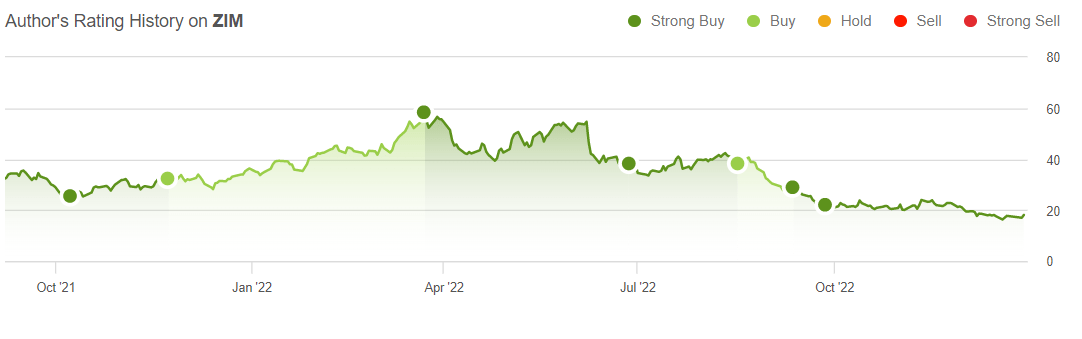
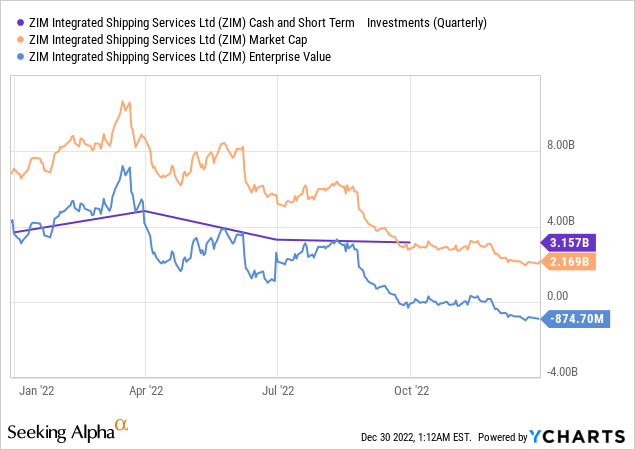
We all know that ZIM is trading at a huge discount, even compared to the cash on the balance sheet – the enterprise value (market capitalization + debt – cash) has long since slipped into negative territory:
Sentiment and anticipation of the next downturn of the cycle – this is what drives the share price action to date. So lately I have been looking at the technical picture to catch more or less understandable moments of mood swings and consequent stock price recoveries in ZIM – this is a variant of medium-term positioning or swing trading, as traders call it. This article will be about just that – I again see a good technical risk-reward setup supported by still solid fundamentals of the company. Get ready to see a lot of charts.
What do I see?
In the last 12 months, ZIM stock has drastically changed its uptrend (since the IPO in early 2021) into a downtrend. On April 12, 2022, it broke through the 200-day moving average for the first time and has not returned above it since mid-June.
However, on the way down, ZIM stock encountered the resistance of the levels of its “growing past” every time – in 90% of the cases, the major pullbacks from the important resistance levels brought an average of 20%+:
TrendSpider, author’s notes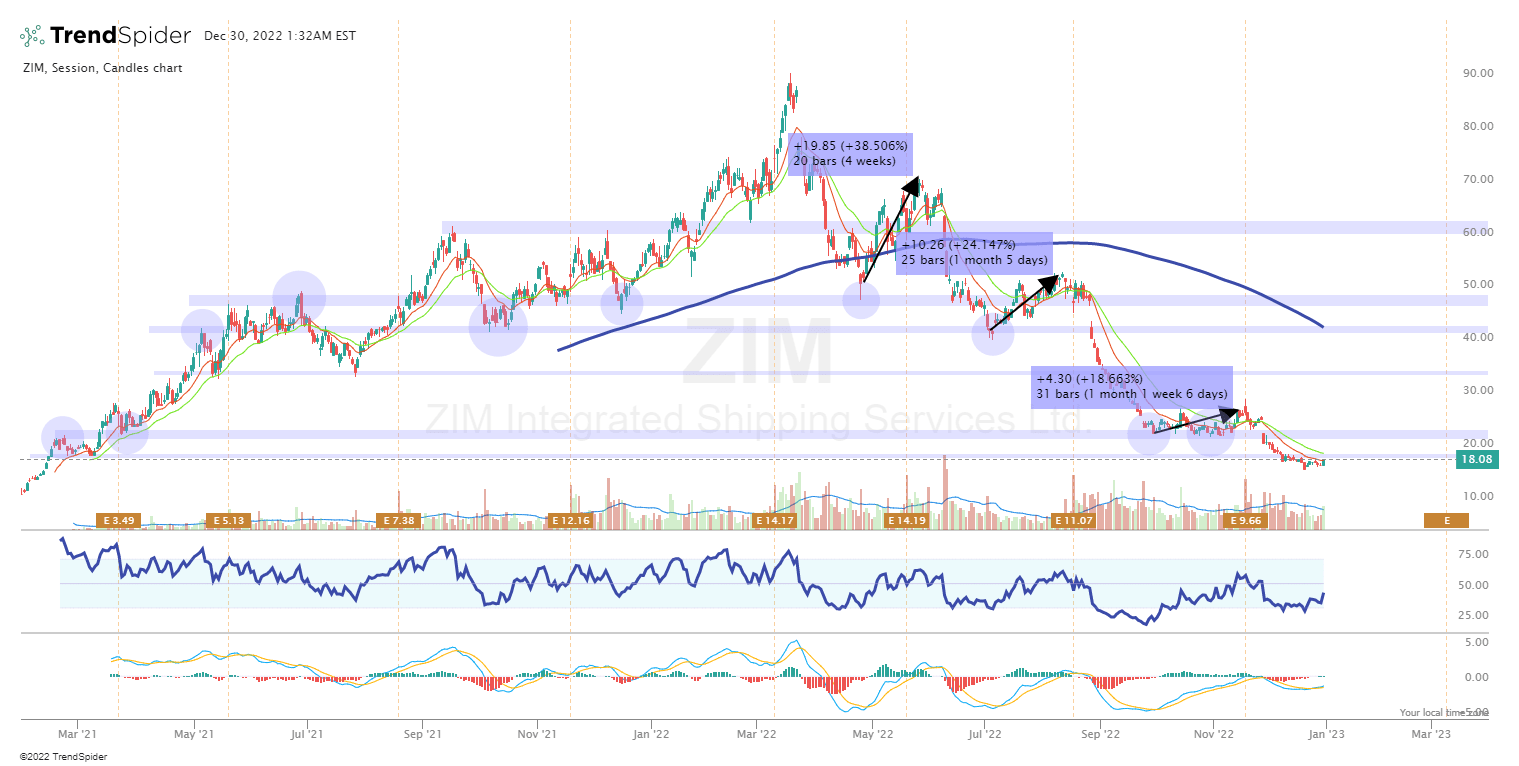
If we take a closer look at the moments when these big pullbacks took place, we will see a similar setup everywhere – an obvious or subtle RSI bullish divergence plus MACD crossing with the signal line, plus a “settlement” at a strong support level:
TrendSpider, author’s notes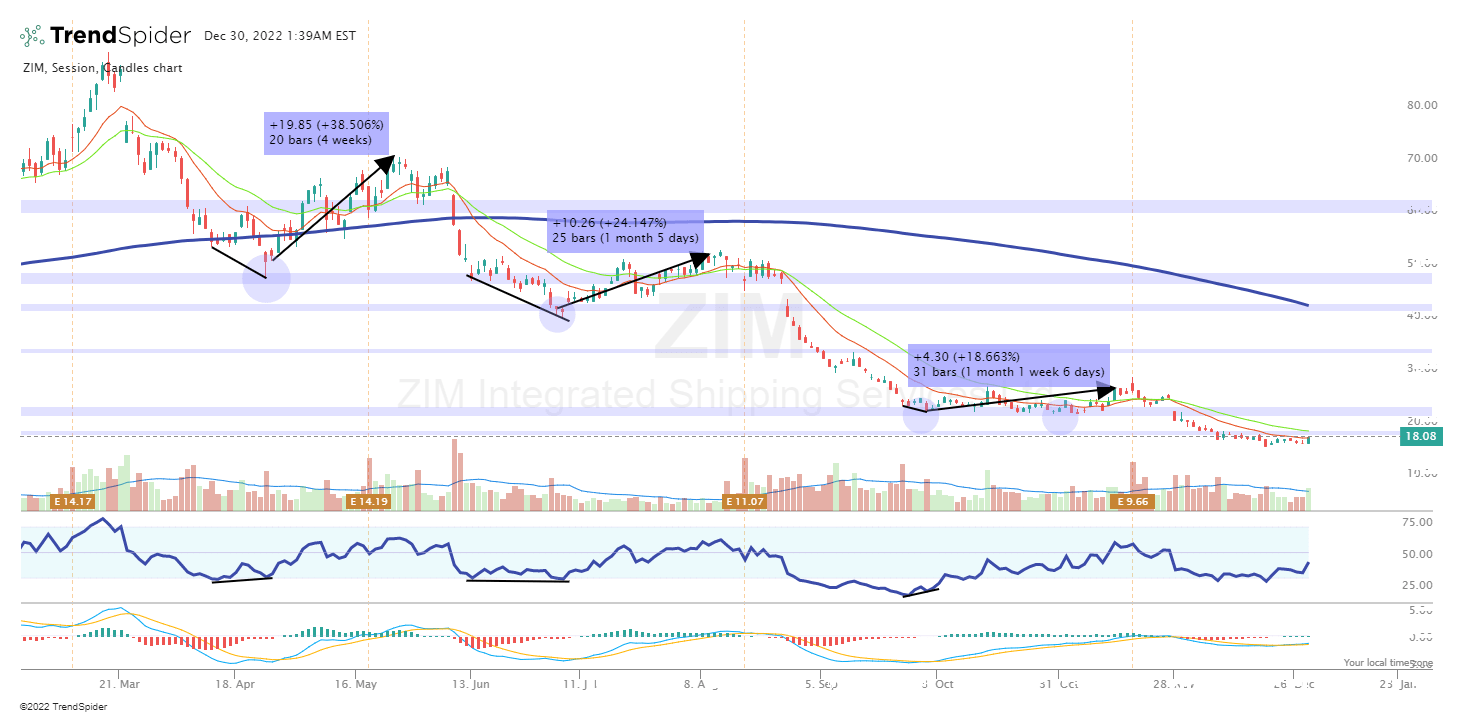
I wrote about a similar phenomenon in my last article on ZIM – “ZIM Integrated Stock: The Rebound Is Near (Technical Analysis)” – in which I tested a hypothetical strategy to buy ZIM when the RSI breaks through at 45 and exit the position when this indicator reaches 60. The strategy then showed 6 positions for the trailing 12 months with a total return of 23.76% during that time. By the way, from that call to the peak of the local rally, ZIM stock gained 19% before falling further.
In my opinion, we see quite an interesting set-up today that looks in favor of the bulls from a risk-reward perspective.
First, ZIM stock has managed to form another low (December 19) from its last local one on September 29 – however, during the same period, the RSI rose from about 20 to about 28-30. The last time such a strong divergence was observed was in early June – as a result, ZIM stock bounced 20% up from its low. And back then, this pattern was inferior to the current one, as the RSI formed a strict horizontal trend line, which is ascending today (i.e. we have a better input today).
Second, the MACD clearly shows us today that the bears are running out of breath again – the same thing happened the last few times. The divergence between the MACD and the signal line began to decrease sharply, which led them to cross on April 27 (+25% to the next local high), July 13 (+17%), and early October (+23%). Today, MACD crossed the signal line in late December at a level higher than previous local reversals. We’ve got way fewer sellers of ZIM stock at its current price levels.
Third, volumes also speak for the conclusions of my second argument. See for yourself: ZIM stock fell sharply right after the company closed the book on its generous dividends – investors thought it was the “last party” and closed their positions in bulk. This led to the panic of the following days, which gradually subsided and drove the average number of shares traded lower and lower. At some point, investors and speculators realized they were in for another dividend and began actively buying up the resulting drawdown. Or an event occurred that caused them to do so on the same day. Whatever the case, buying volumes on a given day increase sharply, showing the stock’s strength, and the old investors gradually return to the ship. We see a repetition of this same pattern today.
Investing.com, author’s notes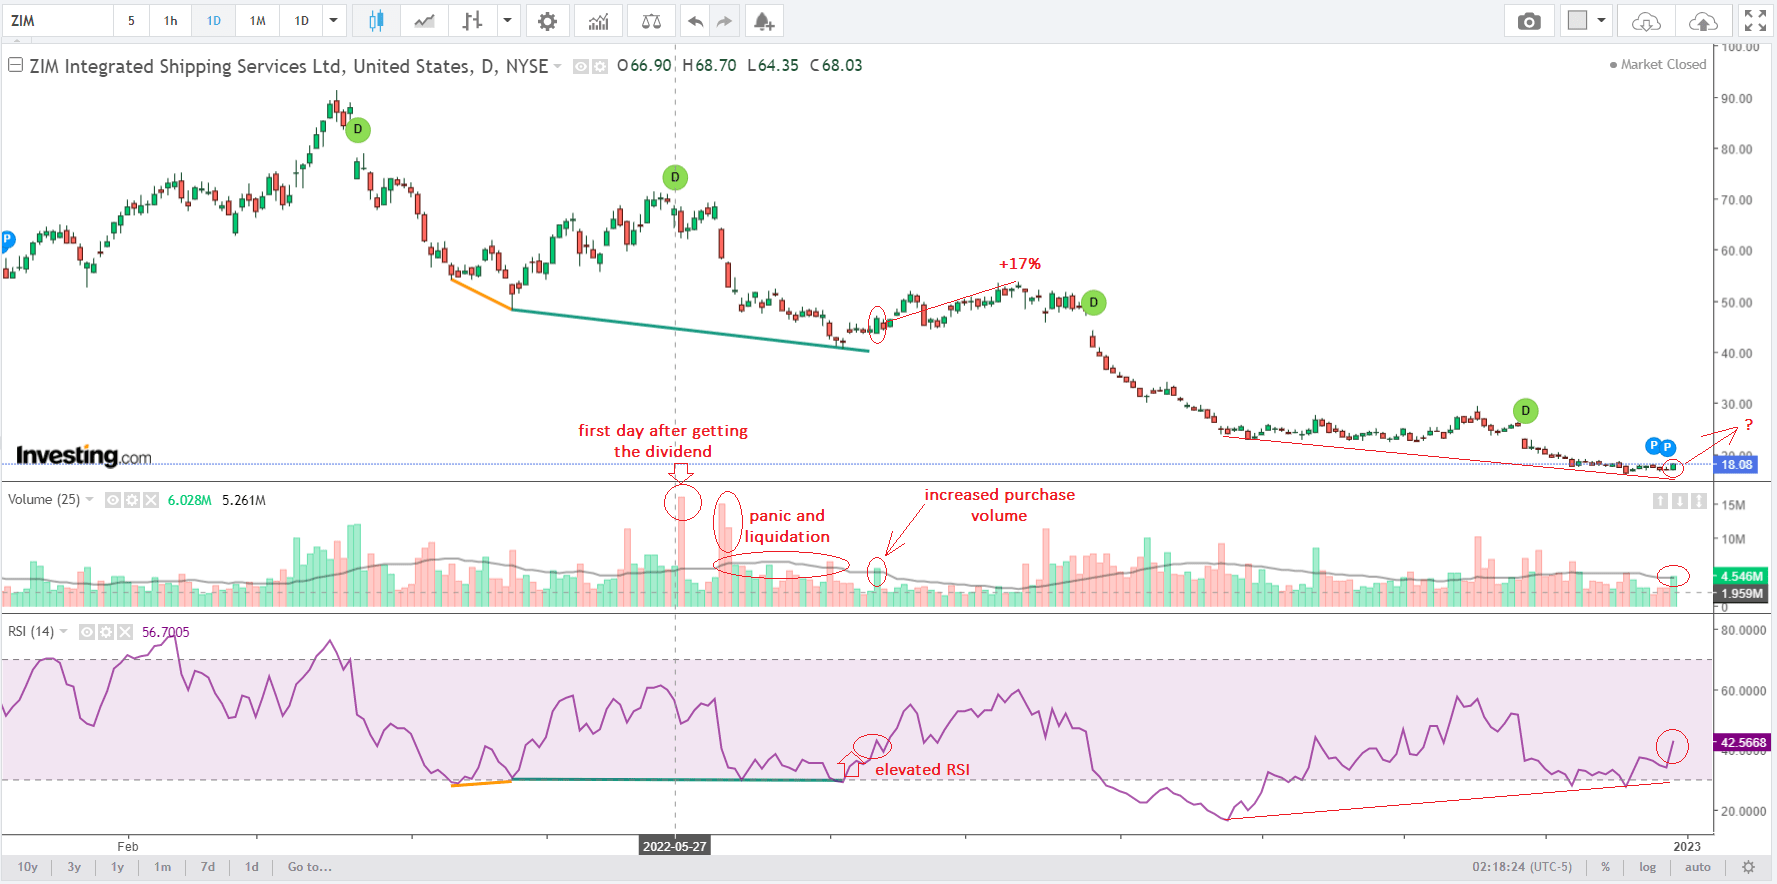
It is important to recognize that these “technical arguments” are subjective and may be interpreted differently by different analysts. The only way to verify their accuracy is through backtesting. I propose testing a trading system that incorporates all of the above factors using actual historical data. Here are my inputs:
| Entry conditions | Exit conditions |
| MACD (12, 26, 9, close) Crosses Up signal MACD (12, 26, 9, close) | MACD (12, 26, 9, close) Crosses Down signal MACD (12, 26, 9, close) |
| MACD (12, 26, 9, close) Less than Constant value of -0.1 | MACD (12, 26, 9, close) Greater than Constant value of 0.1 |
| RSI (14, 70, 30, close) Less than Constant value of 45 | MA Distant (SMA, 20, close) Greater than Constant value of 20 |
| Take Profit = 20% | |
| Stop Loss = 10% |
Source: Author’s inputs in TrendSpider’s Software
Here is the result:
TrendSpider, author’s strategy output TrendSpider, author’s strategy output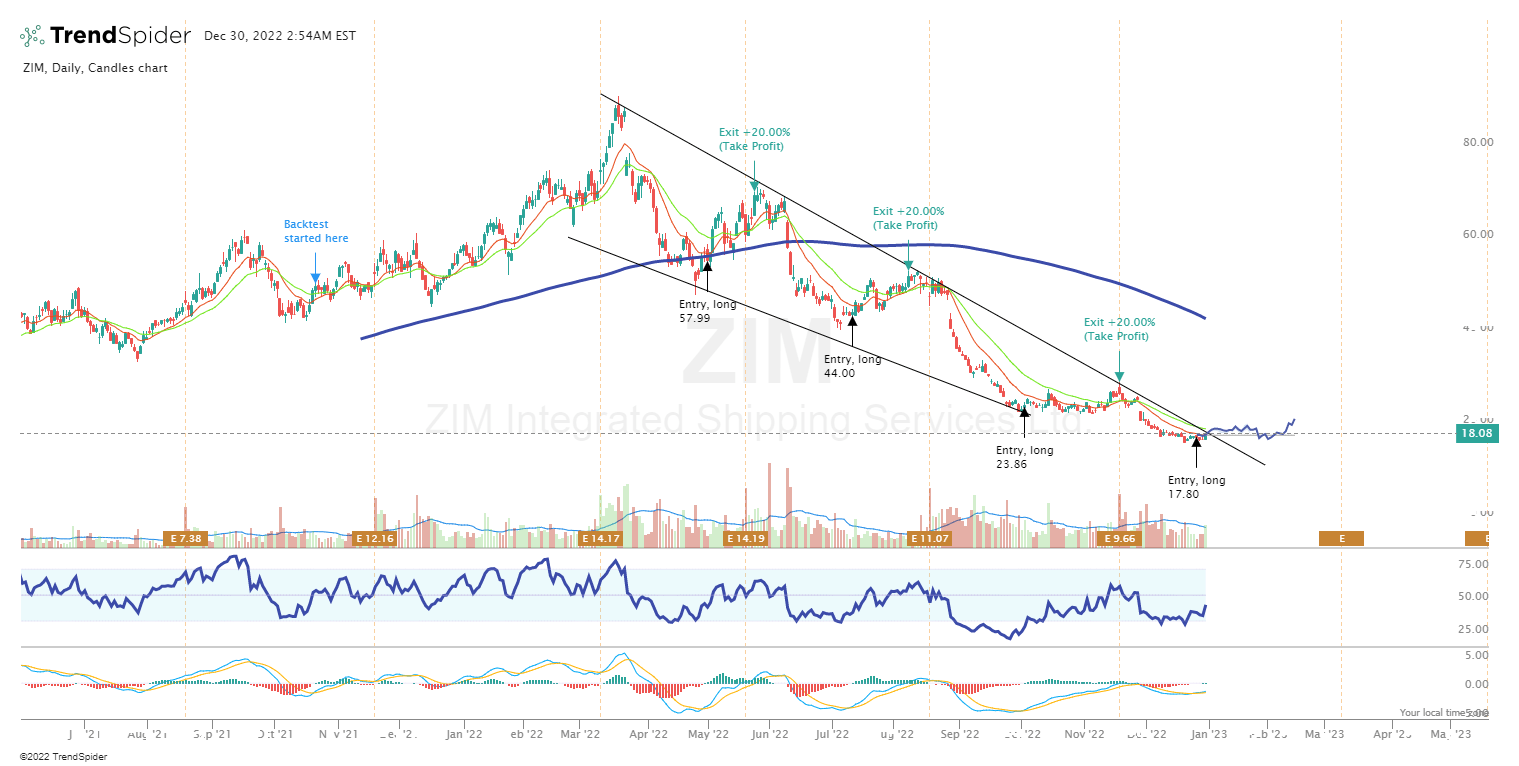
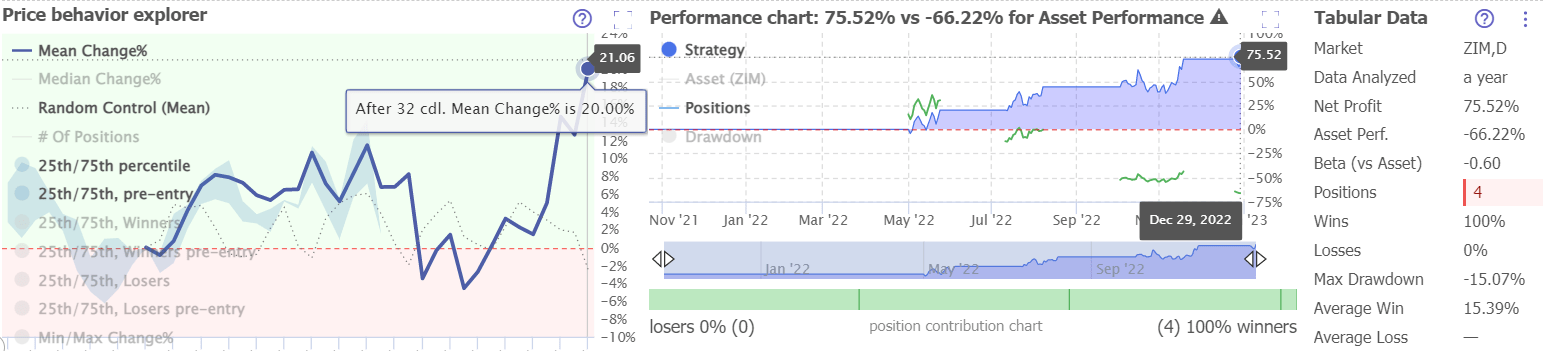
All 4 positions as you can see were taken against the background of compliance with my 3rd condition – the return of volumes after panic sell-offs.
In all 4 cases, the take profit orders came before the stop losses – so the reward-to-risk ratio of 2x was realized. The last time the system called to buy was on December 24, and the price has barely changed since then. From this, I conclude that ZIM stock represents a unique opportunity from a technical analysis perspective to double the risk taken again in the medium term:
TrendSpider, author’s notes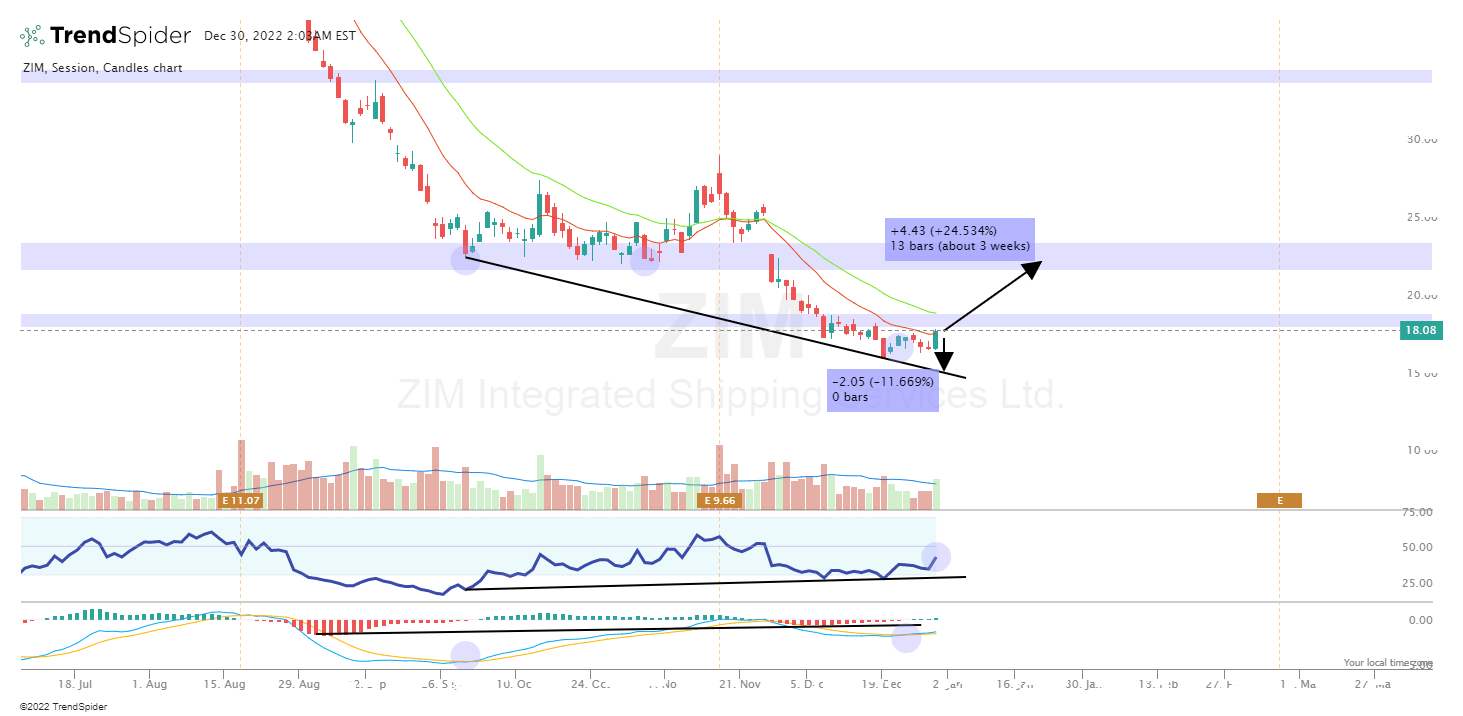
Investors takeaway
I understand that probably most readers of this article wanted to see “a rosy picture of things that should improve shortly for ZIM shareholders.” However, this is not entirely true – again, my understanding of what is happening argues for swing trades in the direction of stock movement, especially such a cyclical like ZIM. So the “buy and hold approach” if you stick with it, can either a) eat up all the value if you do not wait for the cycle to reverse, or b) underperform after a few years (even with dividends) when a new cycle starts. So I recommend you use technical analysis in this case and not just look at the solid TTM-based fundamentals that can change overnight.
So far, however, I see a fairly favorable situation in terms of technical analysis for ZIM stock – MACD crossed up the signal line, there is a bullish divergence between RSI and stock price, and we have seen a comeback of buying activity lately (above-average volumes). All this would have given a potential investor a price return of about +75% over the past year, compared to a “buy-and-hold” return of -50% (with dividends) for the same period.
Of course, I could be wrong in my assessment of ZIM’s price action, because everything I have described above is more art than science, and it would be foolish of me to deny that. Another drop in freight rates could pull ZIM well below the teens, and the negative enterprise value and all the liquidity on the company’s balance sheet could vanish into thin air within a few quarters. That’s the beauty of cyclicality – today you are trading at a discount, but tomorrow you are not, while your shares have not grown, but on the contrary, have fallen even lower. You should consider this before buying ZIM.
In any case, a reasonable stop loss – ideally a couple of times below the target level – should save traders from the risk of too large drawdowns and capital erosion. I recommend considering buying ZIM at its current price levels with a reward-to-risk ratio of 2x because the current set-up has worked flawlessly the last 4 times – statistics are on the side of the bulls today.
Be the first to comment