Japanese Yen, USD/JPY, S&P 500, Coronavirus, IG Client Sentiment – Talking Points
- Coronavirus fears plunged S&P 500 as the anti-risk Japanese Yen rose
- Trader positioning signals hint there may be more room to go from here
- USD/JPY may fall to support as S&P outlook risks turning more bearish
How Can Trader Positioning Impact the Outlook for the Japanese Yen and S&P 500?
In this week’s session, I discussed the outlook for the Japanese Yen against the US Dollar and Australian Dollar while covering a broad sweep of the S&P 500. After the latter experienced some of its worst performance since 2018, the anti-risk JPY gained aggressively as fears on the coronavirus increased. From here, what do traders’ buy/sell bets have to say about the USD/JPY and S&P 500 outlook?
Starts in:
Live now:
Mar 04
( 01:03 GMT )
Recommended by Daniel Dubrovsky
What Do Other Traders Buy/Sell Bets Say About Price Trends?
USD/JPY Sentiment Outlook
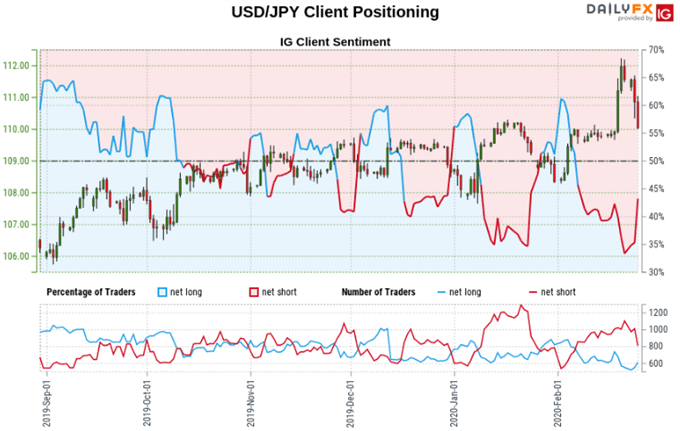
At the time of this writing, IG Client Sentiment (IGCS) is reporting that about 49.69% of traders are net-long USD/JPY. Traders are less net short than yesterday and compared with last week. Recent changes in sentiment warn that USD/JPY may soon reverse lower despite traders remaining net short. From a psychological standpoint, this would speak to an increasing amount of participants attempting to buy the dip.
USD/JPY Technical Analysis
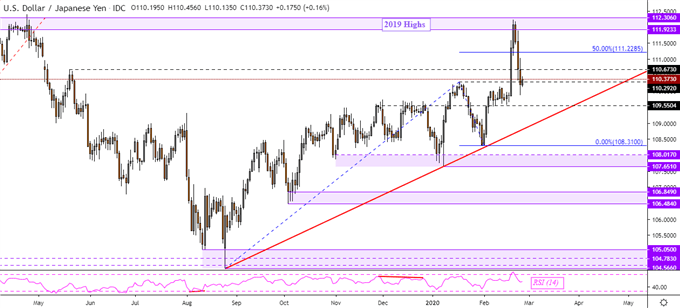
After failing to clear highs from 2019, USD/JPY has turned sharply lower towards rising support from August – red line on the chart below. Clearing 110.29 would pave the way for a revisit of 109.55 along the path towards the rising trend line. If the latter is taken out, that could shift the medium-term outlook to bearish as prices could reverse the key uptrend from the latter half of last year.


Recommended by Daniel Dubrovsky
Improve your trading with IG Client Sentiment Data
USD/JPY Daily Chart
USD/JPY Chart Created in Trading View
S&P 500 Sentiment Outlook
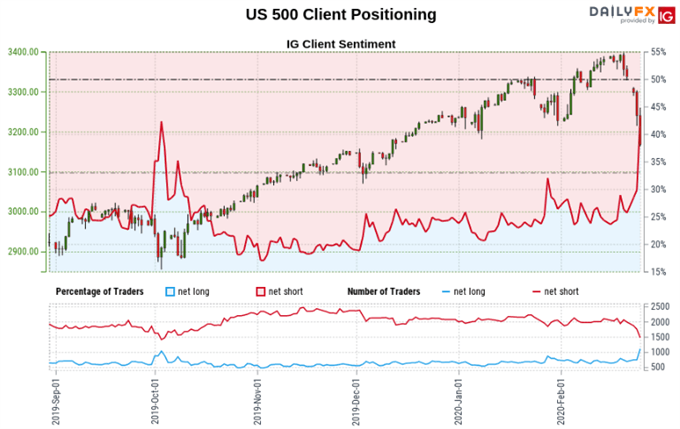
According to IGCS at the time of this writing, roughly 42.32% of traders are net-long the S&P 500. That is up from just under a 25% upside bias from last week. Since then, prices have declined over 7.6%. Recent changes in sentiment warn that the current US 500 price trend may soon reverse lower despite the fact that traders remain net-short. That would represent a rising share of participants attempting to pick the bottom.


Recommended by Daniel Dubrovsky
Top Trading Lessons
S&P 500 Technical Analysis
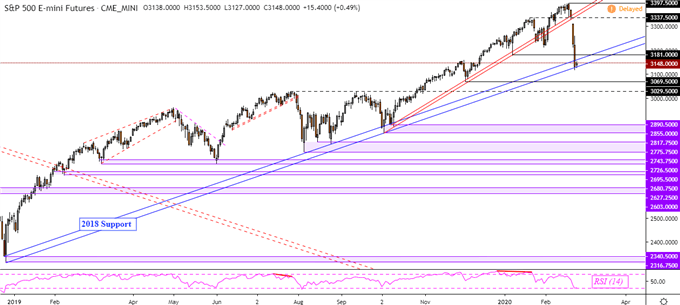
Despite near-term declines, the medium-term technical picture for the S&P 500 arguably remains bullish. Taking a look at futures, rising support from 2018 caught Tuesday’s aggressive selloff – blue lines on the chart below. A close to the downside followed by confirmation risks shifting the technical outlook to bearish from here. That may be the case if signals from trader positioning transpire.
S&P 500 Futures Daily Chart
S&P 500 Futures Chart Created in Trading View
*IG Client Sentiment Charts and Positioning Data Used from February 25 Report
— Written by Daniel Dubrovsky, Currency Analyst for DailyFX.com
To contact Daniel, use the comments section below or @ddubrovskyFX on Twitter


Be the first to comment