

Michael M. Santiago
The passive investing boom spawned myriads of exchange-traded funds, including those adopting hybrid active/passive and smart-beta strategies, each with its own unique alpha recipe mixing various factors to beat the market, i.e., capitalizing on growth with quality, value with quality, focusing on a specific financial parameter or a peculiar amalgamation of them, etc. That is to say, equity dislocations can be exploited in innumerable ways.
Alas, in most cases, as I discussed in a few notes on Seeking Alpha, their performance leaves a lot to be desired, with returns in-line with the S&P 500 (IVV) over most relevant timeframes, at best. At worst, most are chronic underperformers, with elevated fees being amongst potent detractors.
Today, I would like to lay out a few reasons why I am skeptical about longing the GraniteShares XOUT U.S. Large Cap ETF (NYSEARCA:XOUT), a comparatively nouveau investing vehicle, which builds its portfolio by crossing the worst half of the 500 U.S. large-cap equities-strong cohort off the list and then selecting the best 250. The worst constituents are identified using the XOUT score addressed below.
I highlight three major downsides of this ETF: exorbitant valuation (manifested in a solid premium to IVV), fees on the expensive side, and unconvincing performance. I acknowledge its comparatively better quality, but this is not enough for a bullish thesis. Performance since its inception is relatively soft despite its score-based stock selection strategy. Its inability to beat the plain-vanilla ETFs with just a few bps in expenses like IVV and the Nasdaq 100 cohort (QQQ) is a reason for concern. It is an open question whether its strategy was merely riding the market in 2020, enjoying the pandemic tailwinds, or it truly managed to benefit from exploiting equity dislocations. I am of the opinion that it was more of the former than the latter. I would welcome a healthy deal of criticism in the comments in case my dear readers do not share this opinion.
However, I acknowledge that XOUT might be a promising tactical allocation should embattled U.S. growth names march higher in the weeks ahead as the market has seemingly switched to the ‘bad news is good news’ mode, with the aggressive Fed interest rate increases seemingly digested and now perceived as a bullish factor (the soft landing case). Fears of an outright recession (and two consecutive quarters of GDP decline as harbingers) are being ignored, for now. Still, even in this case, I believe lower-cost blue-chip funds look like a permanently better alternative.
The investment strategy has limitations
I would call XOUT an anti-value, uncompromisingly quality-centered ETF.
The market-cap-weighted XOUT U.S. Large Cap Index lies at the crux of its investment strategy. At first glance, it is utterly simplistic. To unlock alpha, just remove the weakest half of the 500 largest U.S. companies group or those businesses that grow anemically, are incapable of delivering on profits, demonstrate poor capital deployment decisions, have soft hiring dynamics, do not reduce share count, or do it too slowly, with management that has questionable performance, etc. To assess that, the XOUT score is used. Companies with the weakest scores are crossed off the list.
The 500 companies-strong selection pool is not to be confused with the S&P 500. Please take notice that XOUT could hold stocks that are not in this index; Lululemon Athletica (LULU), Palantir (PLTR), and Uber Technologies (UBER) are just a few examples from the current version of the portfolio.
Being grossly overweight in IT (36.3%), XOUT almost entirely ignores capital-intensive fossil-fuel companies (a poor decision for inflation-torn 2022) as I found just three stocks from the energy sector in its portfolio, Cheniere Energy (LNG), Pioneer Natural Resources (PXD), and APA (APA). Supermajors are obviously absent. The fund is also skeptical about the materials sector, with a measly 0.7% allocated.
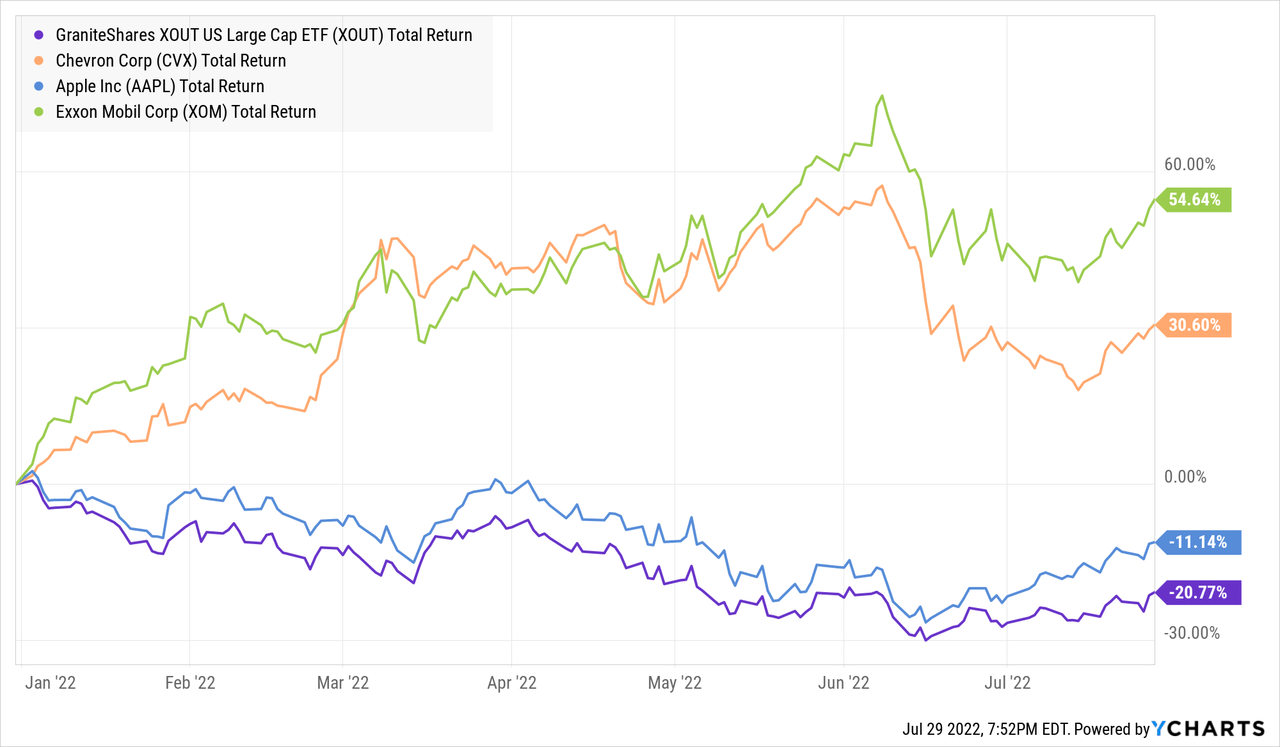
To rewind, in 2020, bears were not short of reasons to label Exxon Mobil (XOM) an old-economy laggard. The same is fair for Chevron (CVX) and other peers. Cratering oil prices amid the coronavirus recession and the risk of petroleum entering the accelerated demand decline phase due to investment dollars decidedly flowing to renewables, with the EV revolution in the mix, were solid reasons to steer clear of the stock (I did not, anyway). However, in 2022, their bets were ruthlessly pulverized. The takeaway? The methodology of identifying and removing the weakest companies is far from perfect. Hence, it is questionable whether it could systematically beat the bellwether indices over longer periods, at all.
Speaking about returns, XOUT’s performance in 2022 has been dismal.
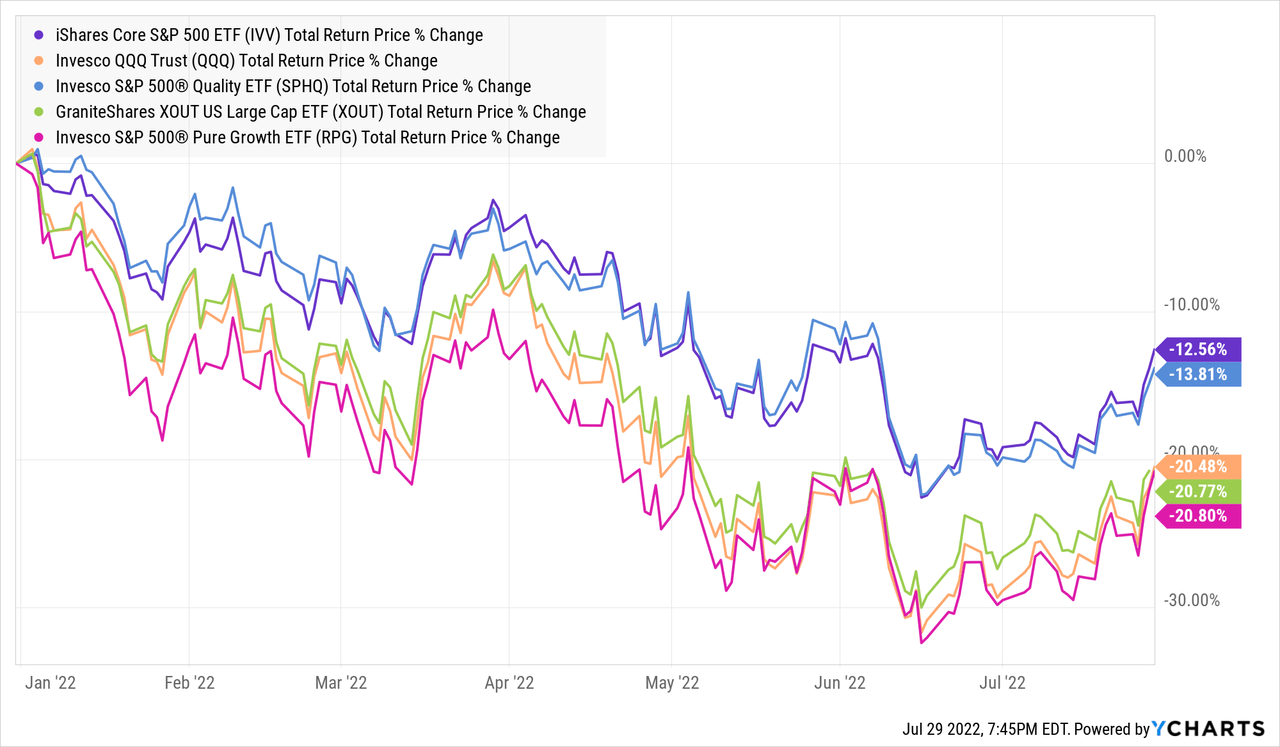
Measly exposure to oil stocks and the value factor is to blame. Put shortly, ‘the worst’ were outperforming ‘the best.’
But it has not always been that bad. Launched in October 2019, it beat IVV in 2020, delivering ~28.7% total return, also dwarfing its peers the Invesco S&P 500 Quality ETF (SPHQ) and Invesco S&P 500 Pure Growth ETF (RPG). However, QQQ’s 2020 total return of 48.4% was still unrivaled.
After stellar 2020, 2021 turned out to be much more challenging for XOUT as it underperformed all these ETFs marginally. Overall, over the November 2019 – June 2022 period, XOUT delivered a 9.3% CAGR vs. IVV’s 10.4% and the Sortino ratio of 0.77 vs. IVV’s 0.88. And obviously, the hefty expense ratio is the key detractor. This period is short, no doubt, but still indicative that XOUT is incapable of consistently beating the blue-chip ETF, even despite that the latter holds ‘laggards.’
Next, above I said that XOUT is a fund betting on quality regardless of the price. I think the best way to prove that is to compare it to IVV using the Seeking Alpha Quant rating system, as usual. What arrested my attention immediately is how expensive XOUT’s 250-equities-strong portfolio is. Stocks with a D+ Valuation grade and worse have ~74.7% weight in it vs. 65.8% in IVV. Meanwhile, XOUT can justly be proud of its successful attempt to improve the quality of the portfolio. I noticed that 92.8% of its holdings have A (+/-) Profitability grades, while this figure is ~87% for IVV. A remarkable achievement. Does that justify a 60 bps expense ratio? Investors should answer by themselves.
Final thoughts
The idea to remove upper-echelon stocks with lackluster growth and quality characteristics is promising, no doubt. To forget about suffering long-term capital declines due to eroding business models, just ignore the weakest and proceed with the best.
In practice, the situation is a bit more nuanced, and the ETF is yet to prove its ability to consistently produce better returns than IVV. Even though there were a few clearly bright spots in the past, amid the new zeitgeist, that would be a task nothing short of challenging.
This year has bitterly illustrated how avoiding businesses that are seemingly poised for a permanent decline could easily result in painful losses when the market switches direction. After being hit by two oil price crises in the 2010s, with the latter perceived by some investors as the beginning of an end for oil & gas stocks, XOM and CVX and their old-economy peers have been defying the 2022 bear market, literally printing cash capitalizing on the energy crisis. And while their performance has somewhat shored up struggling IVV, XOUT has obviously failed to benefit.
So it is not that easy to separate the wheat from the chaff, the laggards from future outperformers, using even carefully calibrated scores. Markets have a well-documented history of delivering surprises.
XOUT is more expensive than IVV (both in terms of fees and in terms of equities’ valuation) and only marginally better in quality. I have always criticized high-fee ETFs with sophisticated strategies that end up being grossly overweight Apple (AAPL) and Microsoft (MSFT), with the recent article on the Motley Fool 100 Index ETF (TMFC) reiterating this point. That is to say, I have no strong bullish thesis for XOUT either.
Summing up, I am of the opinion that investors who are courageous enough to crank up bets on the U.S. tech league after yet another 75 bps interest rate hike now would be better off going long a less sophisticated ETF like QQQ or IVV, which are inherently overweight in the priciest domestic companies. XOUT is only a Hold.
Be the first to comment