

Schroptschop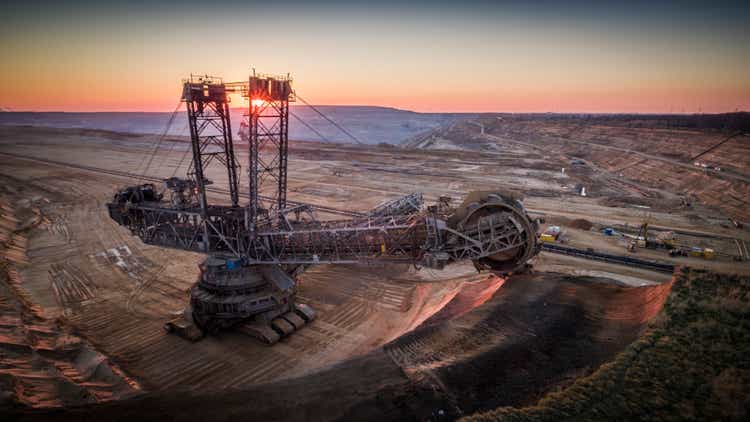
Metals and mining stocks were a hot trade to launch 2022. The narrative went that high inflation was here to stay. Commodities soared as a result of Russia’s invasion of Ukraine, too. Safe haven assets like gold rose in value while industrial commodities also attracted speculative buyers. All of that was bullish for so many Materials and Energy stocks through parts of the first handful of months this year. The story changed, though. Mid-year, fears of a global recession became front and center. Hence, resource stocks suffered. Major industrial & precious metals, energy commodities, and other niche natural resource assets saw their prices drop big. One ETF has felt all those swings.
YTD ETF Performance Heat Map: XME Up In A Sea Of Red
Finviz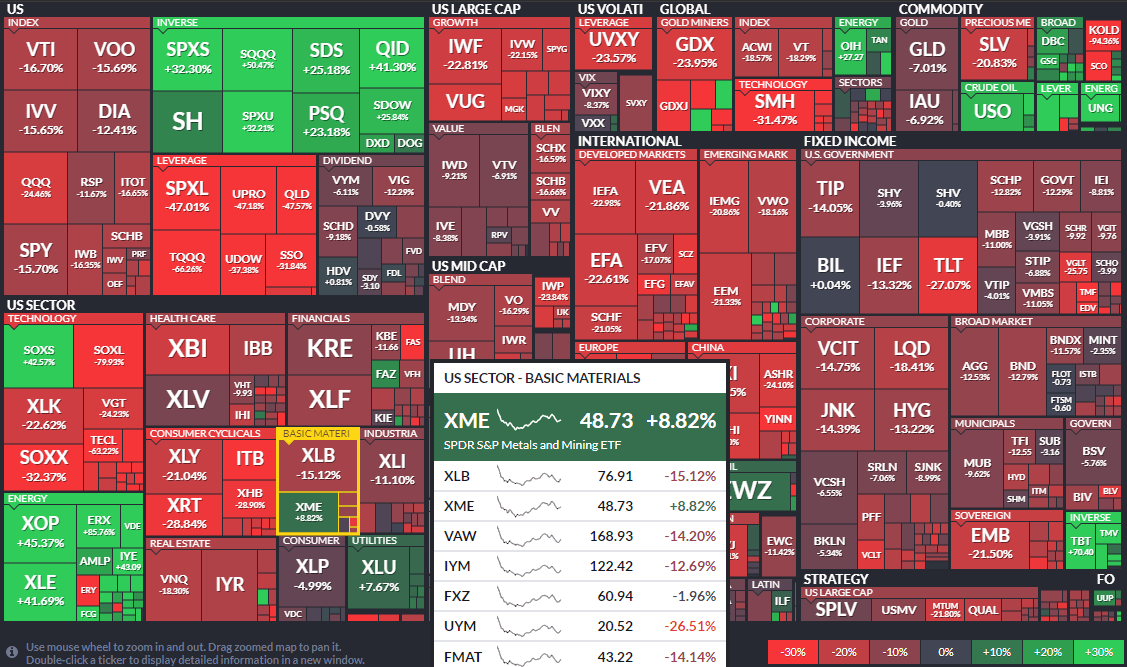
The SPDR S&P Metals and Mining ETF (NYSEARCA:XME) offers exposure to the metals & mining segment of the S&P TMI, which comprises the following subindustries: Aluminum, Coal & Consumable Fuels, Copper, Diversified Metals & Mining, Gold, Precious Metals & Minerals, Silver, and Steel. XME has a modified equal-weighted construct which provides the potential for industry exposure across large-, mid-, and small-cap stocks. The ETF yields 0.7% and has a 0.35% annual expense ratio, according to SSGA Funds.
With nearly $2 billion in net assets and a tight median bid/ask spread intraday, XME is a highly liquid fund that investors use to play often volatile swings in relatively small Energy and Materials sector stocks. XME has a long track record with an inception date back in 2006.
While it takes a modified equal weight approach, the ETF holds just 34 positions, so it’s somewhat concentrated. Sector-wise, it is 80% Materials and 20% Energy. Those two sectors make up less than 10% of the broad stock market, so high exposure to XME is often an active bet that resource-sensitive areas will outperform.
XME Fund Details: A U.S. Small Cap Resources ETF Focused in Energy & Materials
Fidelity Investments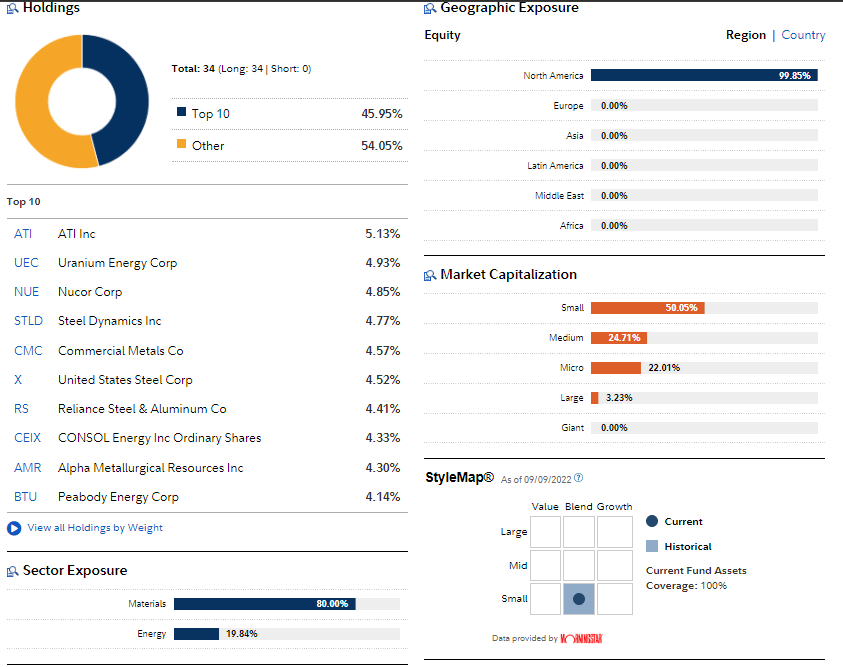
On valuation, XME trades at just 5.7 times earnings, according to Morningstar data. With solid earnings growth, the fund looks cheap, but the factor profile illustrates that XME is not for the faint of heart. The fund features high realized volatility.
XME Is A Highly-Volatile, Low-Valued ETF
Morningstar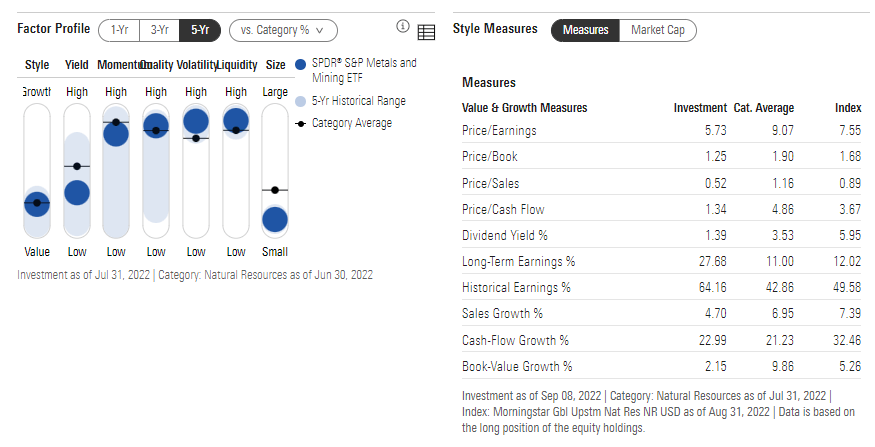
Top Holdings: A Modified Equal-Weight Approach (34 Positions).
Morningstar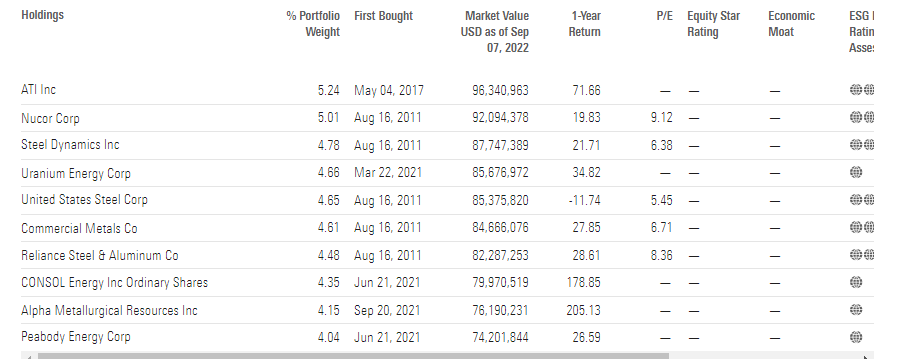
Risks
Holders of XME certainly feel some of the major risks over the last five months. A rising U.S. dollar is often bad for resource stocks, though the first quarter of 2022 featured both a rising greenback and strong commodity prices, which boosted Materials and Energy stocks.
A cyclical downturn in the global economy can also negatively affect XME as companies the fund holds are often highly dependent on economic strength or recovery to perform well.
Investors must also be aware of market cap risk with XME. The ETF has a very low median market cap in terms of the stocks it owns, so when small caps are out of favor versus large caps, XME might underperform.
The Technical Take
XME just about doubled from early 2021 to its peak this past April. The $38 to $40 area is a key spot that investors should monitor. So long as the ETF is above that range, then a bullish position is warranted. A bearish breakdown below $38 could send shares back down to the 2019 trading range of $24 to $30 in short order.
I would like to see XME climb above $54, the August high, to help confirm that this major correction off the April peak is wrapping up. The stock fell a whopping 40% over just a handful of months as the narrative quickly turned from runaway inflation to a global cyclical economic downturn.
XME: Watch $38 to $40 For Support
Stockcharts.com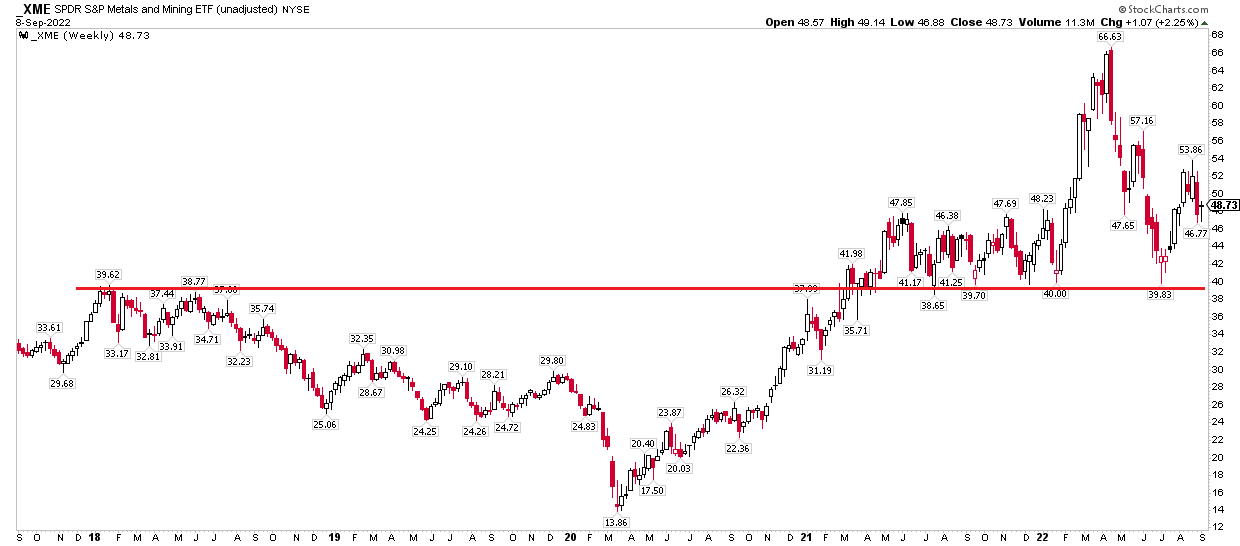
On a relative basis, XME has actually been outperforming for the last two months. That’s an encouraging sign for XME bulls. I’d like to see momentum burst above that recent late-August high, though.
XME vs SPY: Relative Strength Since Early July
Stockcharts.com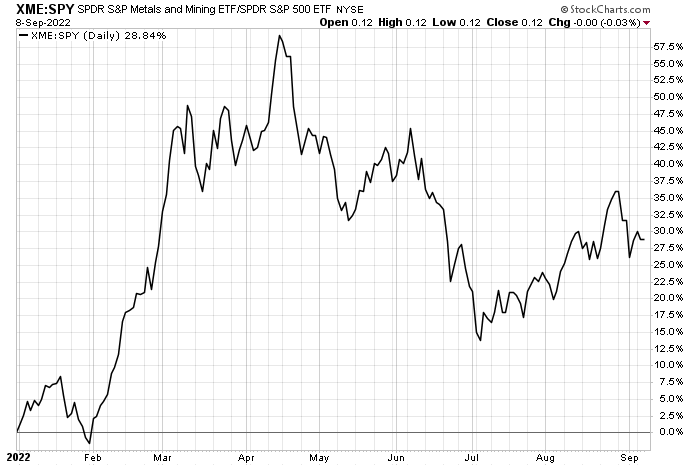
The Bottom Line
I think being long XME right now still makes sense despite the dismal macro outlook so many pundits have. XME is above a key price on the chart and shows relative strength since early July. Moreover, the fund is cheap on a P/E basis, but volatility remains high.
Be the first to comment