

Elijah-Lovkoff/iStock via Getty Images
The fund profile as well as fund details and performance were downloaded from seekingalpha.com here.
As of 3 February 2023, the Real Estate Select Sector SPDR Fund (NYSEARCA:XLRE) has net assets of 5.40B and pays 3.33% dividend yield. The YTD total return is 10.91%, with an expense ratio of 0.12%.
XLRE is a concentrated fund that invests in only 33 large cap REITs. Its top 10 holdings make up 61.42% of the total portfolio.
Top 10 Holdings
Prologis Inc 12.61%
American Tower Corp 10.76%
Equinix Inc 7.08%
Crown Castle Inc 6.71%
Public Storage 5.00%
Simon Property Group Inc 4.38%
Realty Income Corp 4.32%
Welltower Inc 3.66%
Digital Realty Trust Inc 3.50%
VICI Properties Inc 3.38%
Total 61.42%
# of Holdings 33
*Holdings as of 2023-02-02
Source: Seeking Alpha
All these companies are leaders in their areas and have great prospects of growth.
The table below contains data about the four largest REIT ETFs. XLRE has the second lowest Assets Under Management (AUM) just over 5B, with VNQ being the largest with over 37B. The “Total Return” column shows the funds’ total return since 10/7/2015, the date when XLRE was created. XLRE has, by far, been the best performer of the group.
|
Fund |
ASSETS |
Total Return |
Dividend Yield |
Expense Ratio |
|
XLRE |
5.40B |
75.93% |
3.33% |
0.10% |
|
VNQ |
37.07B |
55.62% |
3.51% |
0.12% |
|
IYR |
3.88B |
59.48% |
2.63% |
0.39% |
|
SCHH |
6.17B |
33.08% |
2.30% |
0.07% |
For more insight into their relative performance, please see the chart showing the evolution of the equity of these REIT ETFs.
stockcharts.com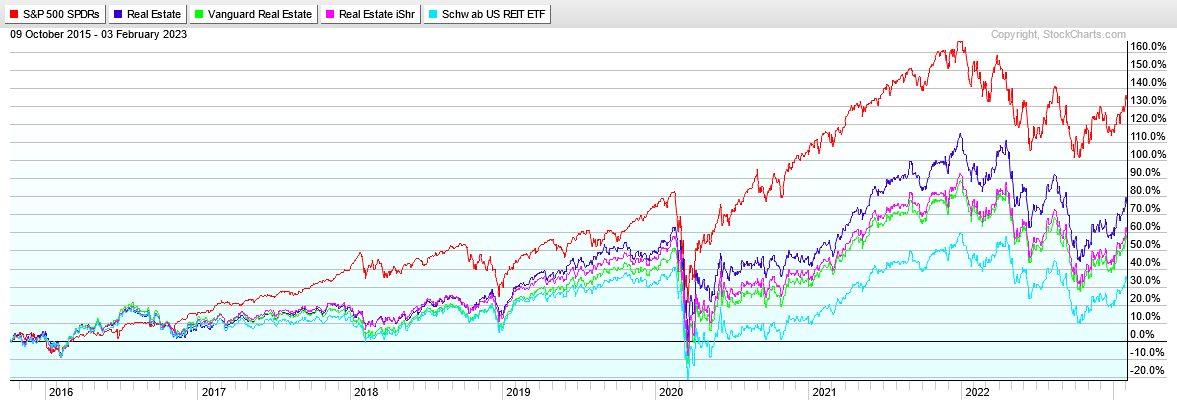
It is clear that the real estate sector has significantly lagged the broad market represented by SPY. But this impression is misleading; there were periods when real estate outperformed. Of utmost importance is the relative performance in the most recent period. Real Estate has outperformed the broad market lately, as seen in the following chart.
In the chart below we see that XLRE handily beat SPY since the market bottom on October 24, 2022. We expect that this outperformance will continue.
stockcharts.com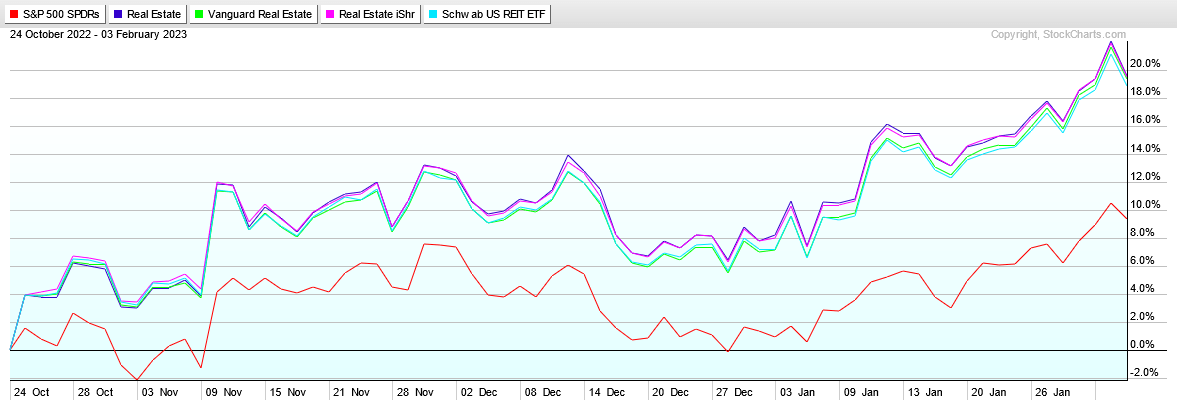
Of course, there were many periods when real estate lagged badly. As an example, the chart below shows a five-month period in 2016 when real estate did substantially worse.
stockcharts.com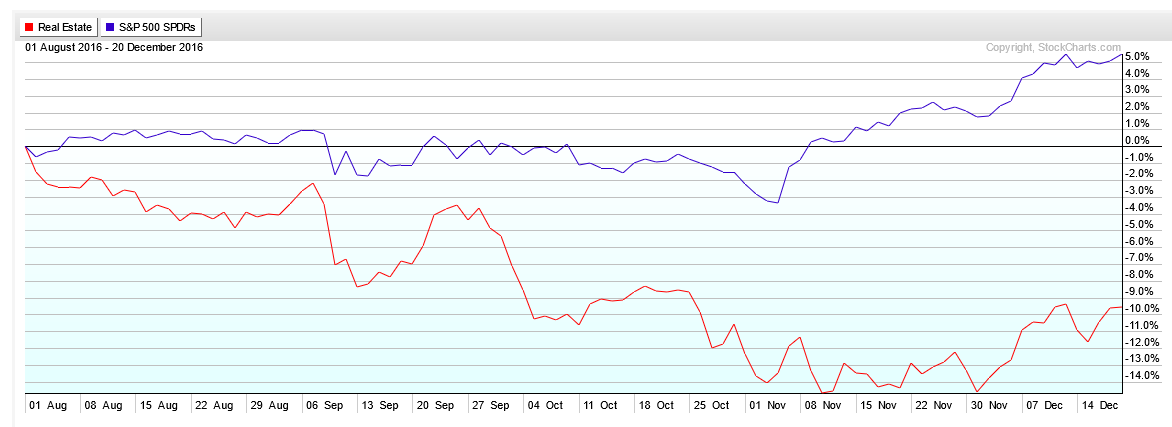
As a buy-and-hold investment, XLRE has the best performance among the real estate ETFs. Since its inception on 7 October 2015 it has returned 75.93%. During the same period SPY returned 133.68%.
In the bar chart below we see that XLRE as a buy-and-hold investment had three years with negative returns: 2018, 2020 and 2022. In 2022, it returned -26.25%, significantly worse than SPY at -18.17%.
PortfolioVisualizer.com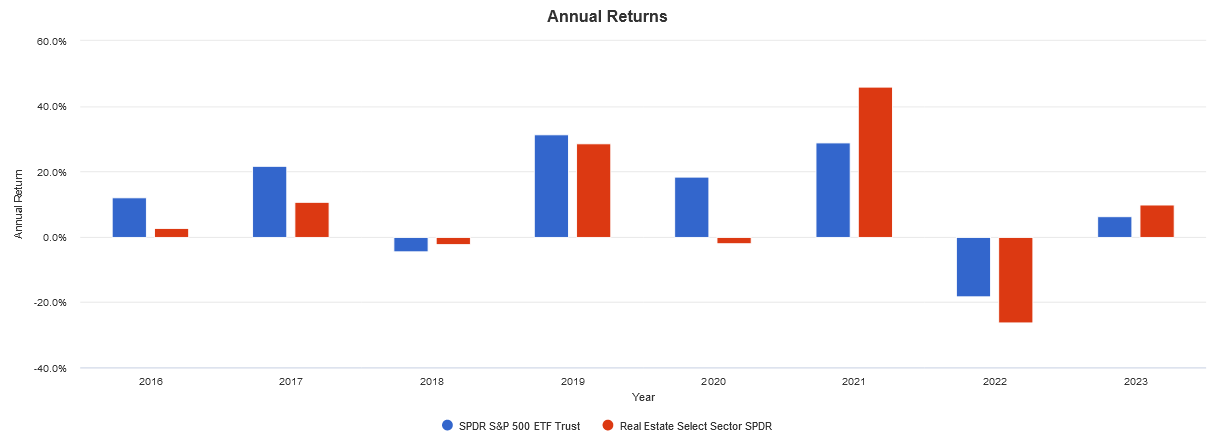
Technical Analysis
Here is a chart of XLRE where we see that the 50-day and 200-day moving averages are converging to form a “golden cross”.
stockchart.com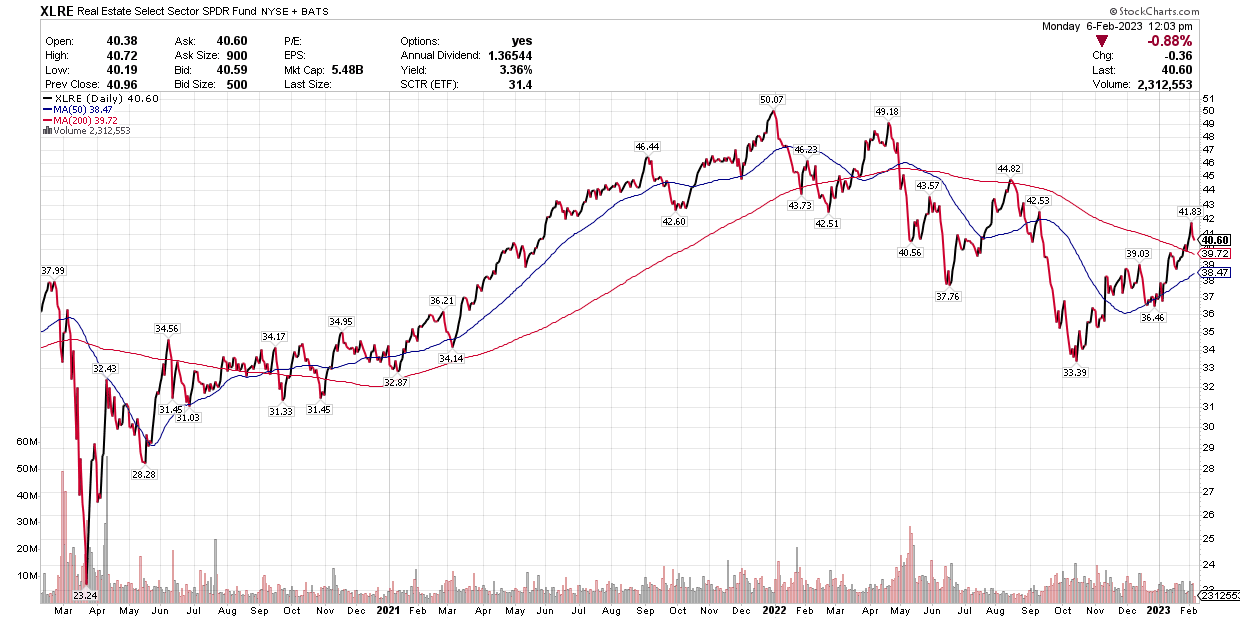
Conclusion
XLRE has done better than the broad market since the market’s bottom in October 2022. The price action shows higher lows and higher highs not common with bear market rallies. This recovery looks real and is likely to indicate the start of a new bull market. The US economy has shown good resilience to FED rising interest rates and a disinflationary process is underway.
I rate XLRE a Buy.
Be the first to comment