

vchal/iStock via Getty Images
Previously we promised to “share extracts from our weekly reviews.” This article is part of that effort, and some of it is taken from analysis originally published for Macro Trading Factory’s subscribers on Nov. 21.
——————————————————————————-
From Bad to Worse
The housing market is already feeling the pain, with property prices dropping across many cities.
Bloomberg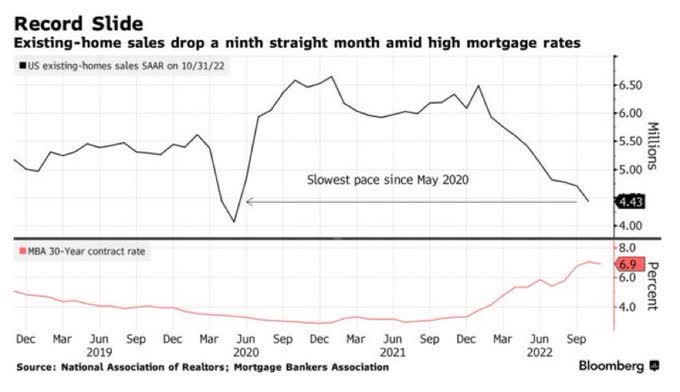
And that’s before a big spike in supply (of new apartments) is hitting the market over the next two years.
Realpage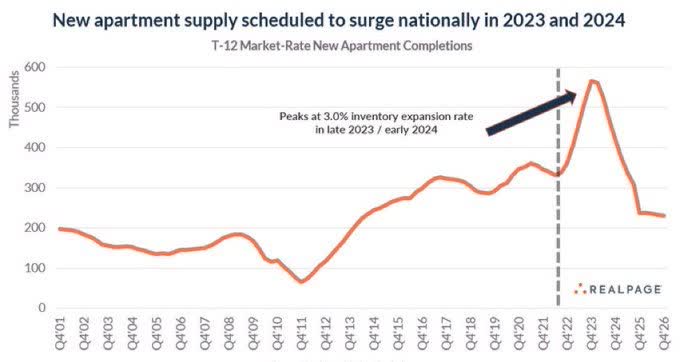
National Home Price Index fell 0.76% M/M in September (following a decline of 0.91% in August).
20-City Home Price Index fell 1.24% M/M in September (following a decline of 1.3% in August).
Bloomberg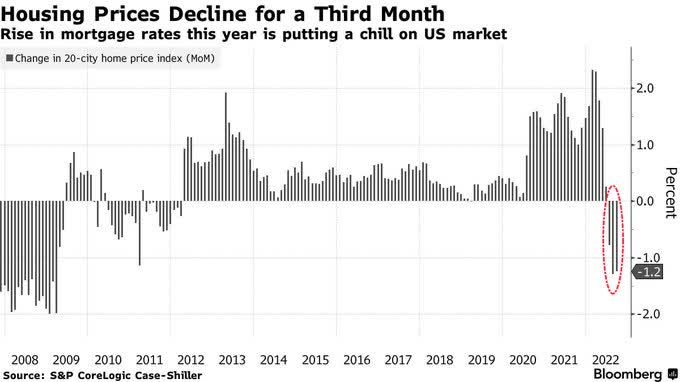
S&P CoreLogic CS 20-City Home Price Index’s 3-month rate change is now the lowest (most negative) it has been since early 2009.
Bloomberg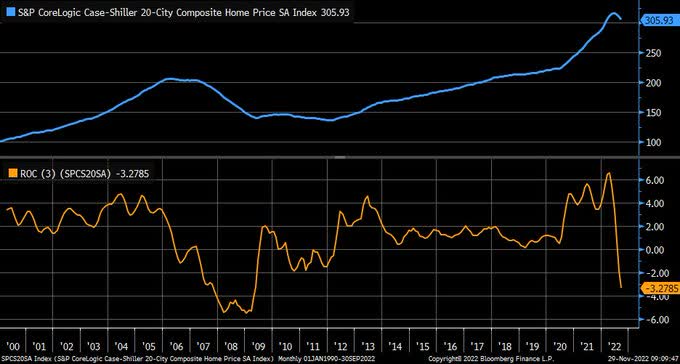
Unsurprisingly, we see a significant easing in the apartment market’s tightness, a sharp reversal from the extreme conditions witnessed only a year ago.
Bloomberg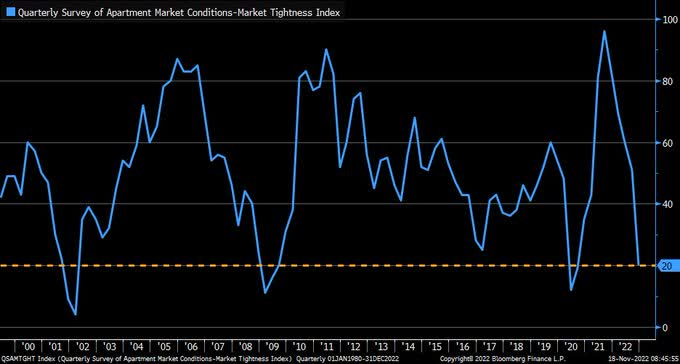
It’s a Buyers/Renters Market
Per Apartment List, the National Rent Index fell by 1% M/M in November – the third consecutive decline, and the second straight month for the index to set a new “largest monthly decline” record. [Data goes back to January 2017.]
Apartment List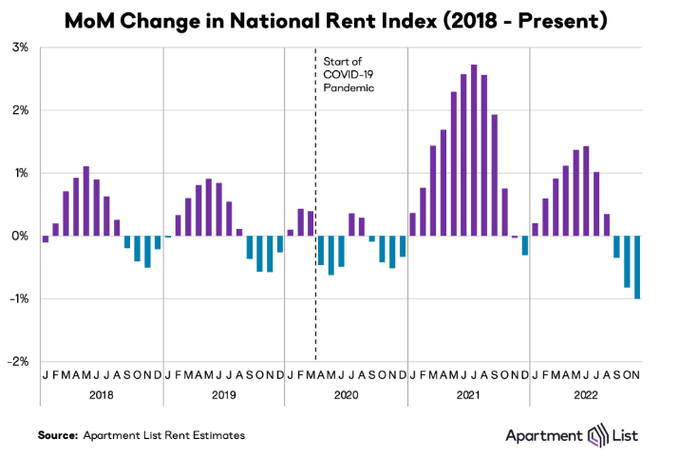
Meanwhile, the National Vacancy Index continues its climb, reaching 5.7%.
The index is up 0.6% over the past three months (August-November), and 1.6% since hitting a bottom at 4.1% eleven months ago (October 2021).
Apartment List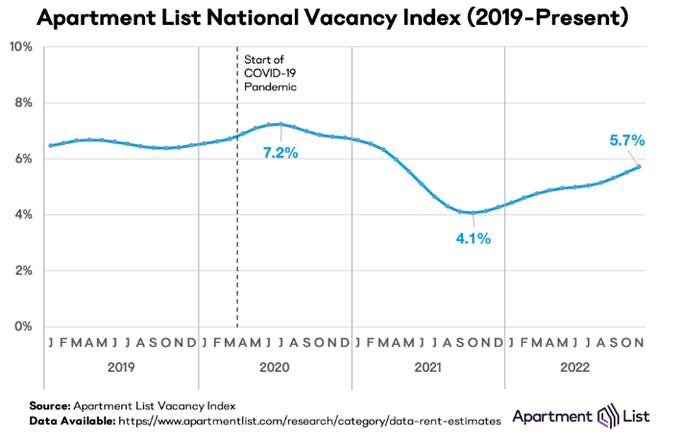
Data regarding market rents (gathered from Apartment List and Zillow) suggest that CPI Shelter Y/Y growth is likely peaking as we speak, en route to a quick adjustment down.
Christophe Barraud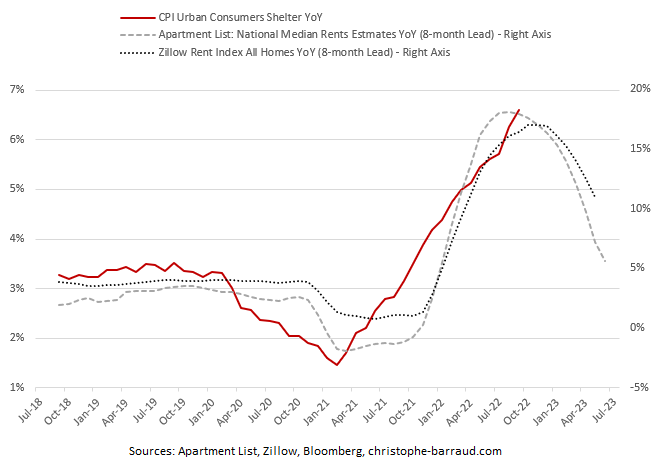
With plenty of new apartments coming to the market in 2023 and 2024, we’re likely to see rents begin to fall for multi-family dwellings.
Furthermore, with such a dramatic rise in funding costs, it’s likely that this construction slows considerably in the years ahead.
Here’s Morgan Stanley forecast for home prices:
Morgan Stanley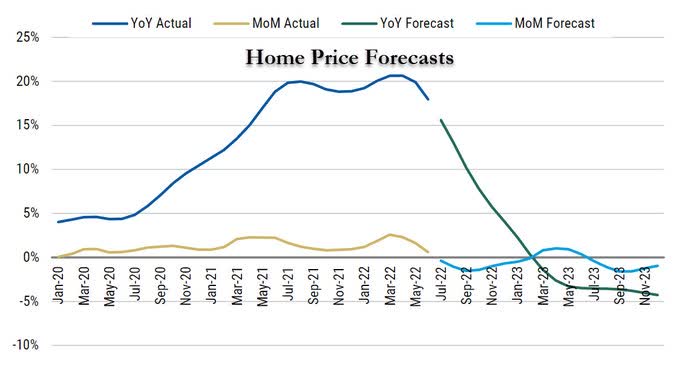
Higher Rates Get the (“Killing”) Job Done
We’re dealing with a very hawkish Fed, determined to “kill” inflation by hiking rates at the most aggressive pace ever.
MishTalk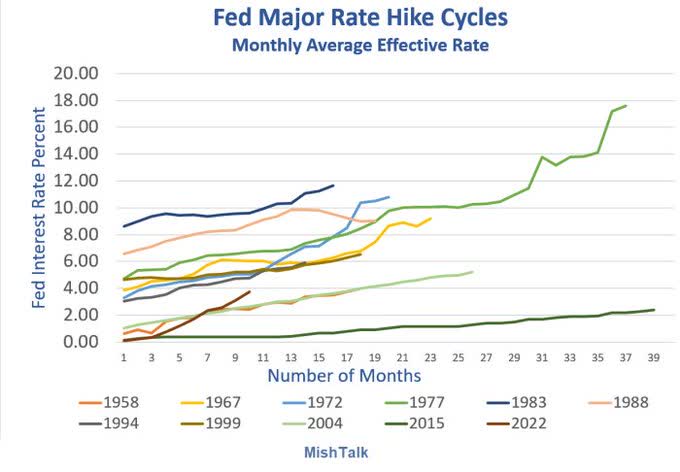
No matter how you turn this round, that bodes very badly for the housing market.
Apollo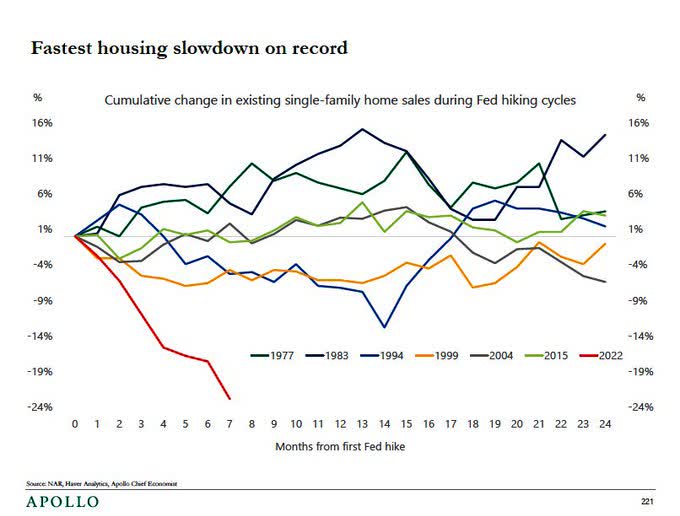
“The epic surge in mortgage rates has led to a collapse in NAHB home builders’ sentiment… Since the Fed began raising rates in March-2022, NAHB is down a stunning 46 points. This is the largest eight-month decline in the history of the data.”
Joseph A. LaVorgna, Former Chief Economist of The White House National Economic Council under President Trump.
Haver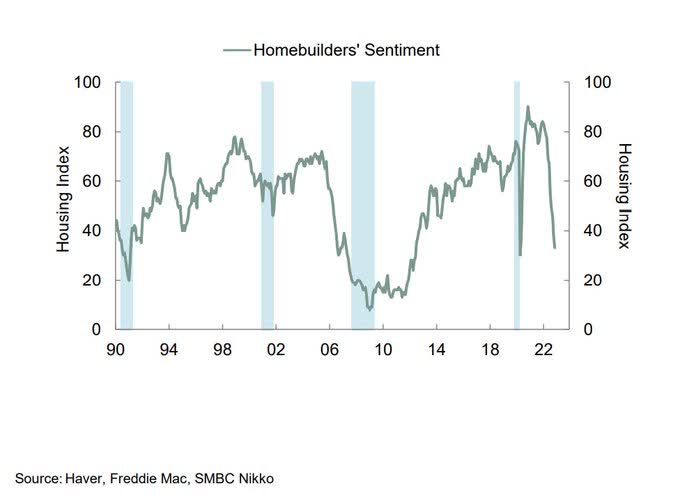
Rising mortgage rates make it way more costly (or less economic, if you’d like) to buy/own a property.
Last quarter saw the smallest percentage of refinancing (<4%) out of all U.S. mortgage originations since at least 1991.
Bloomberg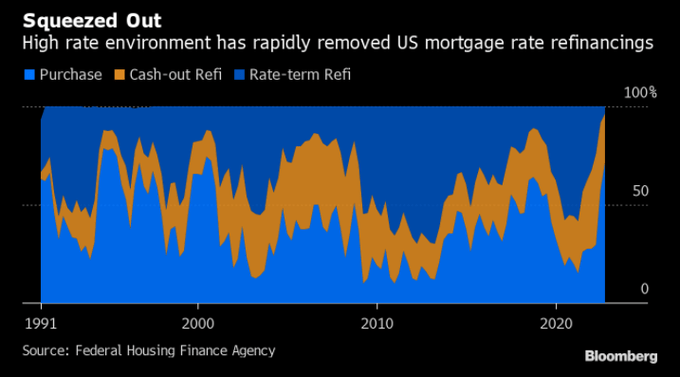
2022 is a “Year to Forget” for the Real Estate Sector
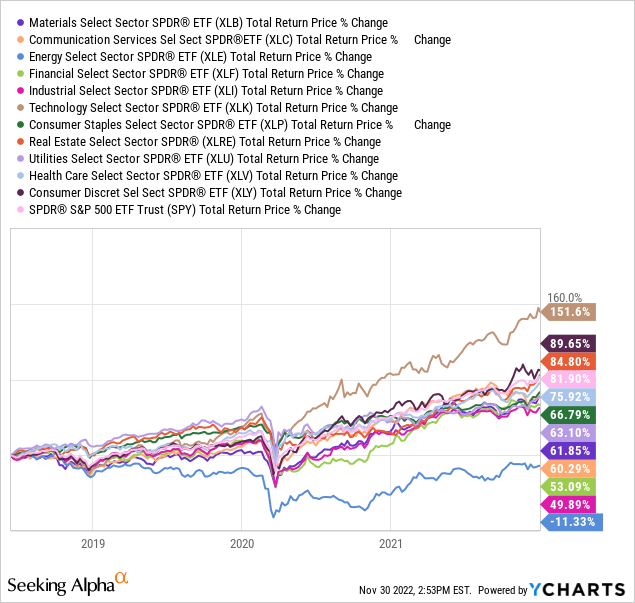
Real Estate is one of the worst-performing sectors in the S&P 500 (so far) this year.
The sector’s 26% decline YTD is in line with that of the Technology sector, and these are two sectors that are drawing completely different types of investors.
Charles Schwab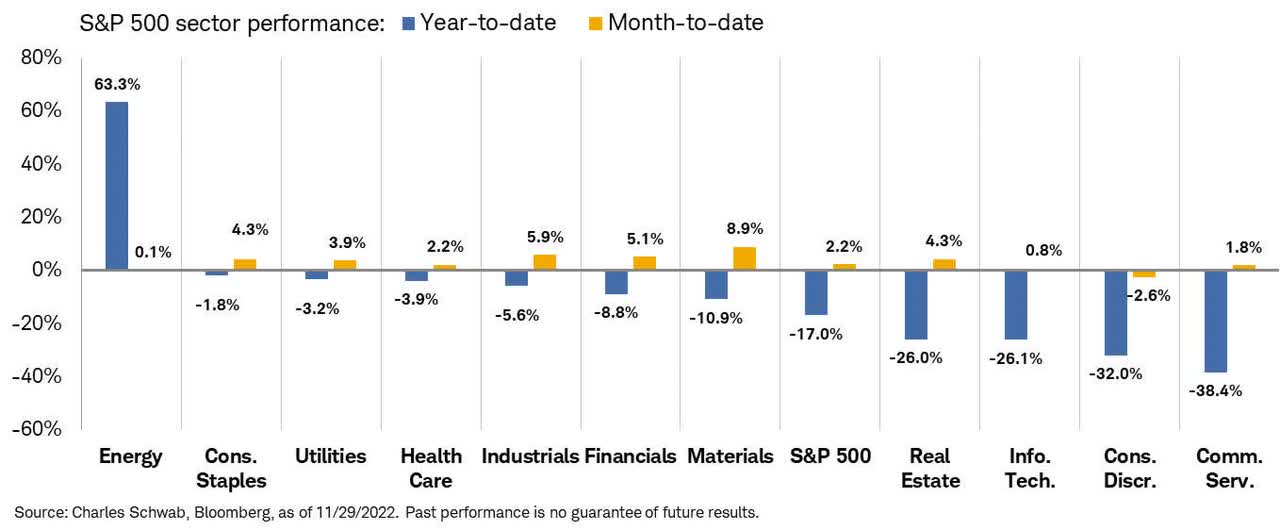
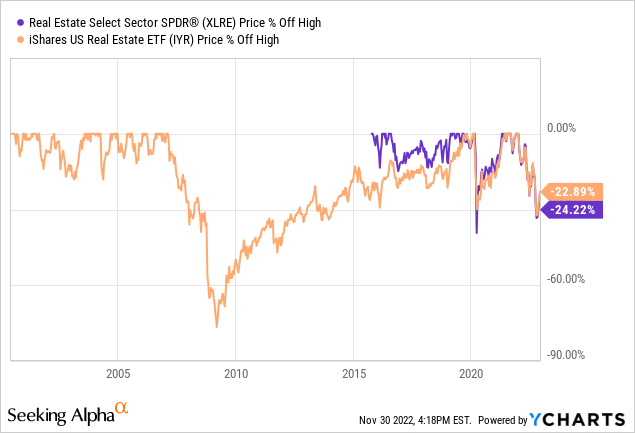
Not a single Real Estate ETF has managed to escape the 2022 carnage, and the difference between the best to the worst is only ~2%, suggesting that one voice (and perhaps a “herd mentality”) is leading this sector.
On one hand, as someone who is a great believer in “Macro Trumps Micro,” I can’t say I’m surprised. On the other hand, the lack of diversification here is quite extraordinary, even for an “all or one and one for all” type of sector.
Y-Charts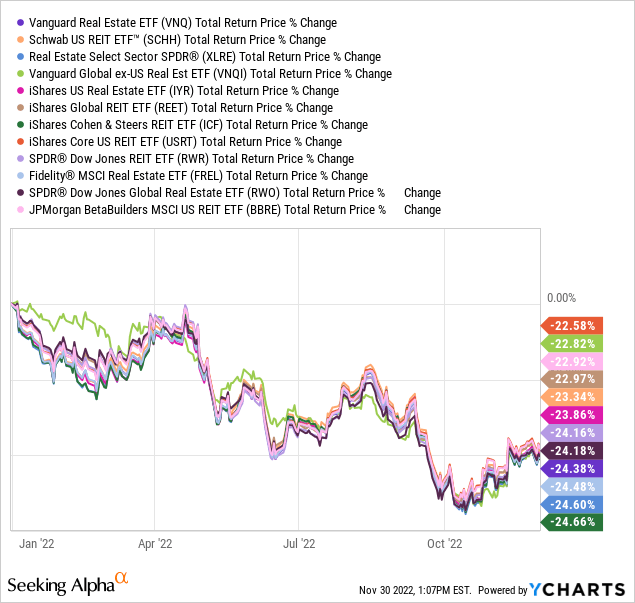
Real Estate has been one of the main beneficiaries of the Fed’s easing monetary policy prior to 2022.
As the markets started climbing off the March 2020 lows, Real Estate was one of the best performing sectors.
March 23, 2020 – December 31, 2021:
Y-Charts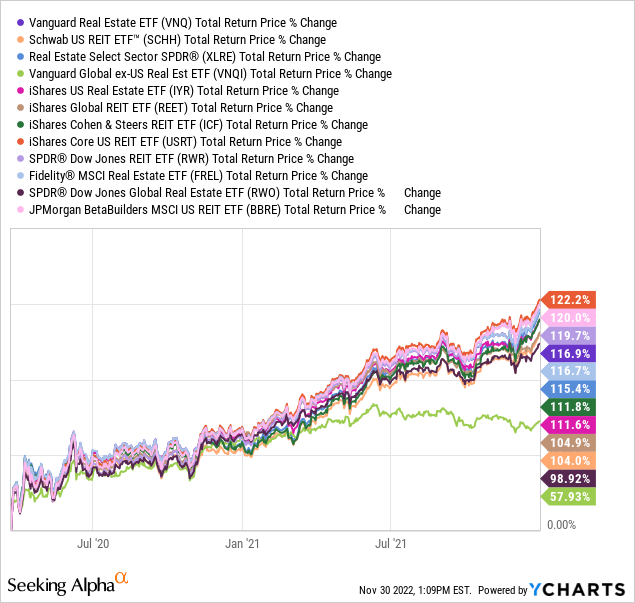
As a matter of fact, if we look at the 3.5 years before 2021*, Real Estate was the third-best performing sector, only second to the obvious two most aggressive, growth oriented, sectors: Technology and Consumer Discretionary.
*Since XLC’s inception date (June 18, 2018.)
But that tremendous run came to an end as soon as the Fed mindset switched from easing to tightening.
Real Estate is one of the sectors that are most sensitive to changes in rates, and analysts at Charles Schwab ranked Real Estate as the sector that historically has performed the worst vis-à-vis the broader market in the year following the first in a new cycle of rate hikes.
Charles Schwab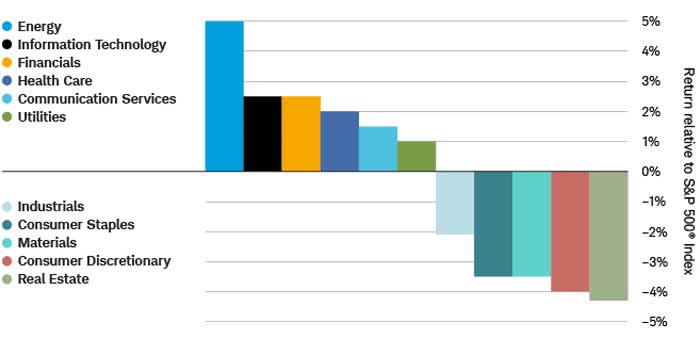
XLRE vs IYR
Two of the leading, most diversified, ETFs within the Real Estate sector are Real Estate Select Sector SPDR (NYSEARCA:XLRE) and iShares US Real Estate ETF (NYSEARCA:IYR).
They’re quite similar not only in nature, but also in terms of their main characteristics:
- Performance (total return; since XLRE inception date = Oct. 7, 2015).
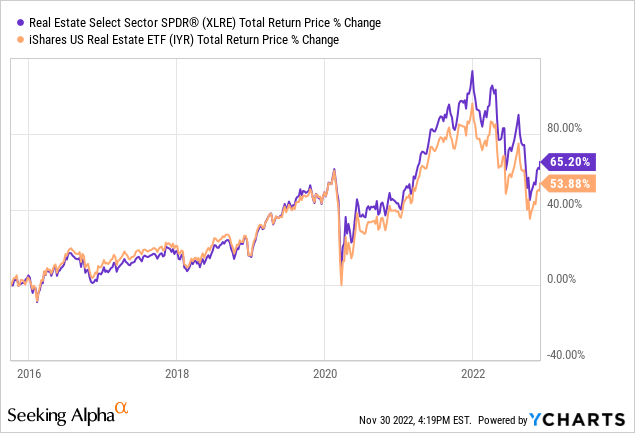
Y-Charts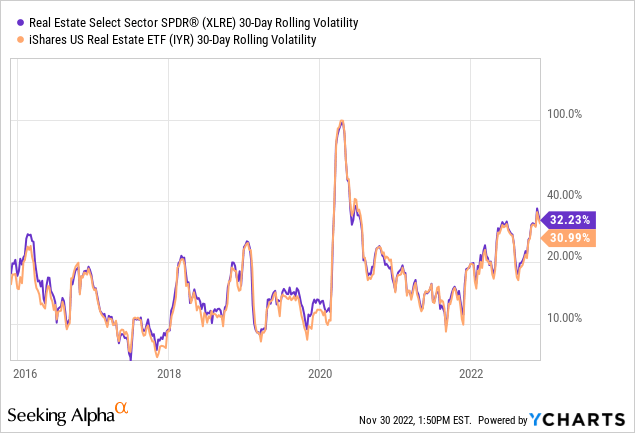
- Dividend yield (even if XLRE has a lead, it’s as big as the chart suggests).
Y-Charts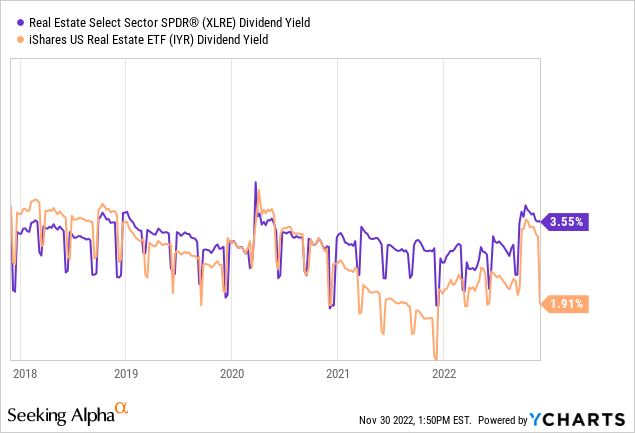
Even from a technical analysis they deliver similar signals; similar, but not identical.
If we ignore the COVID temporary effect, XLRE is still trading above the long-term uptrend line.
It also managed to cross the 50-DMA recently (currently trading +5.5% above it), and the 200-DMA is only ~9.8% above the current price.
If XLRE can hold onto (or regain) these attributes over the coming months, when the vast majority of the tightening cycle will be behind us, this would be a bullish sign calling investors to move back into this beaten-up ETF.
Y-Charts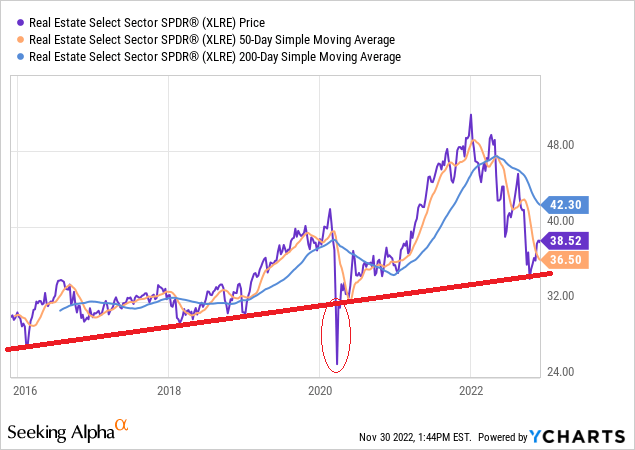
When it comes to IYR, we need to ignore not only the COVID effect, but also the recent dive below (what used to be) the long-term uptrend line.
Just like XLRE, IYR also managed to move (~4.9%) above the 50-DMA recently, and the 200-DMA is only ~9.3% above the current price.
Y-Charts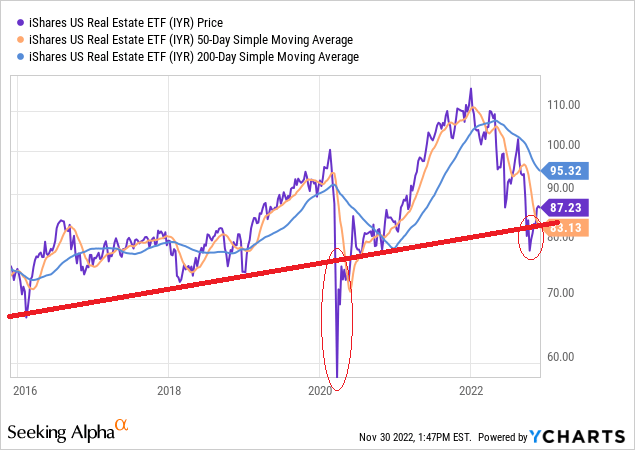
It’s a very similar picture, but XLRE is sending more positive vibes right now, and if we’re to choose between the two – we would start with it.
Bottom Line
Frankly, it’s impossible to be bullish on Real Estate right now, when most everything is causing severe headwinds, and no forecast for the “tightening storm” to weaken until spring is here, at the very minimum.
The housing market hasn’t experienced such a degree and scale of falling prices since the GFC, and this suggests that more pain is certainly in the Real Estate cards.
Eurodollar University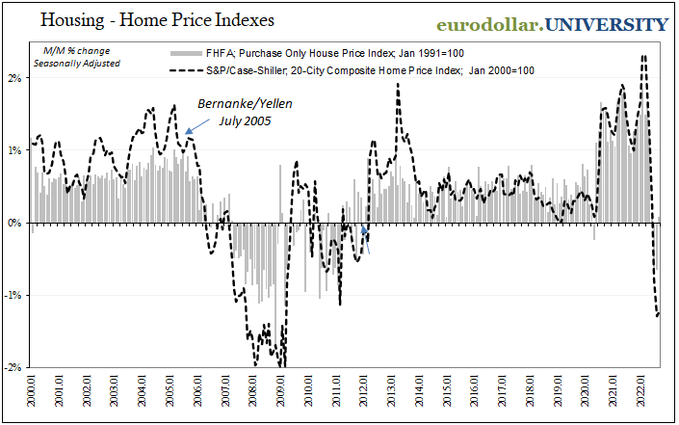
Back in March 2009, IYR’s maximum drawdown was ~77%, more than twice the size of the most recent drawdown of “only” ~34%. [Note that XLRE wasn’t yet “born” back then]
If the housing market now is almost as bad as it was back in 2008/9, why would Real Estate stocks trade at only about 40% of the pain (magnitude)!?
Pending home sales are already in recession, posting the fifth straight monthly decline (October saw a M/M decline of 4.6%), with sales now nearly as low as the extremely weak COVID level.
[Recall that back then – there were lockdowns; now, there aren’t.]
Bloomberg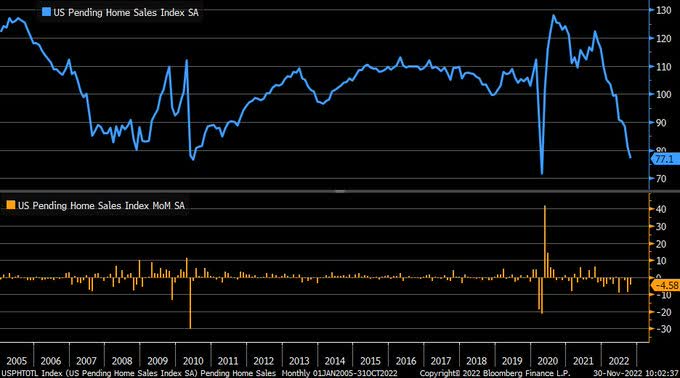
S&P CoreLogic Case-Shiller National Home Price index rose 10.65% Y/Y in September* – down from an Y/Y increase of 12.9% in the previous month, and the smallest Y/Y increase since December 2020.
*Note that “September” is a 3-month average of July, August and September closing prices.
Calculated Risk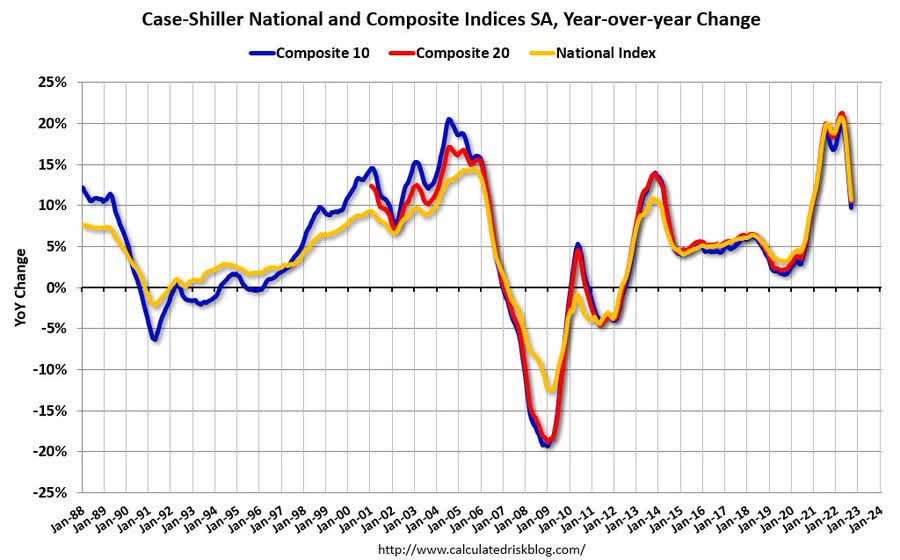
This is no time to “build” a new position in the sector, and investors are likely to get a better entry point down the road. If not on an absolute basis, then surely on a relative risk basis.
Be the first to comment