

JHVEPhoto
Toronto-Dominion Vs. Bank of Montreal
Earnings season for the Canadian banking sector continued as Toronto-Dominion Bank (NYSE:TD)(TSX:TD:CA) and Bank of Montreal (NYSE:BMO, TSX:BMO:CA) reported their fourth quarter financial results today.
TD topped consensus analysts’ forecasts for both revenues and earnings. The bank reported adjusted revenue of C$12.25 billion (~$9.1 billion) for Q4 2022, which smashed past the C$11.3 billion (~$8.4 billion) figure expected by analysts. Meanwhile, adjusted earnings per share was C$2.18 (~$1.62), against the consensus forecast of C$2.04 (~$1.52).
Meanwhile, BMO delivered a slight miss on the consensus EPS forecast. Adjusted earnings per share was C$3.04 (~$2.26) – just under analysts’ expectation for C$3.05 (~$2.27). Adjusted net revenue was C$6.54 billion (~$4.97 billion), against the consensus forecast of C$6.92 billion (~$5.15 billion).
Volatile Markets
The big difference between their respective Q4 performances was due to the impact that volatile markets had on capital markets revenue. And a dearth of deals compared to last year meant a slump in advisory and trading revenues could not have been avoided. As expected, BMO, with its bigger investment banking presence, was harder hit. Moreover, as TD is more focused towards net interest income in wholesale banking, it was better cushioned against the fall in fee-based income.
Another key difference was TD’s better-than-expected improvement in net interest margins, which widened by 7 basis points from three months ago, to 1.81%. From a year-ago, NIM is 23 basis points higher. This was achieved by its resilient deposit base, as low deposit betas kept funding costs low. Over 80% of TD’s total deposits and approximately 90% of its personal deposits are non-term.
TD Q4 2022 Earnings Presentation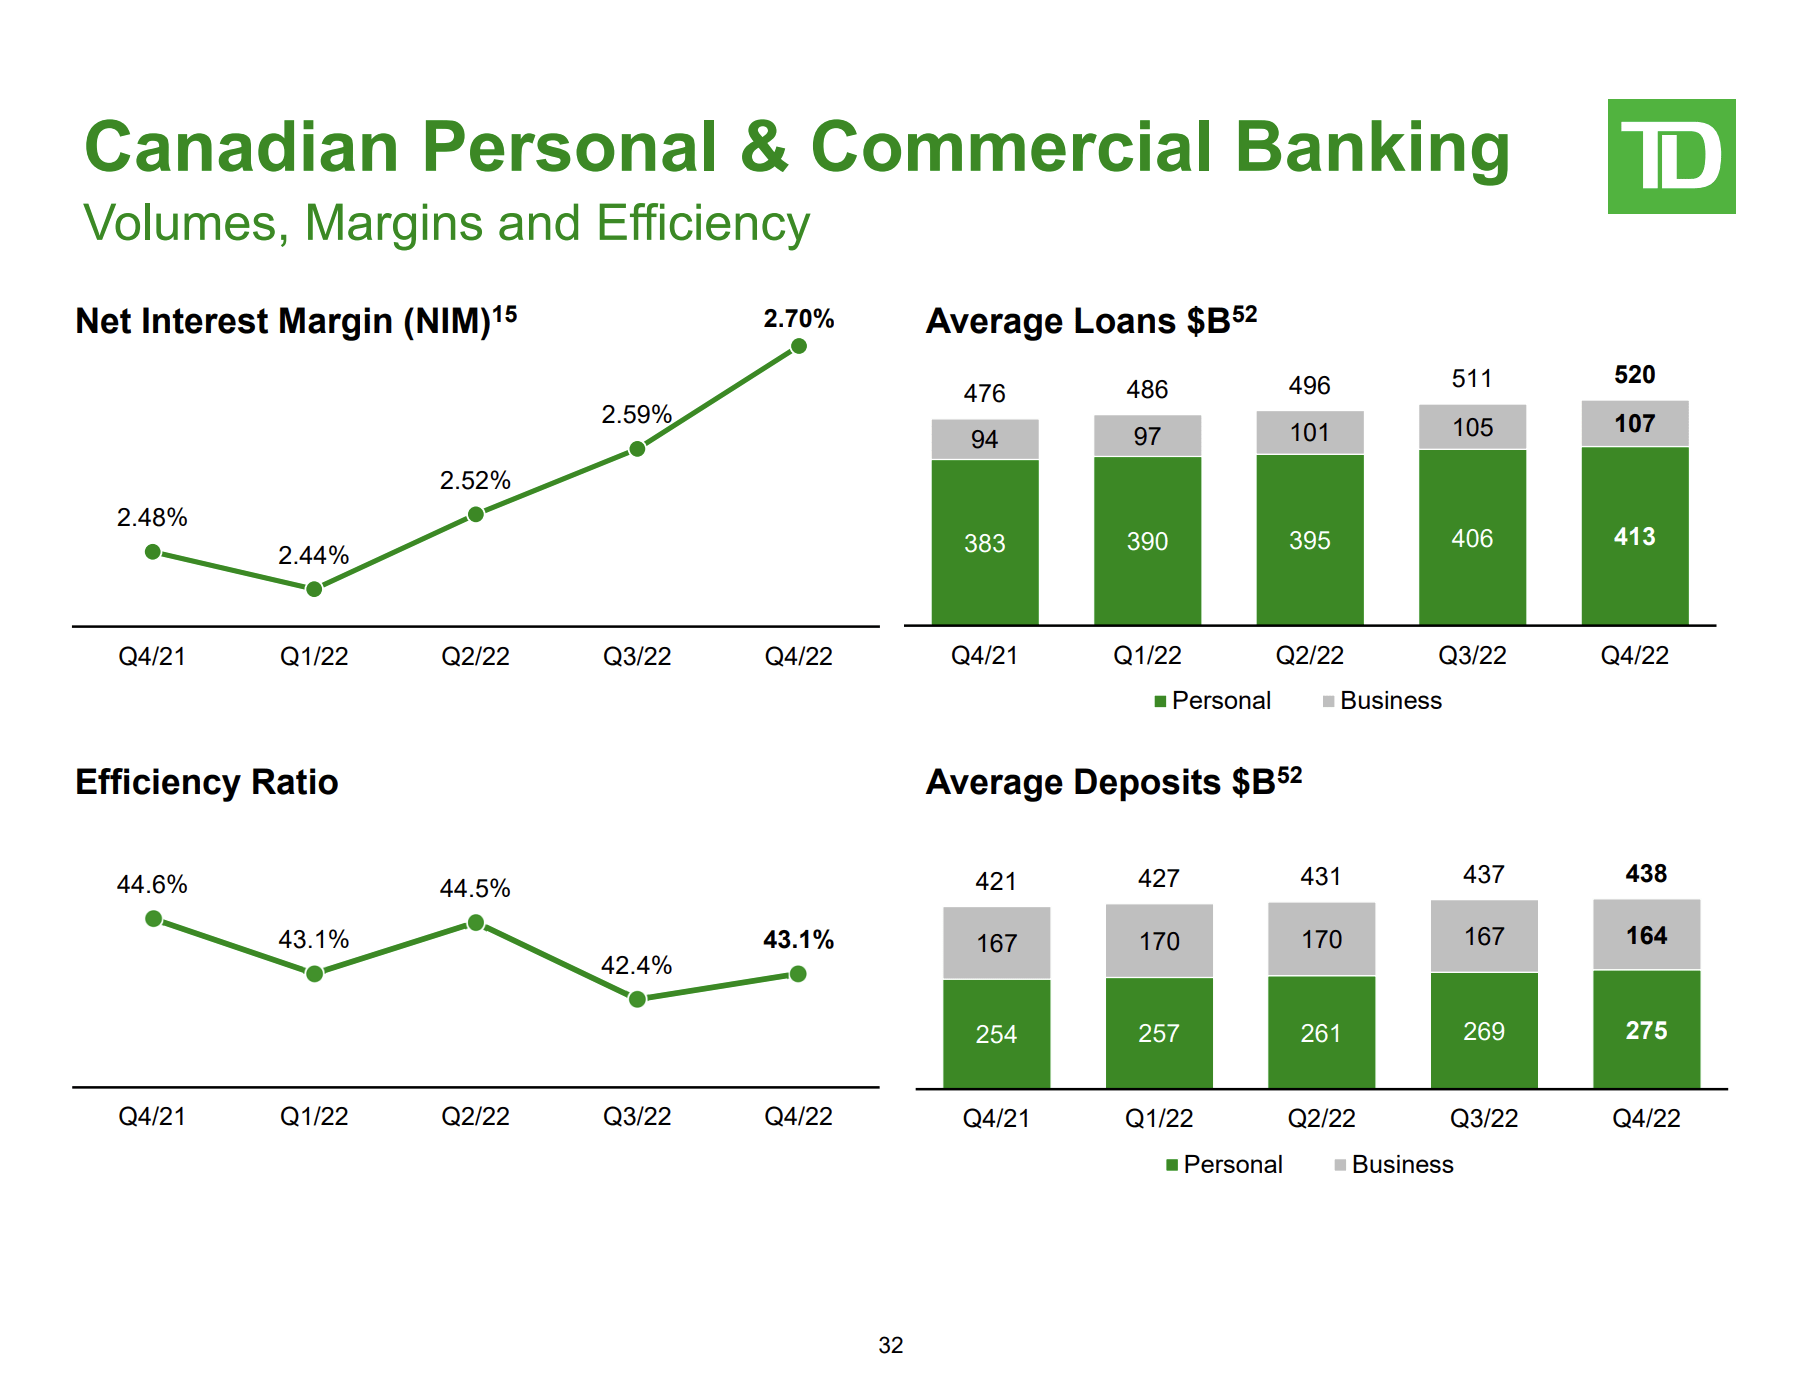
Meanwhile, BMO saw just a 1 basis point improvement in NIM from three months ago – to 1.86%, on lower loan margins and loans growing faster than deposits, which partially offset higher deposit margins. BMO’s NIM expansion has plateaued a bit recently, although it has widened by a similar margin over the past year compared to TD – up 20 basis points from 1.66% in Q4 2021.
Looking ahead, TD is more sensitive to future rate hikes. According to its latest interest rate sensitivity analysis, a 100 basis points increase in interest rates would lift its net interest income by C$1.21 billion (~$901 million) over a 12-month period – equivalent to around 7.9% of its 2022 adjusted net income. This compares to a C$499 million (~$372 million) boost to NII for BMO – equivalent to around 5.5% of its 2022 adjusted net income.
Higher Provisions For Credit Losses
Both banks had to set aside more money to cover bad loans, amid growing macroeconomic headwinds. The impact was more greatly felt at TD, where provisions for credit losses in Q4 2022 rose 75% on a quarterly sequential basis, to C$617 million (~$460 million). Much of the increase was due to a return to performing reserve build and higher impaired PCL in the Canadian and U.S. consumer lending portfolios.
By comparison, BMO’s PCL rose from a significantly lower base – up 66% from Q3 2022, to C$226 million (~$168 million). Here, the increase was mainly driven by a rise in impaired PCL. The bank did book a further C$34 million (~$25 million) PCL on performing loans to take into account the worsening macro backdrop, but this was partly offset by continued reduction in pandemic uncertainty and credit improvement in its loan book.
Going forwards, the pace of credit normalization looks set to continue on slowing GDP growth and other macro concerns, such as inflation and housing.
“So while we are pleased with the low impaired losses this quarter, we do expect our impaired PCL rate to gradually move towards our pre-pandemic experience through fiscal 2023 in the range of high teens to low 20s in terms of basis points.”
Chief Risk Officer Piyush Agrawal, BMO Q4 2022 Earnings Call
TD Vs. BMO – Key Metrics and Valuations
|
TD |
BMO |
|
|
Market capitalization (USD) |
$123.2 billion |
$65.8 billion |
|
Price to earnings ratio |
7.2 |
4.9 |
|
Forward PE ratio |
9.7 |
9.2 |
|
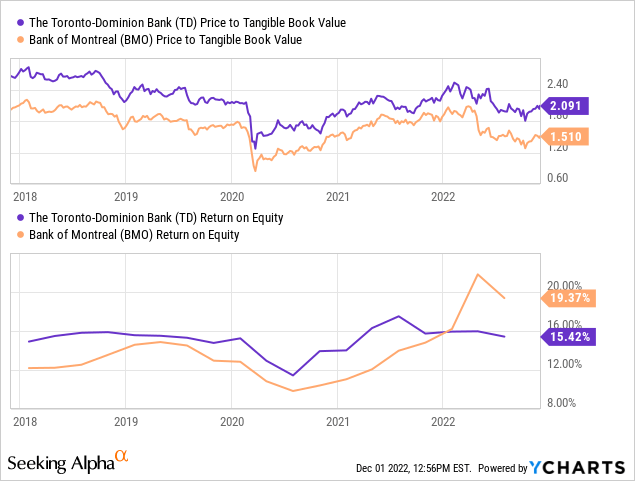
Return on tangible equity (adjusted) |
21.2% |
16.6% |
|
Cost to income ratio (adjusted) |
52.8% |
55.8% |
|
Common equity Tier 1 (CET1) ratio |
16.2% |
16.7% |
|
Share of US segment to adjusted earnings |
36% |
36% |
US Growth Strategies
TD and BMO are two frontrunners in the Canadian banking sector to pursue aggressive growth in the US market. Both currently earn a similar share of earnings from the US – around 36%, having both expanded through numerous acquisitions. Both are also on course to close major deals by the first quarter of 2023 – TD is seeking to acquire Memphis-based First Horizon Corp (FHN) for $13.4 billion, while BMO is buying BNP Paribas’s (OTCQX:BNPQY) San Francisco-based Bank of the West for $16.3 billion.
BMO’s transaction is bigger, both in absolute terms and also relative to its current size. The deal will catapult the US share of the group’s pre-tax earnings to 44%, with Bank of the West contributing 12% on a pro forma basis. However, this also means that execution risks for BMO are higher, as it seeks to merge with a bigger target.
Investment Banking Vs. Retail Focus
TD focuses less on investment banking compared to BMO, with the division accounting for almost 11% of the group’s revenues, compared to roughly 18% for BMO. Both operate as full-service investment banks in both Canada and the US, but TD is more retail and consumer focused than BMO.
This is also reflected by BMO’s relatively lower exposure to Canadian residential mortgages. Lending in this category accounts for less than a quarter of its loan book, compared to nearly 30% of all loans for TD. When we include Home Equity Line of Credit (HELOC), real estate secured lending in Canada rises to 33% and 39%, for BMO and TD, respectively.
Moreover, 31% of BMO’s residential mortgage portfolio is insured through a credited insurer, such as Canada Mortgage and Housing Corporation (CMHC) or Genworth – compared to 29% for TD. This should mean BMO has a relatively smaller exposure to Canada’s housing market correction.
But in any case, a surge in default rates in Canadian residential mortgages doesn’t seem likely, even as home prices fall on rising benchmark interest rate hikes. Banks are partly cushioned by low loan-to-value ratios on uninsured mortgages, which are low – 49% at both TD and BMO. Meanwhile, high levels of mortgage affordability are underpinned by the still resilient macroeconomic backdrop in Canada, which is keeping unemployment low and supporting wage growth. A slowdown in the transaction volumes is another matter though – with the slowing mortgage market expected to be less of a drag on BMO’s loan growth.
Business Lending
BMO is more heavily geared towards lending to businesses. Total loans to business and government accounts for 57% of its loans book, compared to 36% for TD. With business lending growth set to continue to outpace growth in mortgages and consumer loans, BMO should benefit from this tailwind.
Business demand for borrowing is holding up well, as companies are under pressure to rebuild inventories and fund new investments. We are already seeing this make a small difference in terms of loan growth – average net loans and acceptances increased 17% year-on-year for BMO, compared to 15% for TD.
On the downside, asset quality for business loans have historically been more volatile compared to residential mortgages, which could lead to increased cyclicality of returns.
Final Thoughts
The choice between TD and BMO is a hard one; there really is not a whole lot separating the two. Both are well-managed, high-quality businesses with strong track records of delivering attractive long-term shareholder returns.
In TD’s favor, the bank is more sensitive to future interest rate hikes. It has a higher ROTE, enjoys better margins and is less exposed to volatile investment banking revenue.
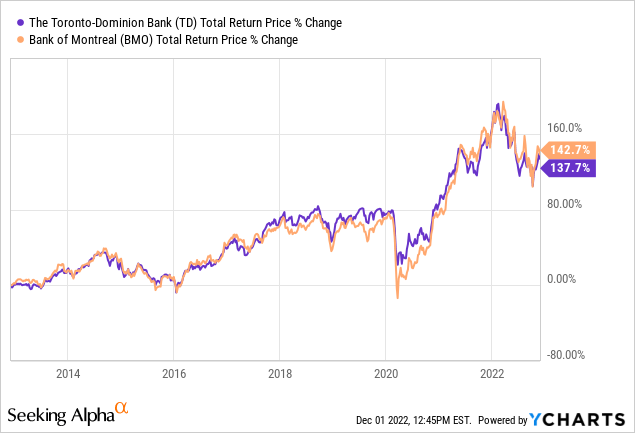
But for me, BMO edges ahead slightly, given its lower valuation multiples, (slightly) higher 10-year return and because of near-term tailwinds benefiting its bias towards business customers.
Be the first to comment