


Justin Sullivan/Getty Images News
Investment Thesis
The Technology Select Sector SPDR Fund (NYSEARCA:XLK) has delivered returns above 470% over the last ten years. Though I don’t expect those gains to repeat in an era of higher interest rates, I believe it will still be a long-term success. Led by Apple (AAPL) and Microsoft (MSFT), this entire ETF is cash flow positive, and only one stock with a negligible weight reported a loss over the last year. Complimented by 20% expected earnings growth and a forward earnings valuation three points less than QQQ, XLK is my Tech ETF of choice, and this article will compare its fundamentals with a dozen peers to demonstrate why.
ETF Overview and Performance
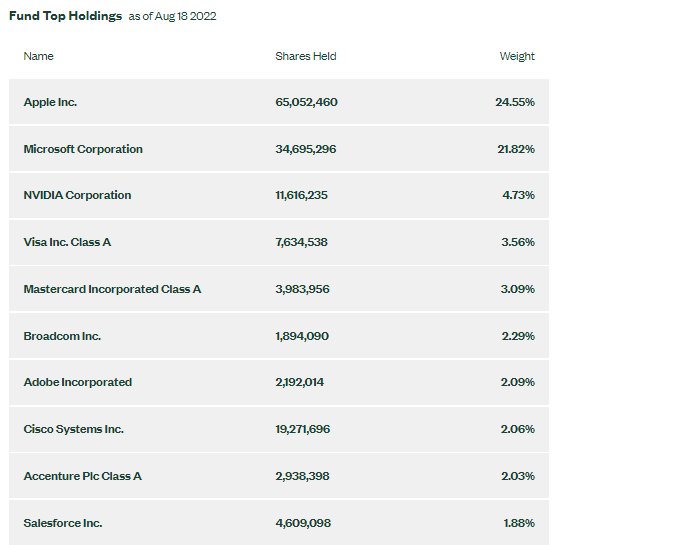
XLK holds the 76 Tech stocks in the S&P 500 and follows a market-cap weighting scheme. Like all SPDR Sector ETFs, fees are just 0.10%, and XLK currently has $43.32 billion in assets under management. It pays a small quarterly dividend (0.81% yield), launched over 23 years ago, and currently has 68.10% of assets in the top ten, as follows:
State Street
These companies combine for $850 billion in sales, $294 billion in operating cash flow, and $239 billion in net income over the last twelve months. They’ve grown sales by $379 billion (81%) in the last five years, and even in the face of higher interest rates, analysts project another $125 billion increase (15%) over the next twelve months. In short, they’re money-making machines.
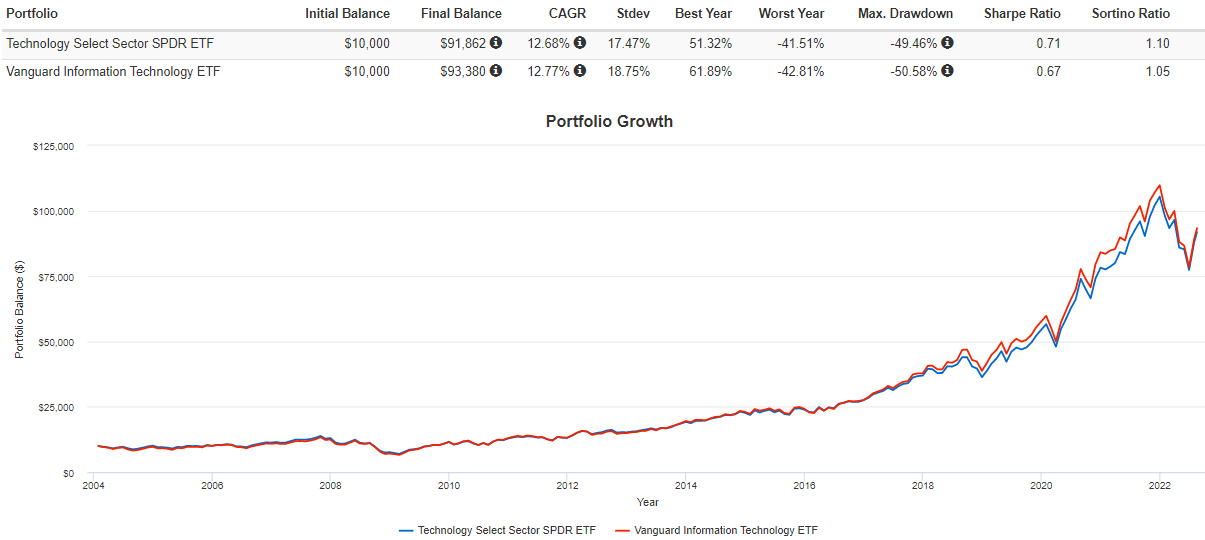
XLK isn’t the only broad-based Tech ETF available. There are 14 other passive ones to choose from, ranging from momentum-focused ones like the Invesco DWA Technology Momentum ETF (PTF) to straightforward, equal-weighted ones like the SPDR NYSE Technology ETF (XNTK). However, regarding popularity and low fees, it’s a two-horse race with the Vanguard Information Technology ETF (VGT). Below is a performance comparison of the two.
Portfolio Visualizer
Since 2004 when VGT launched, the two have followed a similar path, with VGT having the slight edge on annualized returns (12.77% vs. 12.68%). Still, XLK is the least risky, as indicated by lower standard deviation and better ‘worst year’ and ‘maximum drawdown’ figures. As a result, its risk-adjusted returns (Sharpe and Sortino Ratios) were better. I prefer less speculation when discussing a buy-and-hold investment like this. Since 2004, XLK shareholders only lost money in four years: 2005 (0.32%), 2008 (41.51%), 2018 (1.66%), and 2022 (12.86%).
XLK Analysis
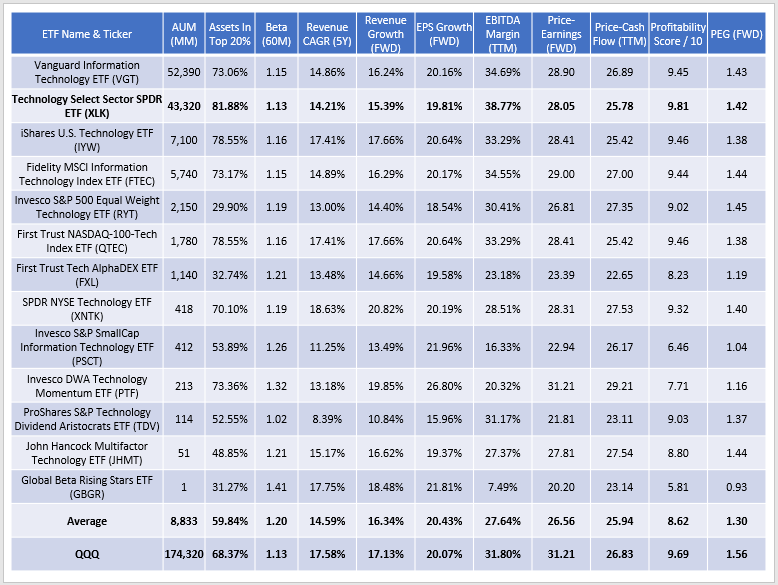
I’ve compiled statistics for all the broad-based passive tech ETFs I track. Pay particular attention to key metrics like volatility, growth, valuation, and profitability, and you’ll quickly see why I hold XLK in high regard.
The Sunday Investor
Overall, XLK has the best Profitability Score of 9.81, which I calculated using Seeking Alpha’s Grades adjusted on a scale from 1-10. A weighted-average 38.77% EBITDA Margin backs the score, more than 4% better than the more diversified Vanguard Information Technology ETF.
XLK is the second-least volatile measured by its constituents’ five-year beta of 1.13. Other options, including VGT, are close but more volatile because of the inclusion of small- and mid-cap tech stocks. The ProShares S&P Technology Dividend Aristocrats ETF (TDV) is the least volatile, but it’s not suited for growth investors. Its constituents’ estimated sales growth, for example, is only 10.84%, the lowest in the peer group.
On the other hand, XLK’s estimated sales and earnings growth rates are just below the peer average of 16.34% and 20.43% and on par with the two other major broad-based ETFs (VGT, FTEC). For growth-at-a-reasonable-price proponents, dividing XLK’s estimated earnings growth rate into its forward price-earnings ratio yields a figure of 1.42. That’s better than VGT (1.43) and FTEC (1.44), and you’re getting superior profitability. It even scores better than the 1.56 figure for the Invesco QQQ ETF (QQQ).
The critical issue will always be valuation, but that shouldn’t be a significant concern if you plan to buy and hold. To illustrate, consider the following two portfolios formed by size and operating profitability sourced from the Kenneth French Data Library. The blue bars represent large-cap stocks with low profitability, and the orange bars represent large-cap stocks with high profitability. In this 30-year sample from 1992-2022, the high profitability portfolio outperformed 18 times, and the average annual outperformance was 2.18% per year over the entire 30 years.

Chart: The Sunday Investor; Data: Kenneth French Data Library
There are times when low-profitability stocks prevail, and this often occurs after periods of significant underperformance. From 2000-2002, the low profitability portfolio underperformed by a cumulative 36%, only to rebound by 13% from 2003-2004. In 2008, they underperformed by 7% but outperformed by 4.5% the following year.
The reverse is also true. Before the tech crash in the early 2000s, low profitability stocks outperformed by nearly 20%. Recently in 2020, they beat by 12%, followed by a 28% miss in 2021. Call it evidence of mean reversion theory or plain old market irrationality, but my message is the same. If long-term investors worry less about valuation and more about profitability, they’ll eventually be rewarded. As far as Tech ETFs go, XLK is your best bet.
Investment Recommendation
XLK is the most profitable Tech ETF due to its large allocation to mega-caps Apple and Microsoft and exclusion of small- and mid-caps. Over the last 30 years, large-cap high profitability stocks outperformed low ones by 2.18% per year on average. For those fearing a repeat of 2008, know that profitable stocks outperformed by 7% that year. In my view, one of the best things you can do to control risk is to review your portfolio’s profitability.
One reason not to buy XLK is if you already hold Apple and Microsoft in high allocations. Also, short-term investors may find low profitability stocks attractive now, but as I explained in this article on the ARK Fintech Innovation ETF (ARKF), I find this argument unconvincing. Earnings surprises are below their long-term averages, and the fundamentals don’t support a return to an extreme risk-on environment. Therefore, I believe XLK is the safest and most rewarding Tech ETF in the short- and long-term, and I look forward to discussing it more in the comments section below.
Be the first to comment