

Urupong/iStock via Getty Images
The Technology Sector SPDR, XLK, is composed of stocks in the S&P 500 that are classified as technology. This ETF is quite popular, with $48.5B in assets, albeit much smaller than QQQ, which has $194B in assets. It may be tempting to assume that QQQ and XLK are somewhat interchangeable, but it is important to recognize the differences. This starts with examining the top holdings. While QQQ and XLK both have Apple (NASDAQ:AAPL) and Microsoft (NASDAQ:MSFT) as their top 2 holdings, the portfolios are otherwise not very similar. Amazon (NASDAQ:AMZN), the 3rd-largest holding in QQQ, is in the Consumer Discretionary Sector SPDR, XLY, rather than in XLK, for example.
Top 10 holdings for XLK and QQQ (Morningstar)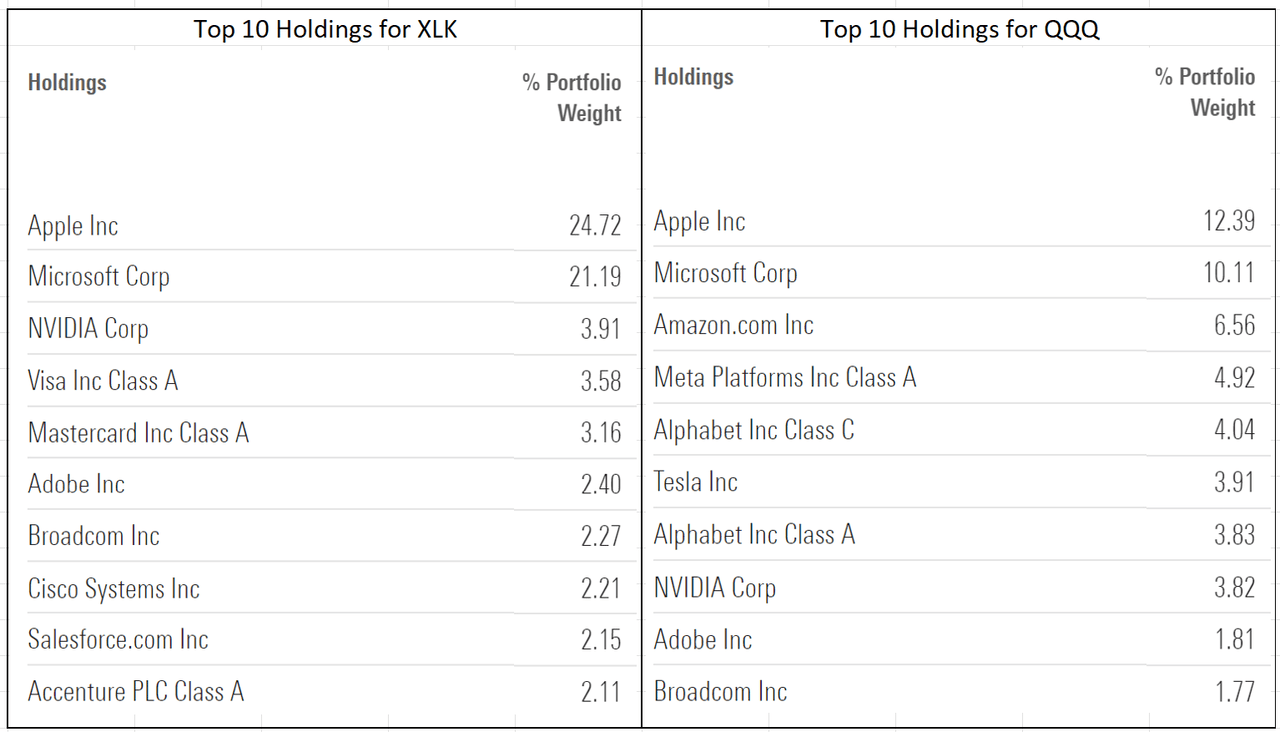
Given the differences in the largest holdings, it should not be surprising that the returns are quite different. XLK has returned 23.15% over the past 12 months and annualized 3-year return is 36.4%, as compared to 13% and 30.95% for QQQ for these two periods, respectively.
Another way to compare these two funds is by looking at a Fama-French factor analysis. From this view, QQQ and XLK look quite similar. Both have betas that are slightly higher than 1 and both have factor tilts that favor large cap (negative loadings on SMB factor) and both are tilted to favor growth over value (negative loadings on HML). XLK has a stronger large cap tilt, which is not surprising given the enormous allocations to AAPL and MSFT.
Fama-French factor analysis results for QQQ and XLK using 3 years of monthly returns (Portfoliovisualizer.com)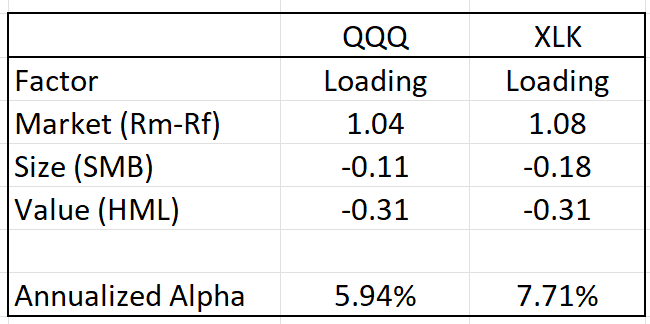
A third way to compare QQQ and XLK is by looking at their correlations to the S&P 500 (SPY) and, for context, the Vanguard Information Technology ETF (VGT). VGT has very similar top holdings to XLK but includes companies with smaller market caps. XLK has 70% of its assets in what Morningstar classifies as giant stocks, as compared to 61% for VGT. The correlations of QQQ, XLK, and VGT to the S&P 500 are almost identical. The correlations of XLK and VGT to QQQ are equal, at 98%. XLK and VGT have a 100% correlation to one another. These results use 3 years of month return data.
3-Year correlations between SPY, QQQ, XLK, and VGT (Portfoliovisualizer.com)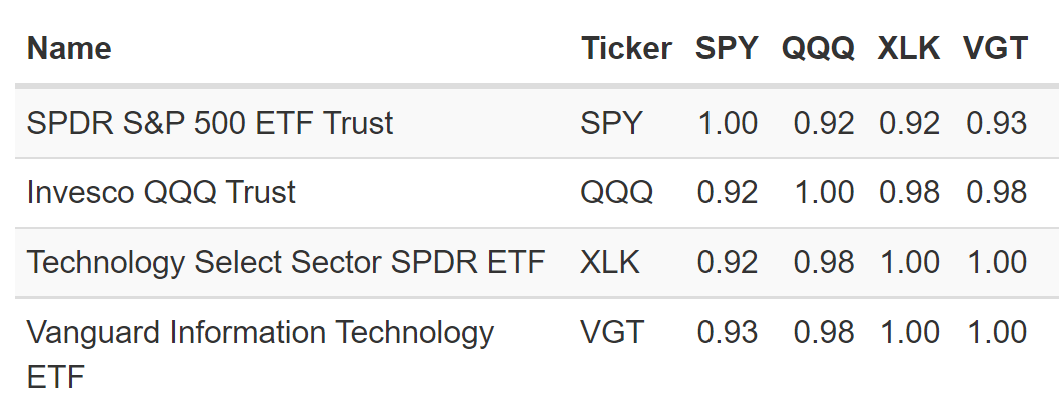
While a 98% correlation between XLK and QQQ might indicate that these funds are reasonable proxies for one another, the spread in returns over the past year emphasizes that the details of the holdings can have a substantial impact on performance.
I last wrote about XLK on February 13, 2021, almost a year ago, and I assigned a bullish / buy rating to XLK as a proxy for tech stocks. Since then, XLK has delivered a total return of 17.4%. The bullish view was based on the market-implied outlook, a probabilistic forecast that reflects the consensus view of the options market.
Performance of XLK since my post on February 13, 2021 (Seeking Alpha)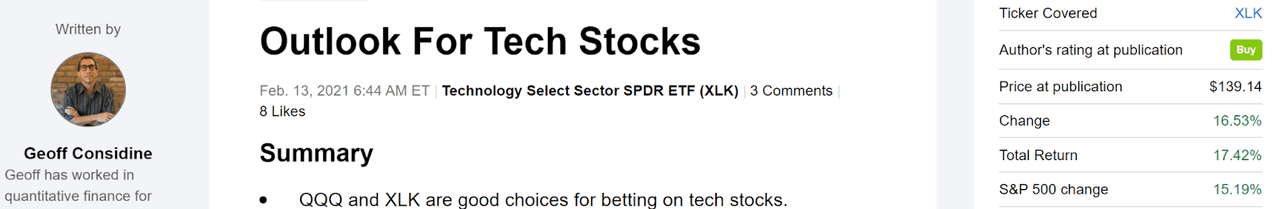
The price of an option on a stock or ETF reflects the market’s consensus estimate of the probability that the share price of the stock or ETF will rise above (call option) or fall below (put option) a specific level (the strike price of the option) between now and when the option expires. By analyzing prices of call and put options at a range of strike prices, all with the same expiration date, it is possible to calculate a probabilistic price return forecast that reconciles all of the options prices. This is called the market-implied outlook and represents the consensus view implicit in the prices of options. This technique is widely researched and I use my own implementation. To calculate the market-implied outlook, the options trading on the underlying stock or ETF needs to be relatively active. While the options trading on XLK is small compared to QQQ, there is sufficient trading to make a market-implied outlook reasonable.
I have calculated the market-implied outlooks for XLK and QQQ to the middle of 2022 and to early 2023.
Market-Implied Outlooks
I have calculated the market-implied outlooks for XLK and QQQ for the 4.4-month period from now until June 17, 2022 and for the 11.5-month period from now until January 20, 2022 using options that expire on these dates.
The standard presentation of the market-implied outlook is in the form of a probability distribution of price return, with probability on the vertical axis and return on the horizontal.
Market-implied price return probabilities for XLK for the 4.4-month period from now until June 17, 2022 (Author’s calculations using options prices from E-TRADE)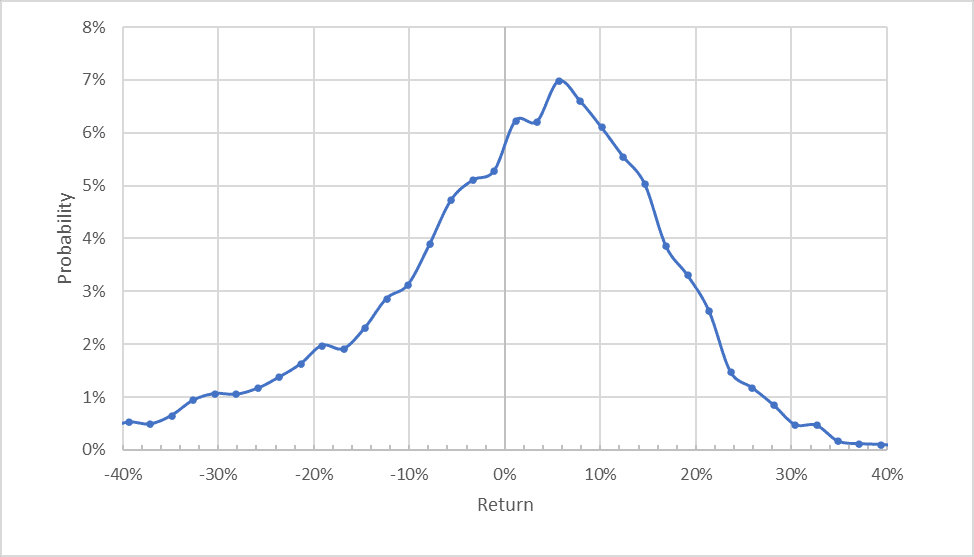
The overall shape of the distribution is what we expect to see for a diversified portfolio (as opposed to an individual stock) with a well-defined peak at a positive pierce return and a long negative tail (i.e. negative skewness). The peak probability corresponds to a price return of +5.7% for the 4.4-month period. The volatility calculated for this distribution is 17.1% (28% annualized).
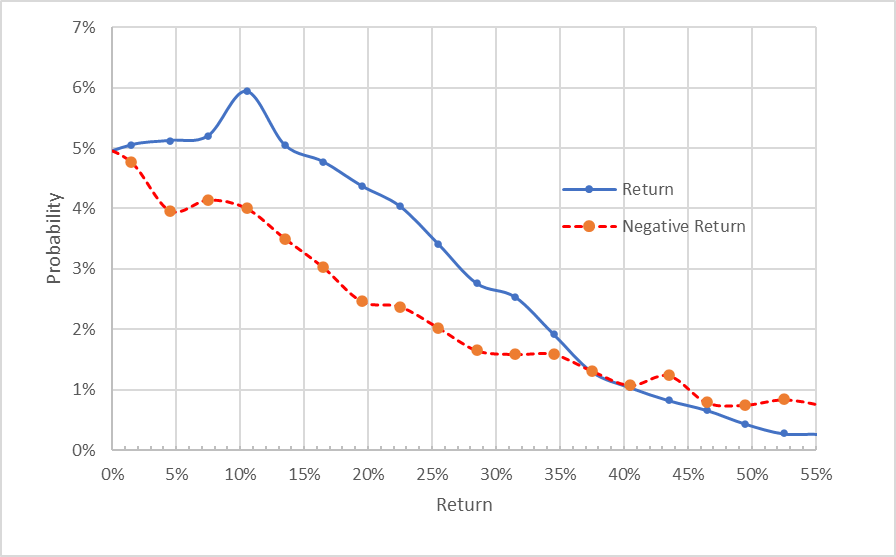
To make it easier to directly compare the probabilities of positive and negative return, I rotate the negative return side of the distribution about the vertical axis (see chart below).
Market-implied price return probabilities for XLK for the 4.4-month period from now until June 17, 2022. The negative return side of the distribution has been rotated about the vertical axis (Author’s calculations using options prices from E-TRADE)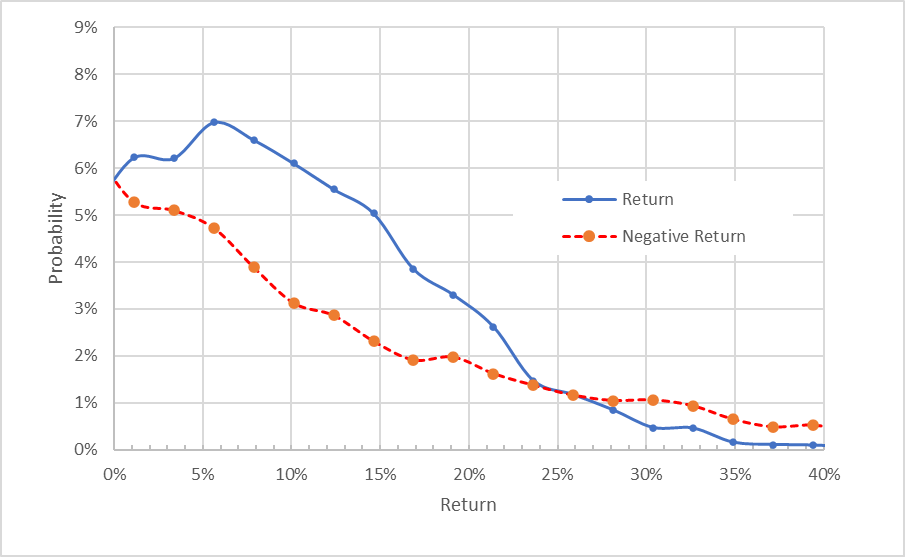
It is useful to compare the market-implied outlooks for QQQ and XLK for the 4.4-month period.
Market-implied price return probabilities for QQQ for the 4.4-month period from now until June 17, 2022. The negative return side of the distribution has been rotated about the vertical axis (Author’s calculations using options prices from E-TRADE)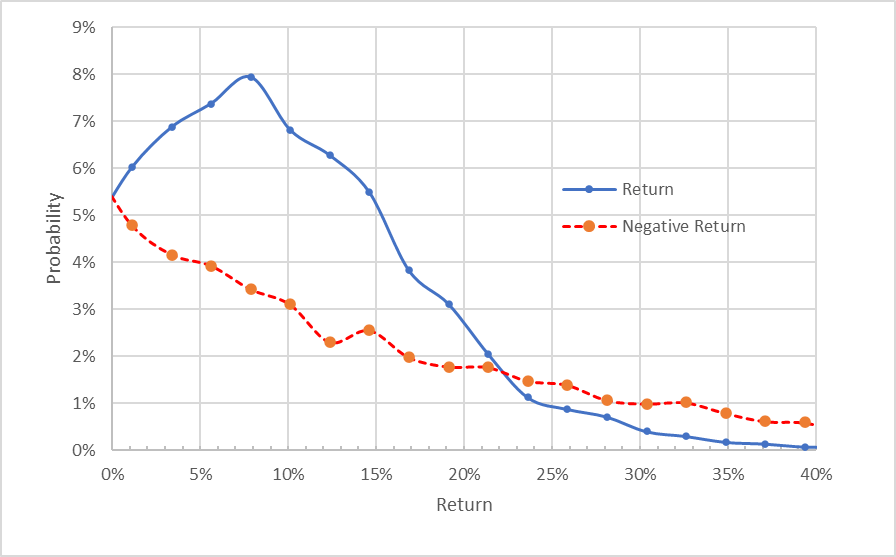
The outlook for QQQ has the peak probability at a return of +7.8% and the volatility for this distribution is 17.1% (annualized volatility of 28%). I look at the ratio of the peak probability return with the period volatility. For QQQ, the ratio is 45.6% (7.8%/17.1%) as compared to 33% (5.7%/17.1%) for XLK. Based on this metric, QQQ provides a more attractive risk / return proposition. This is also evident in the larger spread between the probabilities of positive returns and those for negative returns (the vertical distance between the solid blue line and the dashed red line).
Looking at the 11.5-month outlooks for XLK and QQQ (calculated using options that expire on January 20, 2023), the results are consistent with view to the middle of 2022.
Market-implied price return probabilities for XLK for the 11.5-month period from now until January 20, 2023. The negative return side of the distribution has been rotated about the vertical axis (Author’s calculations using options prices from E-TRADE) Market-implied price return probabilities for QQQ for the 11.5-month period from now until January 20, 2023. The negative return side of the distribution has been rotated about the vertical axis (Author’s calculations using options prices from E-TRADE)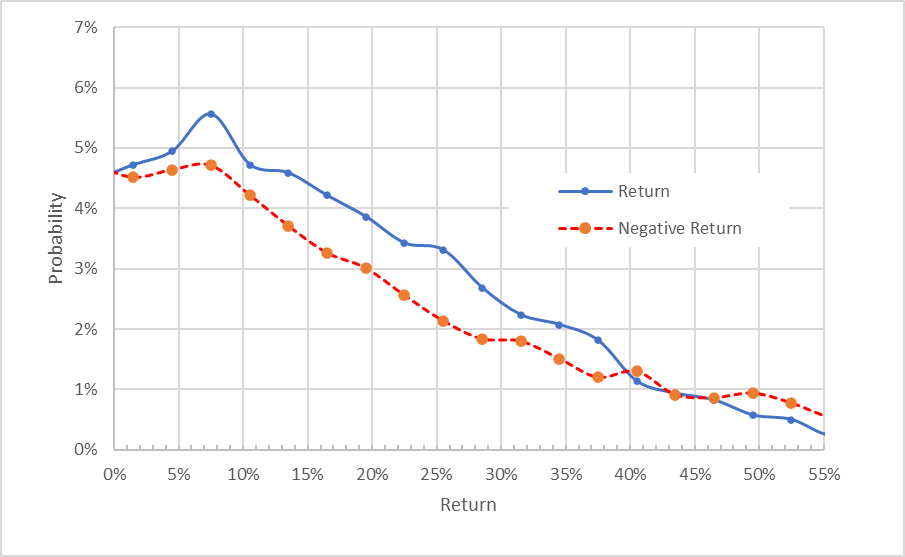
The maximum probabilities correspond to returns of +7.5% for XLK and +10.5% for QQQ. The expected volatilities calculated from these outlooks are 25.8% and 25.7% for XLK and QQQ, respectively. The ratio of peak probability return to volatility is 29% for XLK and 41% for QQQ. QQQ looks substantially more attractive than XLK for the 11.5-month outlook.
A key difference between XLK and QQQ is that XLK is much more concentrated (AAPL and MSFT comprise 47% of the portfolio). This, in turn, means XLK is more exposed to the company-specific risks associated with AAPL and MSFT.
Summary
XLK holds technology stocks from the S&P 500. QQQ tracks the NASDAQ 100 and is not explicitly a tech fund / index. The big questions are (1) whether XLK is attractive on its own merits and (2) whether investors are likely to be better served by getting tech exposure using QQQ? The market-implied outlooks suggest that the overall risk-return proposition for QQQ is better than for XLK, although this may be entirely due to the higher level of concentration in XLK. I am reducing my rating on XLK to neutral because the market-implied outlooks to the middle of 2022 and to early 2023 suggest that the specific portfolio held by this fund is not terribly attractive as compared to QQQ. XLK has substantially outperformed QQQ over the past year and 3 years, but the market-implied outlooks indicate that this outperformance is not likely to persist.
Be the first to comment