

David Ryder
Introduction
The independent US refiner and marketer, Ohio-based Marathon Petroleum (NYSE: NYSE:MPC), released its third-quarter 2022 results on November 1, 2022.
Note: I have followed MPC quarterly since 2018 with 16 articles and counting. This new article is a quarterly update of my article published on August 8, 2022.
3Q22 results snapshot
Marathon Petroleum reported a better-than-expected adjusted income of $7.81 per share for the third quarter. Net income was $4,477 million, compared to $694 million in 3Q21. Revenues increased significantly from $32.61 billion last year to $47.24 billion.
MPC 3Q22 Highlights (MPC Presentation)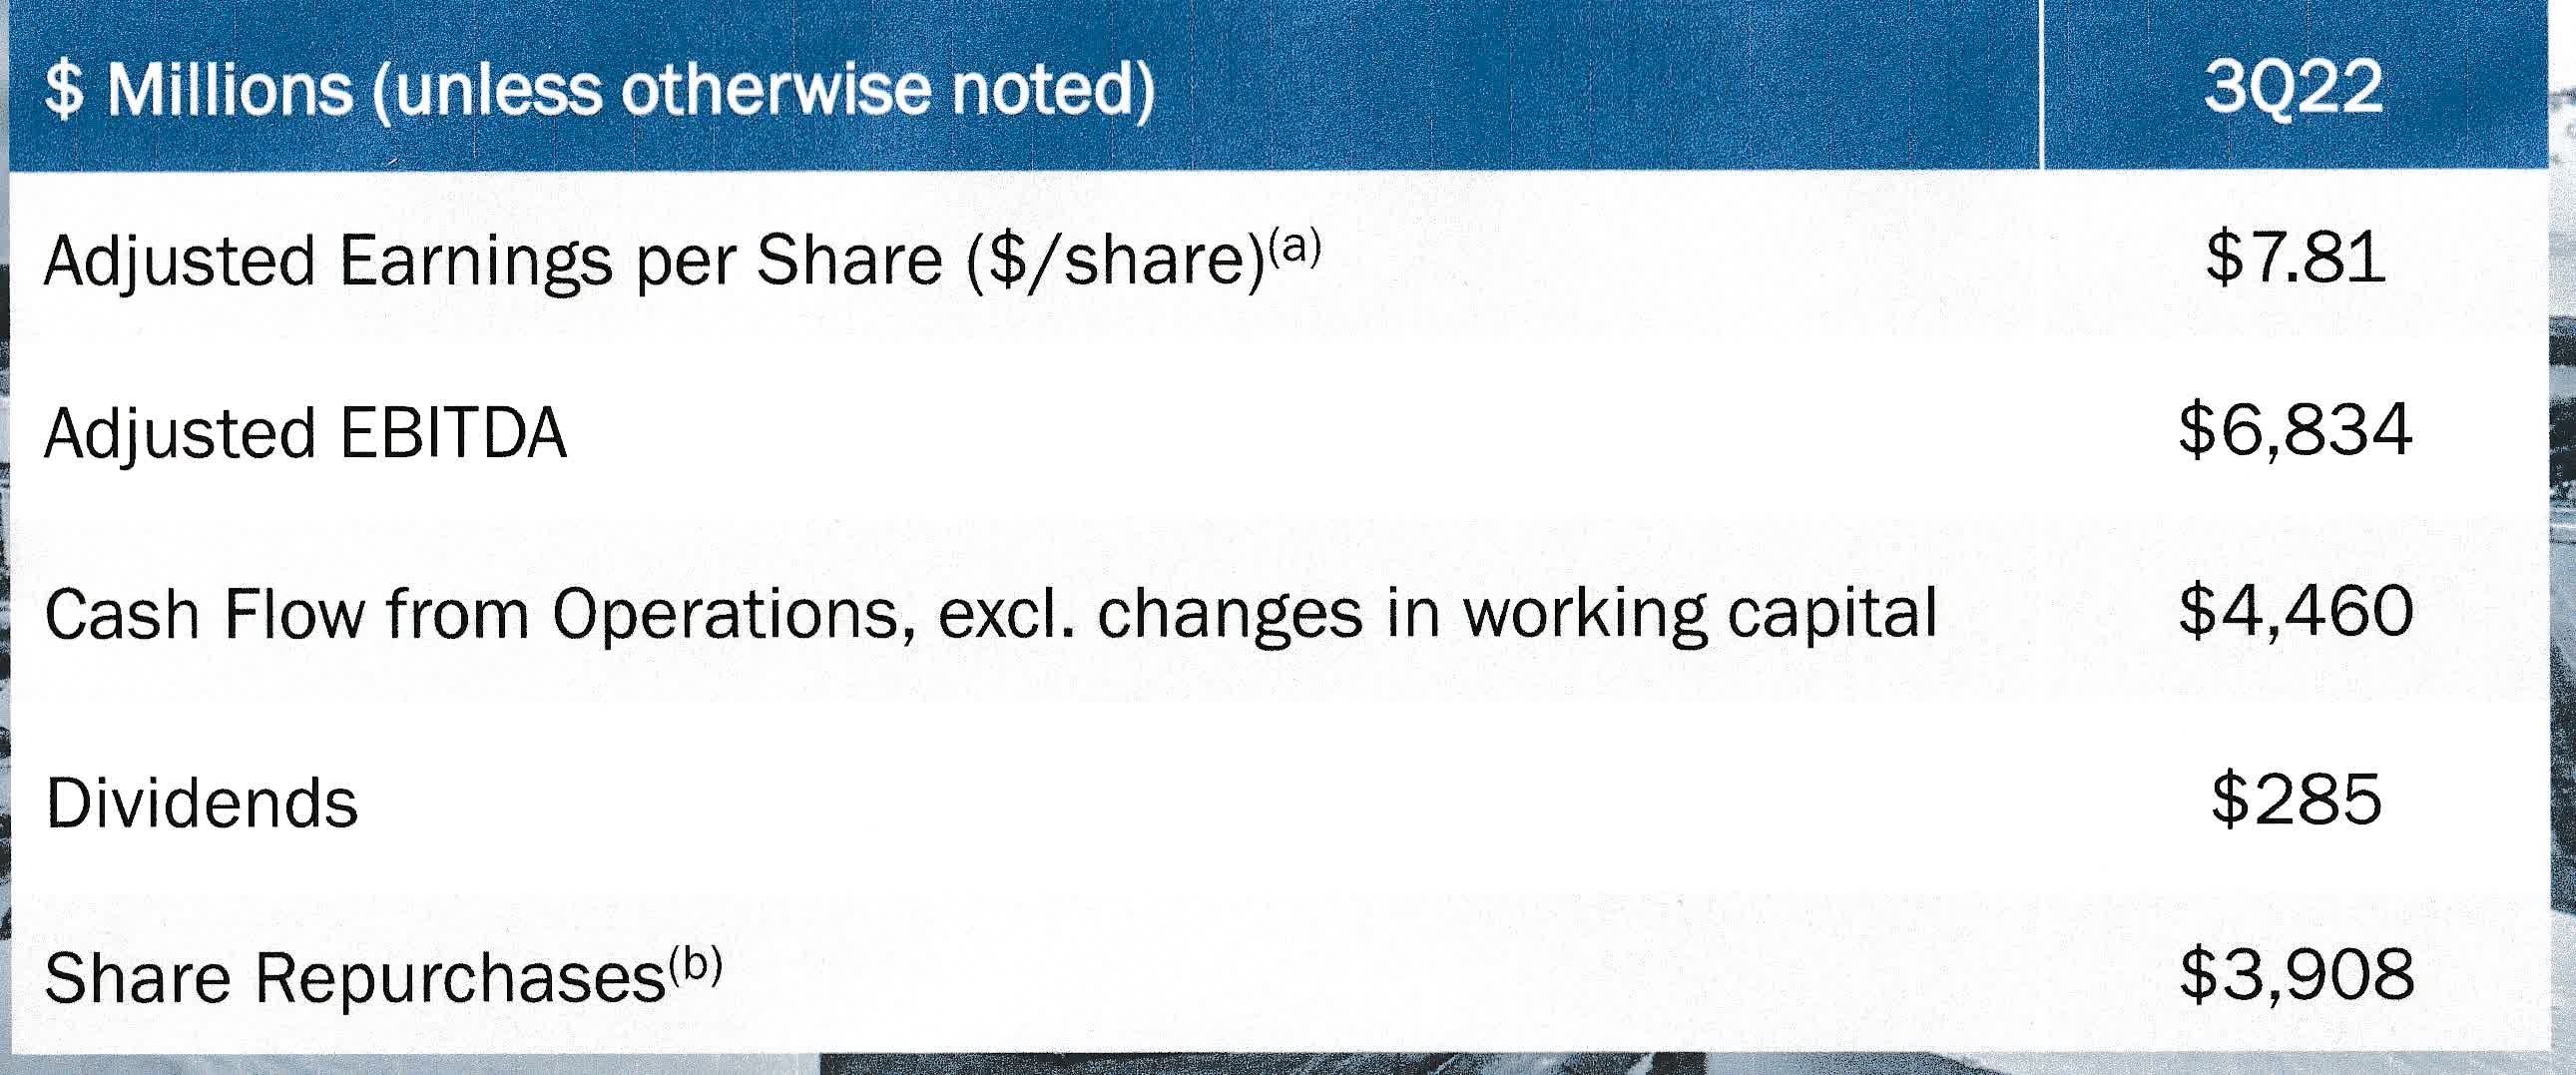
The company’s results were positively impacted by the stronger-than-expected performance of its Refining & Marketing segment, with income totaling $4,625 million (please see the chart below).
MPC Quarterly revenue comparison 3Q21 versus 3Q22 (Fun Trading)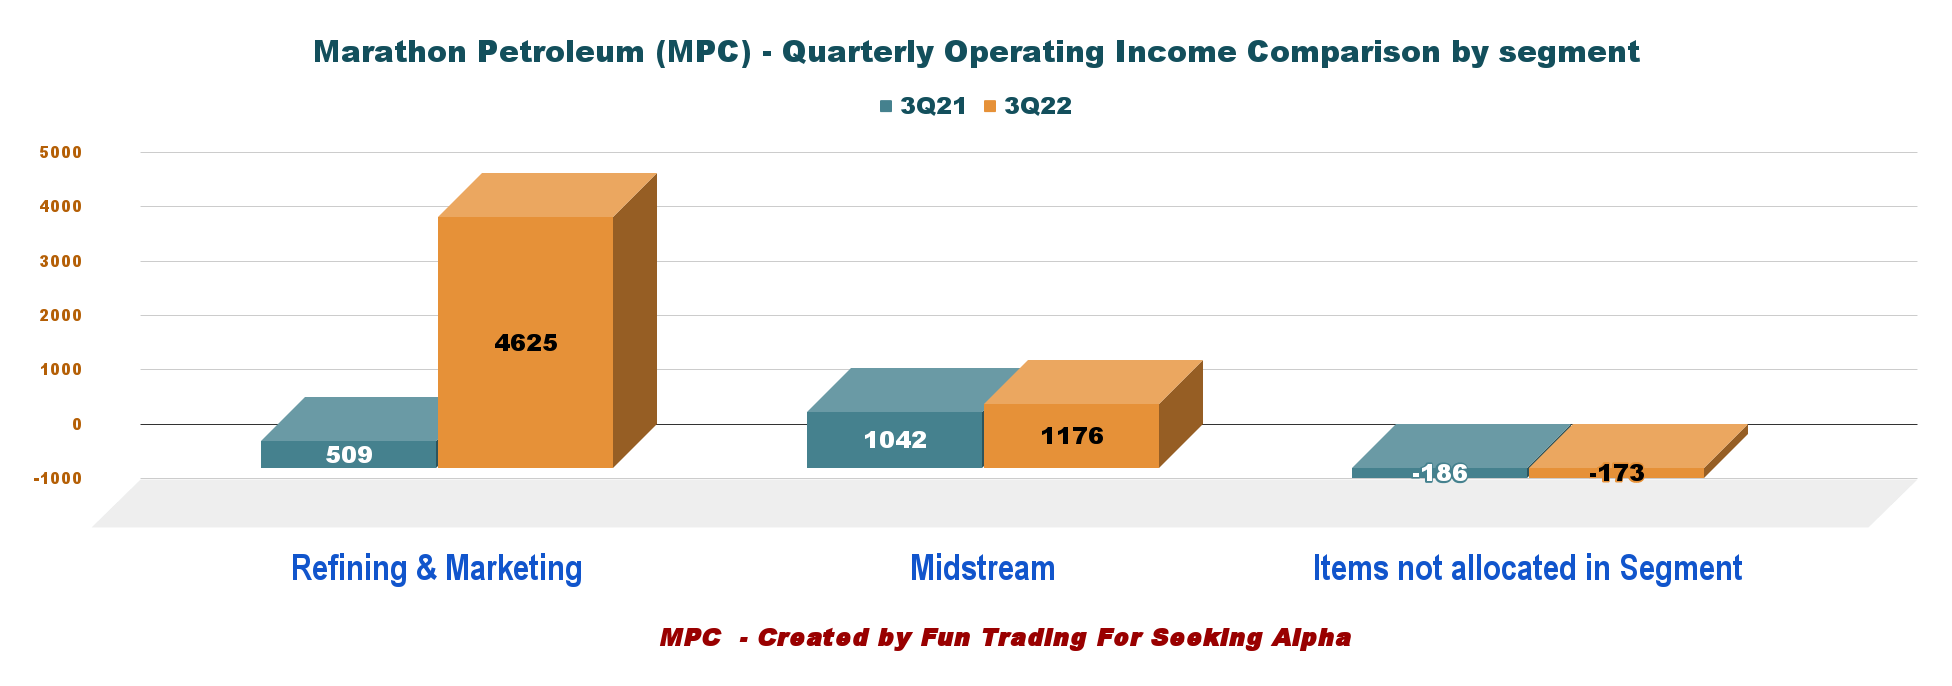
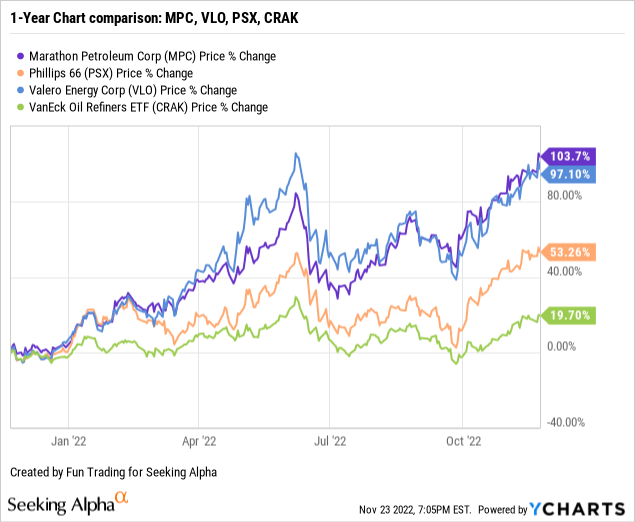
Stock performance
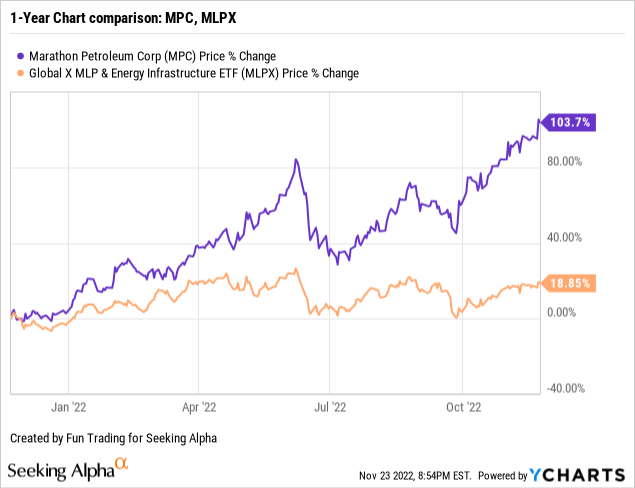
I recommend following the VanEck Vectors Oil Refiners ETF (CRAK) for investors interested in the refining sector.
Marathon Petroleum has outperformed PSX, VLO, and CRAK and is up a whopping 104% on a one-year basis, above its record established in June. VLO is close, but PSX and CRAK are lagging well behind.
Investment thesis
Marathon Petroleum has performed exceptionally well the past few months and is now the leader of the refiner group. However, my first choice in this segment remains Valero Energy (VLO).
The war in Ukraine and the geopolitical uncertainties we have experienced since the start of 2022 have created perfect conditions for the refiners to thrive and prosper.
Elevated oil prices and supply disruptions have created a favorable environment for the refining world until now. However, this booming commodity cycle has fueled record inflation not seen for decades and prompted the Fed to hike interest rates three times already by 75 points and potentially another 75 points on December 14, depending on the following CPI numbers.
Oil is now struggling, and WTI is trading at $77 per barrel, a level not seen for many months due to concern about China struggling with COVID-19 and an elevated recession threat.
This situation endangers the refining world because a recession will significantly affect demand.
Thus, it is prudent to trade LIFO for about 40% of your long-term position in case of a steep retracement if the market gets frightened by an increased risk of a painful recession.
By the way, keeping a long-term holding makes sense from a long-term investor’s perspective because MPC pays a dividend yield of 2.39%, which is not negligible but still a little low compared to its peers.
MPC Dividend Comparison MPC, PSX, VLO (Fun Trading)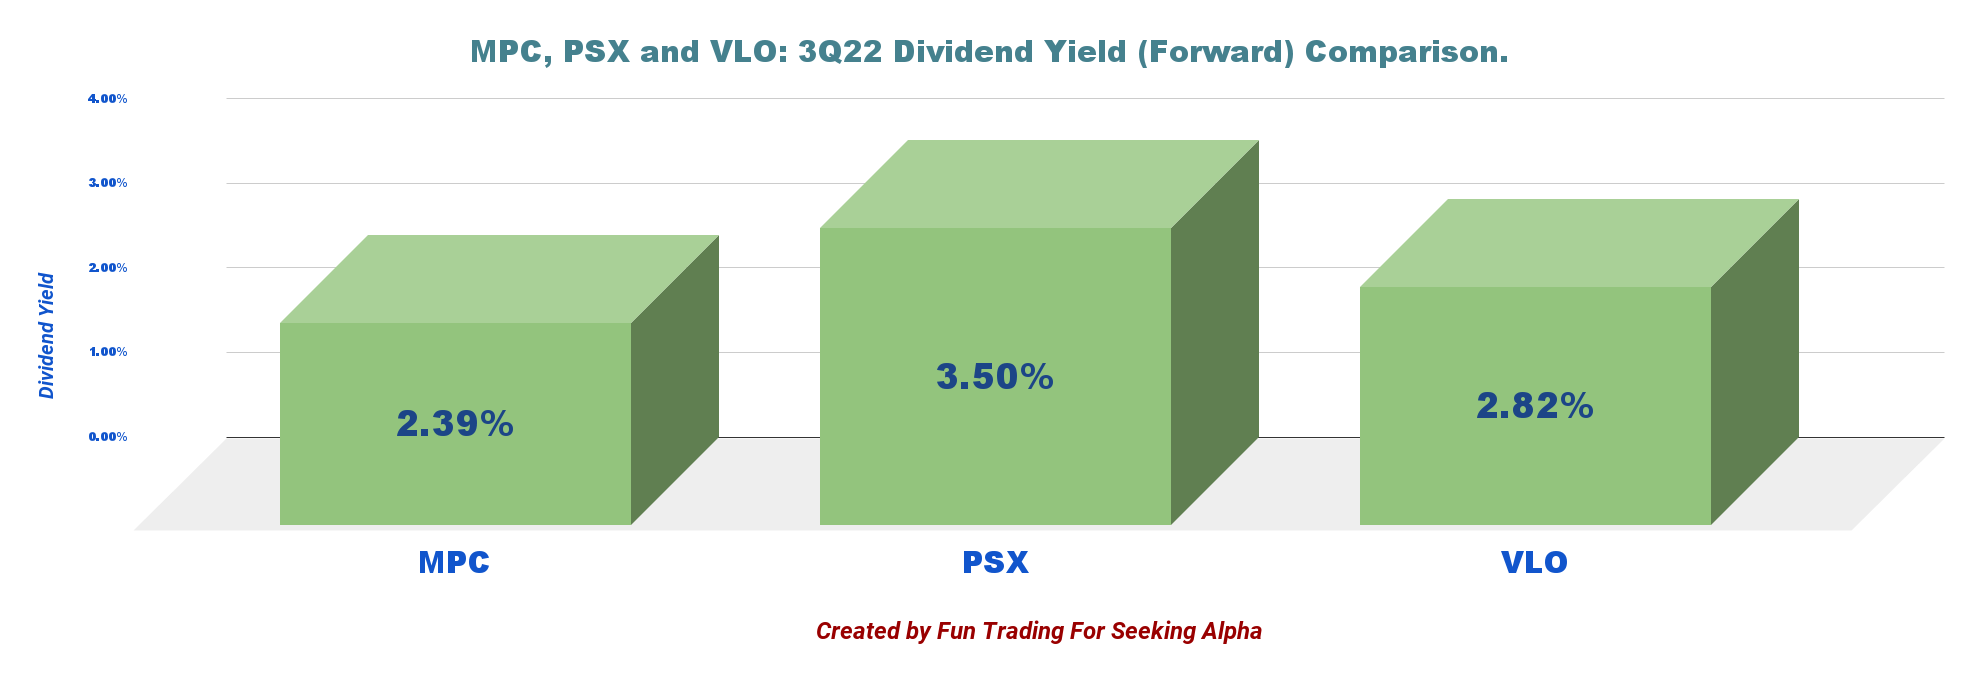
Margins by Region
Marathon Petroleum declared a global R&M margin of $30.21 per Bbl based on throughput per region. Margins are still well above normal this quarter, despite dropping significantly from 2Q22.
Details below:
| Gulf Coast | Mid Continent | West Coast | Total |
| $27.39/per Bbl | $31.04/per Bbl | $35.83/per Bbl | $30.21/per Bbl |
Below is the chart indicating the revenues and the net income for the third quarter comparison for Marathon Petroleum, Valero Energy, and Phillips 66.
MPC 3Q22 Revenues and Net income for MPC, VLO, and PSX (Fun Trading)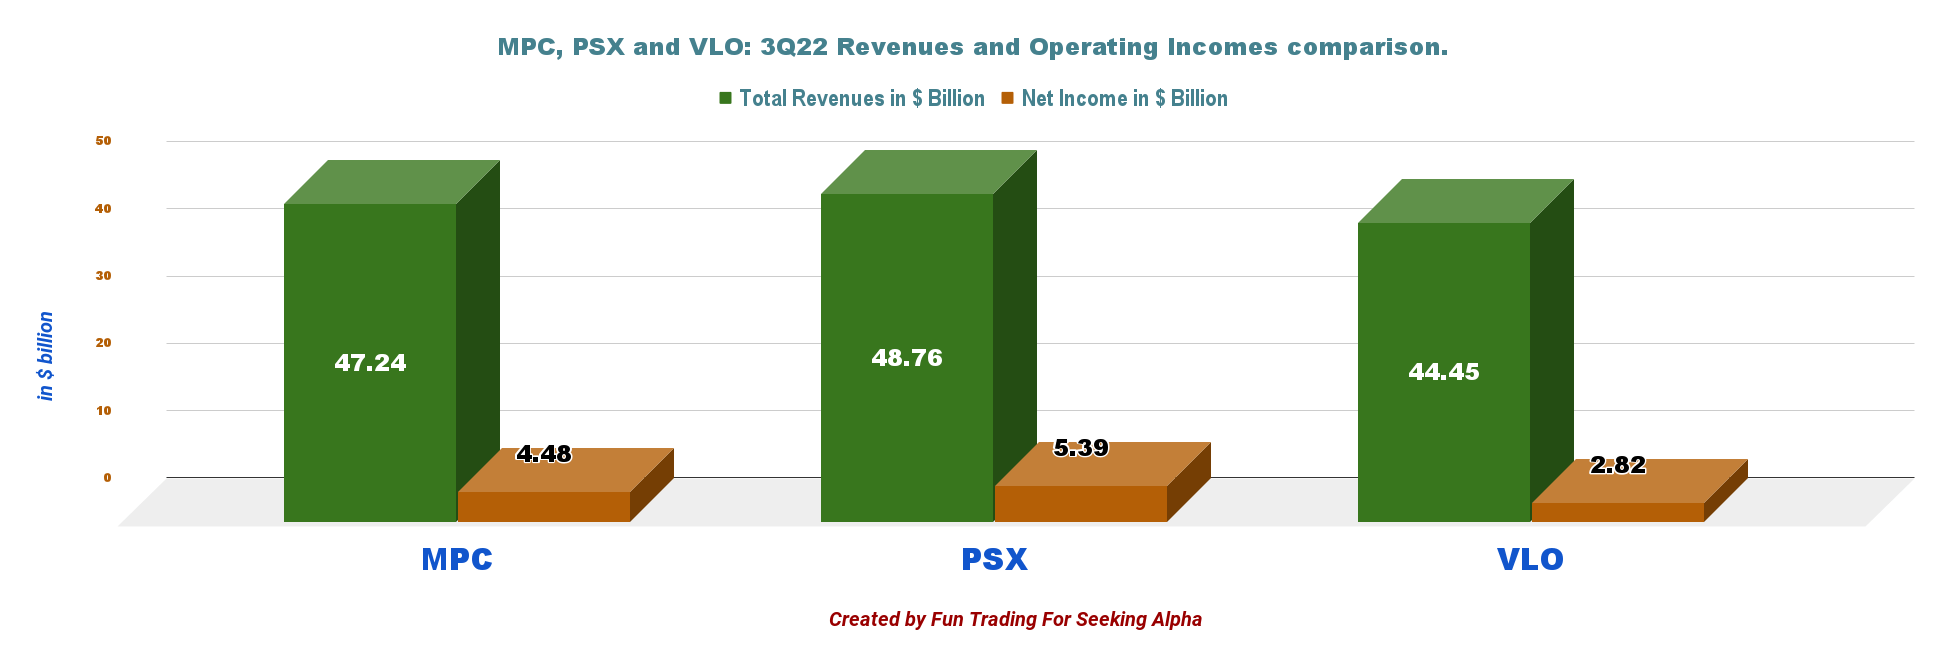
Marathon Petroleum – Financials History: The Raw Numbers – Third Quarter 2022
| Marathon Petroleum | 3Q21 | 4Q21 | 1Q22 | 2Q22 | 3Q22 |
| Total Revenues in $ Billion | 32.32 | 35.34 | 38.06 | 53.80 | 45.79 |
| Total Revenues and others in $ Billion | 32.61 | 35.61 | 38.38 | 54.24 | 47.24 |
| Net Income available to common shareholders in $ Million |
694 |
774 |
845 |
5,873 |
4,477 |
| EBITDA $ Million | 2,161 | 2,463 | 2,546 | 9,134 | 7,543 |
| EPS diluted in $/share | 1.09 | 1.27 | 1.49 | 10.95 | 9.06 |
| Operating cash flow in $ Million | -1,148 | 3,674 | 2,513 | 6,952 | 2,514 |
| CapEx in $ Million | 377 | 481 | 495 | 498 | 701 |
| Free Cash Flow in $ Million | -1,525 | 3,193 | 2,018 | 6,454 | 1,813 |
| Total Cash $ Billion | 13.23 | 10.84 | 10.60 | 13.32 | 11.14 |
| Debt Consolidated in $ Billion | 27.34 | 25.54 | 26.71 | 26.77 | 26.70* |
| Dividend per share in $ | 0.58 | 0.58 | 0.58 | 0.58 | 0.75 |
| Shares Outstanding (Diluted) in Million | 637 | 605 | 568 | 536 | 494 |
| Operating Income per Segment in $ million | 3Q21 | 4Q21 | 1Q22 | 2Q22 | 3Q22 |
| Refining & Marketing | 509 | 881 | 768 | 7,134 | 4,625 |
| Midstream | 1,042 | 1,070 | 1,072 | 1,126 | 1,176 |
| Items not allocated in the Segment | -186 | -173 | -161 | 68 | -173 |
Source: Company News
* MPC debt is $6,923 million, and MPLX debt is 19,779 million in 3Q22.
Analysis: Earnings Details
1 – Revenues and other income were $47.24 billion in 3Q22
MPC Quarterly Revenues history (Fun Trading)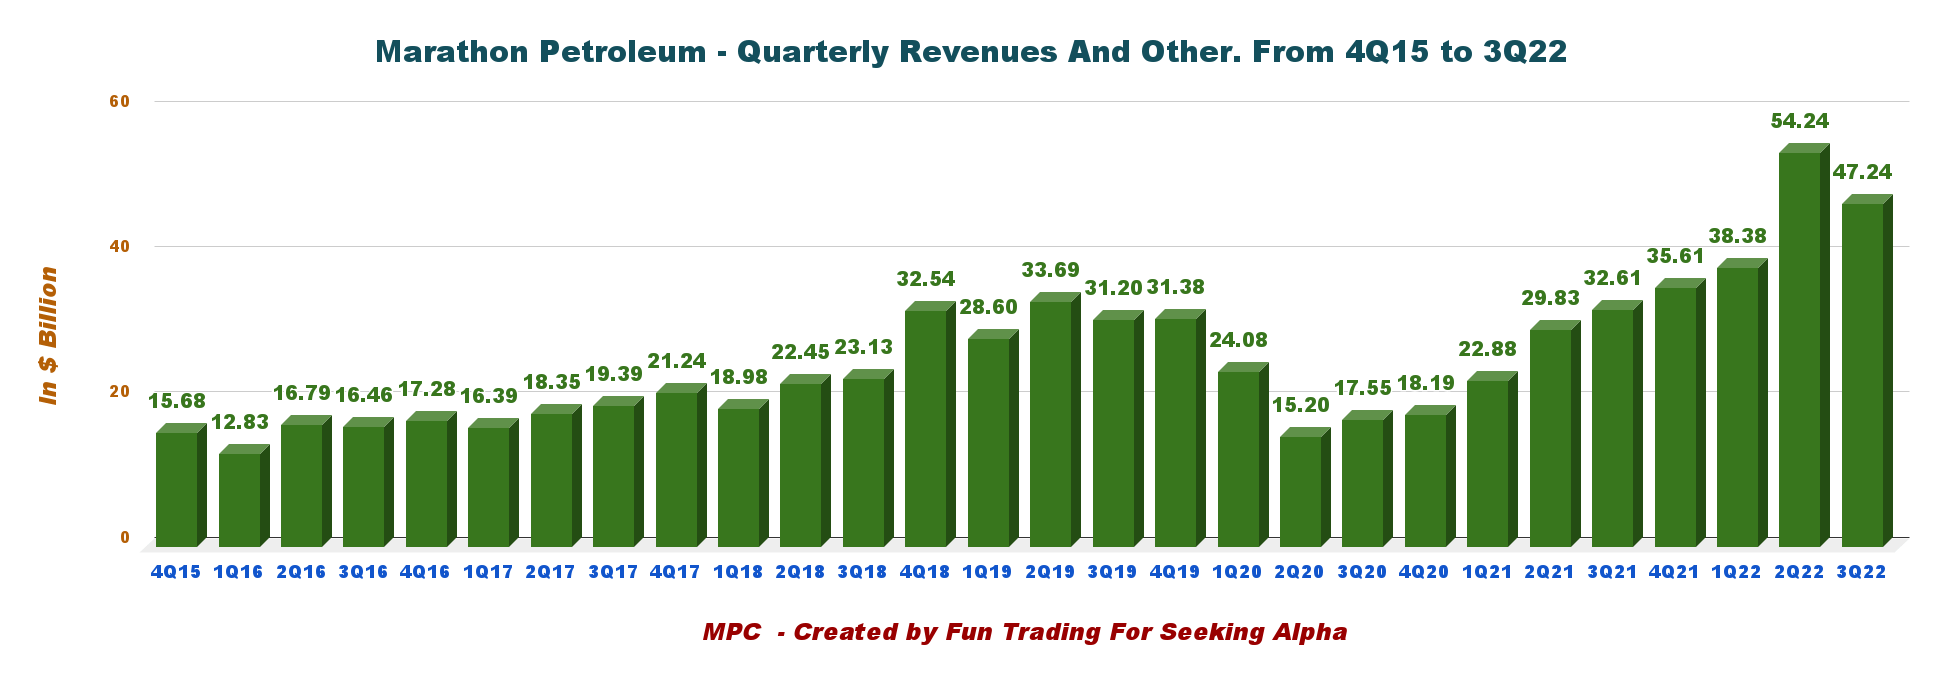
Note: Basic Revenues were $45,787 million.
Marathon Petroleum reported a total income of $47.24 billion in the third quarter of 2022, up 44.8% from the same quarter a year ago and down 12.9% sequentially. Net income was $4,477 million or $9.06 per diluted share compared to $694 million in 3Q21, and adjusted net income was $7.81 per share, beating analysts’ expectations.
The operating income from the Refining & Marketing and the Midstream units totaled $4,625 million and $1,176 million, respectively, exceeding expectations. It was another great quarter.
1. 1 – Refining & Marketing: The company reported an operating income of $4,625 million compared to $509 million in the same quarter a year ago. The significant improvement was due to higher year-over-year margins and throughputs. The refining margin was $30.21 per barrel in 3Q22 from $14.51 a year ago.
Throughput increased from 2,836 mbp/d in the year-ago quarter to 3,007 mbp/d. Capacity utilization during the quarter was up from last year’s 93% to 98%.
Below is the Refinery margins history:
MPC Quarterly refining margins history (Fun Trading)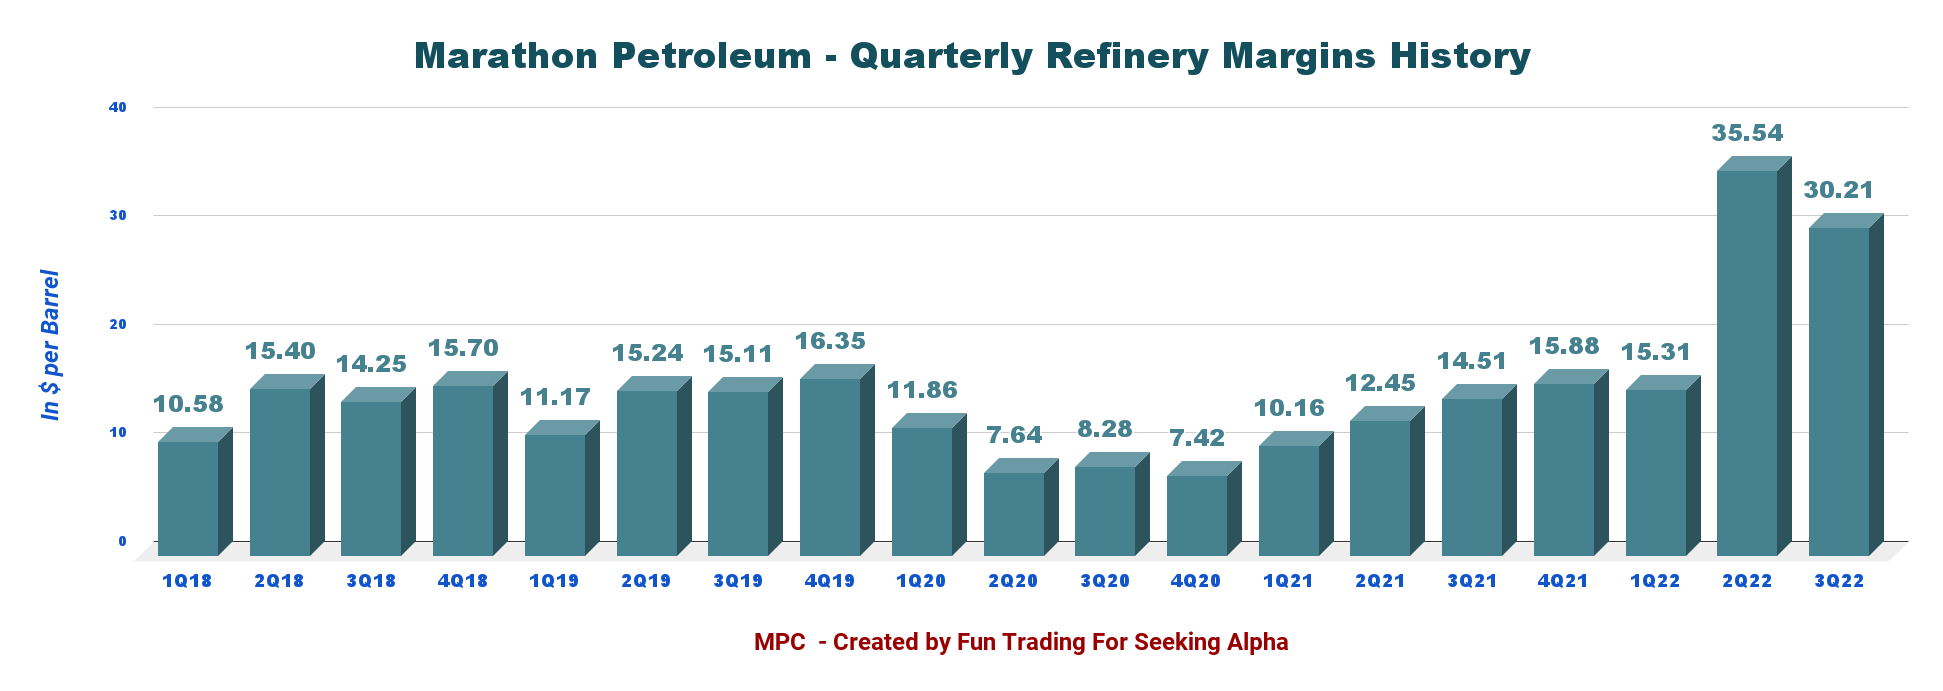
1.2 – Midstream:
Marathon Petroleum’s general and limited majority partners are MPLX (MPLX). Segment profitability was $1,176 million, up 12.9% from $1,042 in 3Q21. MPLX has largely underperformed MPC on a one-year basis. However, the company is now paying a higher dividend yield than MPC of 5.01%.
CFO Maryann Mannen said in the conference call:
Our Midstream segment demonstrated earnings growth with adjusted EBITDA up approximately 3% sequentially and up 9% year-over-year. Overall, we continue to focus on identifying and efficiently executing high-return projects to drive further growth for our midstream business.
The growth of MPLX’s earnings supported its decision to increase its quarterly distribution by 10% to $0.775 per share and MPC expects to receive $2 billion in cash from MPLX on an annual basis. MPLX remains a source of durable earnings in the MPC portfolio and as MPLX grows its free cash flow we believe it will have the capacity to return capital to its unitholders.(conference call).
2 – 4Q22 Outlook slightly weakening
MPC 4Q22 Outlook (MPC Presentation)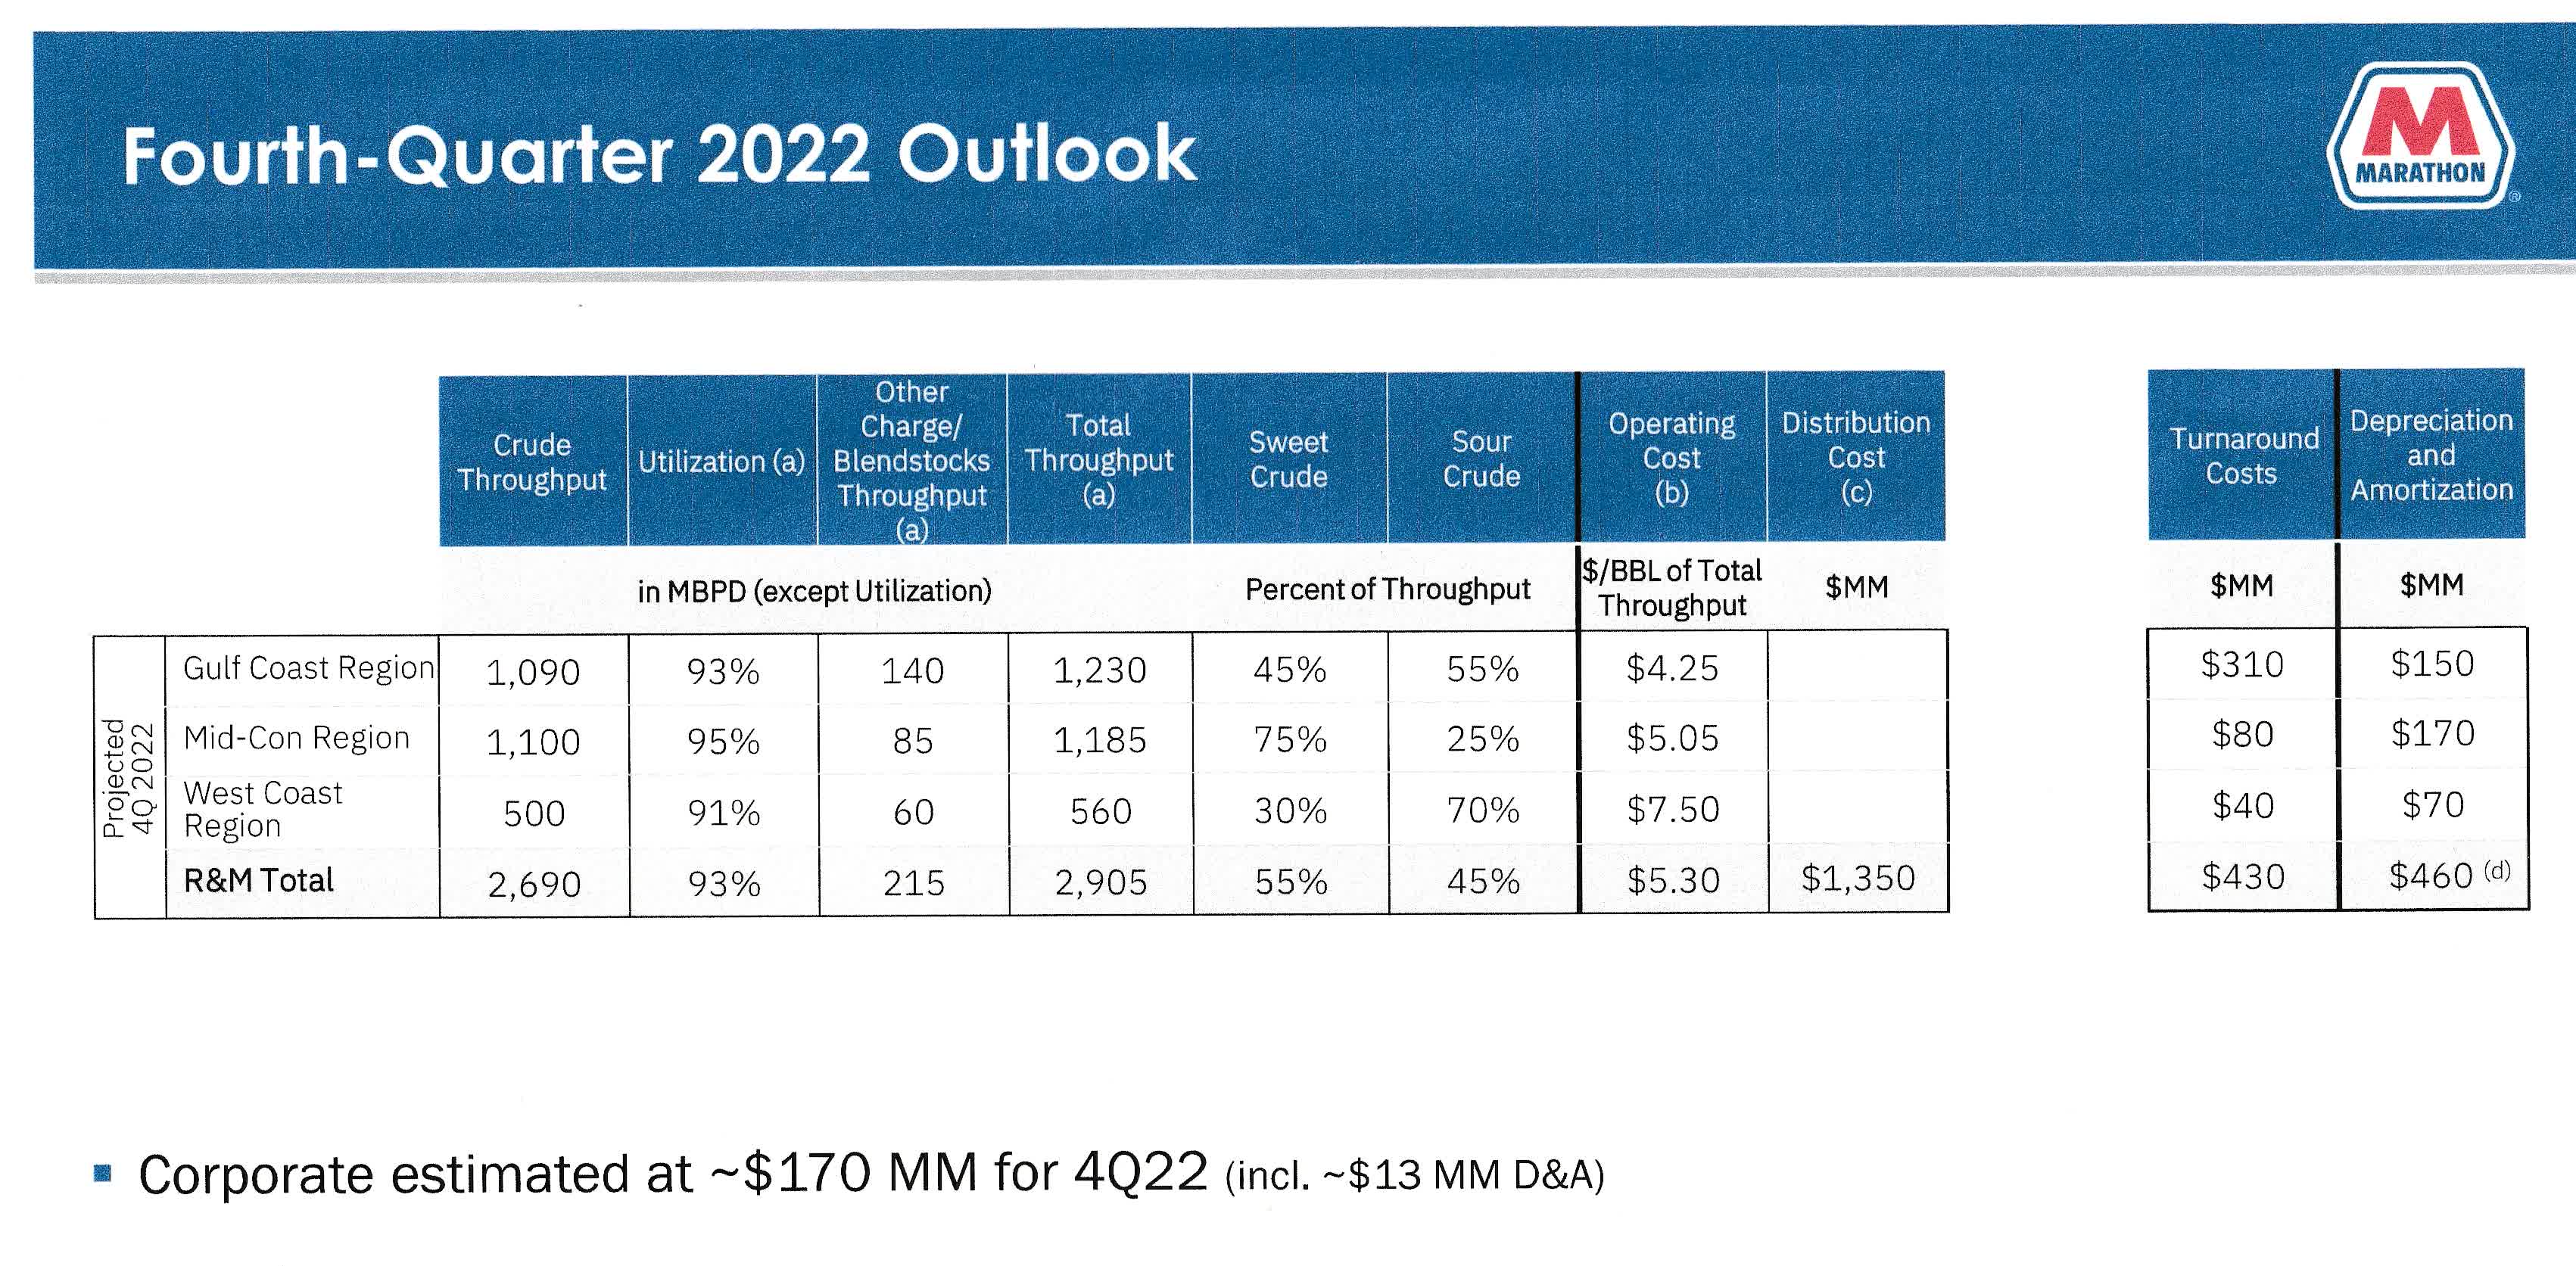
CFO Maryann Mannen said in the conference call:
We expect crude throughput volumes of roughly 2.7 million barrels per day, representing 93% utilization. Utilization is forecast to be lower than third quarter due to planned turnaround activity having a higher impact on crude units in the fourth quarter.
Planned turnaround expense is projected to be approximately $430 million in the fourth quarter with a significant level of activity in the Gulf Coast region. Turnaround activity is reflected in our fourth quarter throughput guidance.
We are expecting operating cost per barrel in the fourth quarter to be lower projected to be $5.30 per barrel for the quarter. This is primarily driven by expected lower natural gas and energy costs.
As a reminder, natural gas has historically represented approximately 15% of operating costs.
3 – Free cash flow was $1,813 million in 3Q22
MPC Quarterly Free cash flow history (Fun Trading)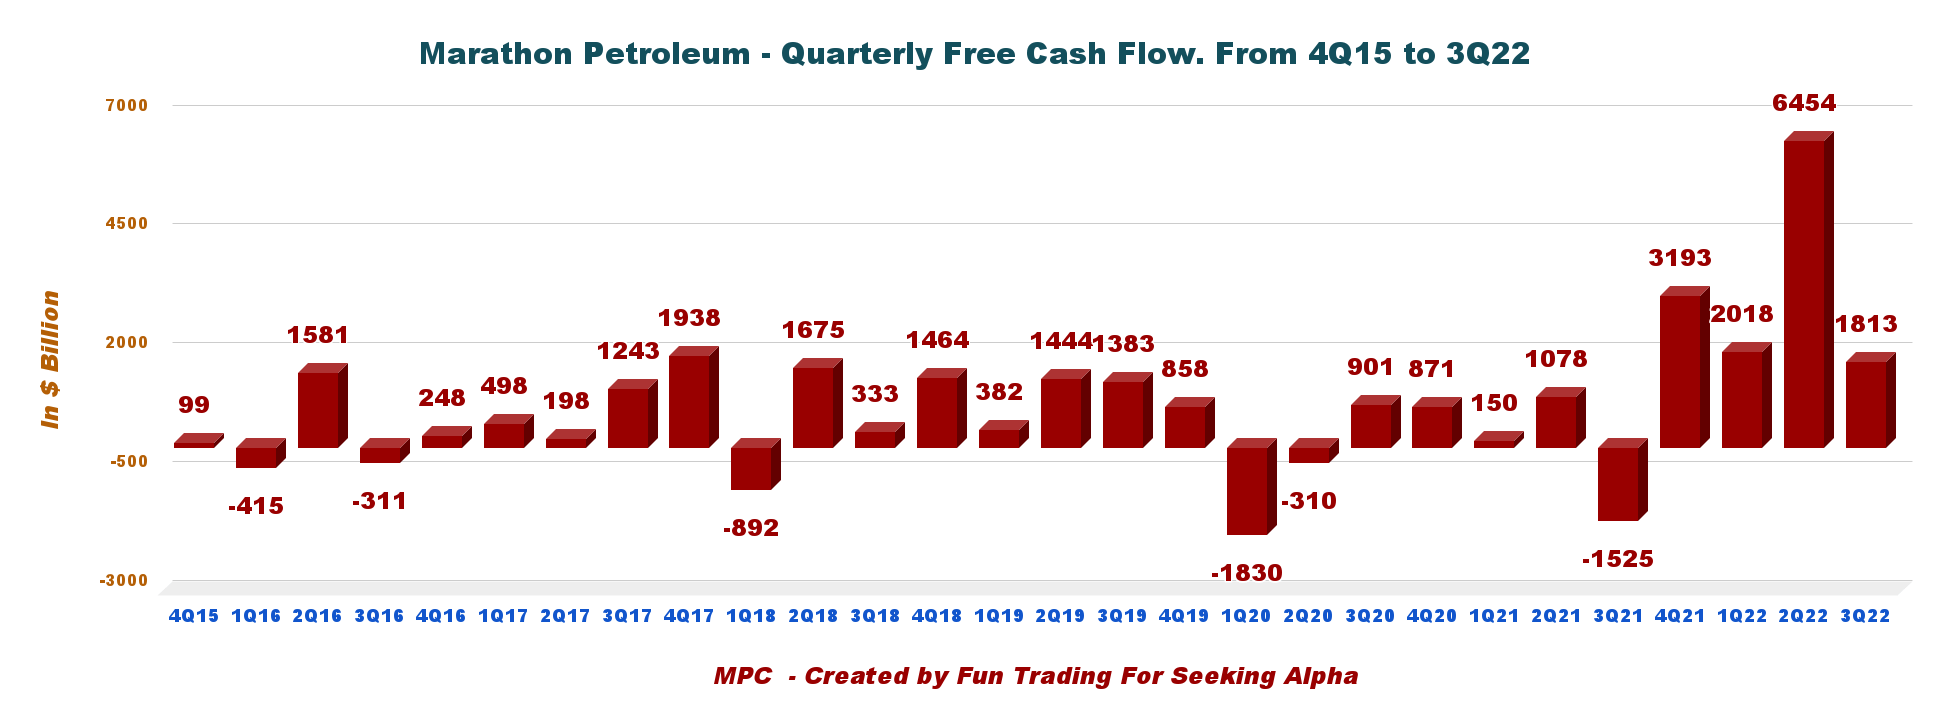
Note: Generic free cash flow is the cash from operations minus CapEx. The company has a different way of calculating it.
The trailing 12-month free cash flow was $13,478 million, with $1,813 million in 3Q22. The dividend payout ($3.00 per share) is $1.48 billion annually, which is covered by Free cash flow.
The company has increased the quarterly dividend this quarter to $0.75 per share. In October, the company completed its target to buy back $15 billion in common stocks at an average price of $78.
CFO Maryann Mannen said in the conference call:
We believe the quarterly increase to $0.75 per share we announced today is secured through cycles, competitive with peers and the broader market and leaves opportunity to potentially grow our dividend in the future. We anticipate this dividend will be supplemented with repurchases and we are committed to executing our capital allocation framework to deliver peer-leading total returns to shareholders.
Also, the company announced a separate and incremental $5 billion share repurchase authorization.
4 – The total debt is $26.7 billion (consolidated) in 3Q22
MPC Quarterly Cash versus debt history (Fun Trading)
Note: The graph above indicates the debt on a consolidated basis.
As shown below, the debt is $19.78 billion on a standalone basis, with a debt-to-capital ratio of 21% and 44% on a consolidated basis. Total cash is $11,135 million (MPC standalone cash was $11,014 million). MPLX’s debt is $6.7 billion.
On July 7, 2022, MPC entered a new five-year $5 billion revolving credit facility.
MPC Balance sheet (MPC Presentation)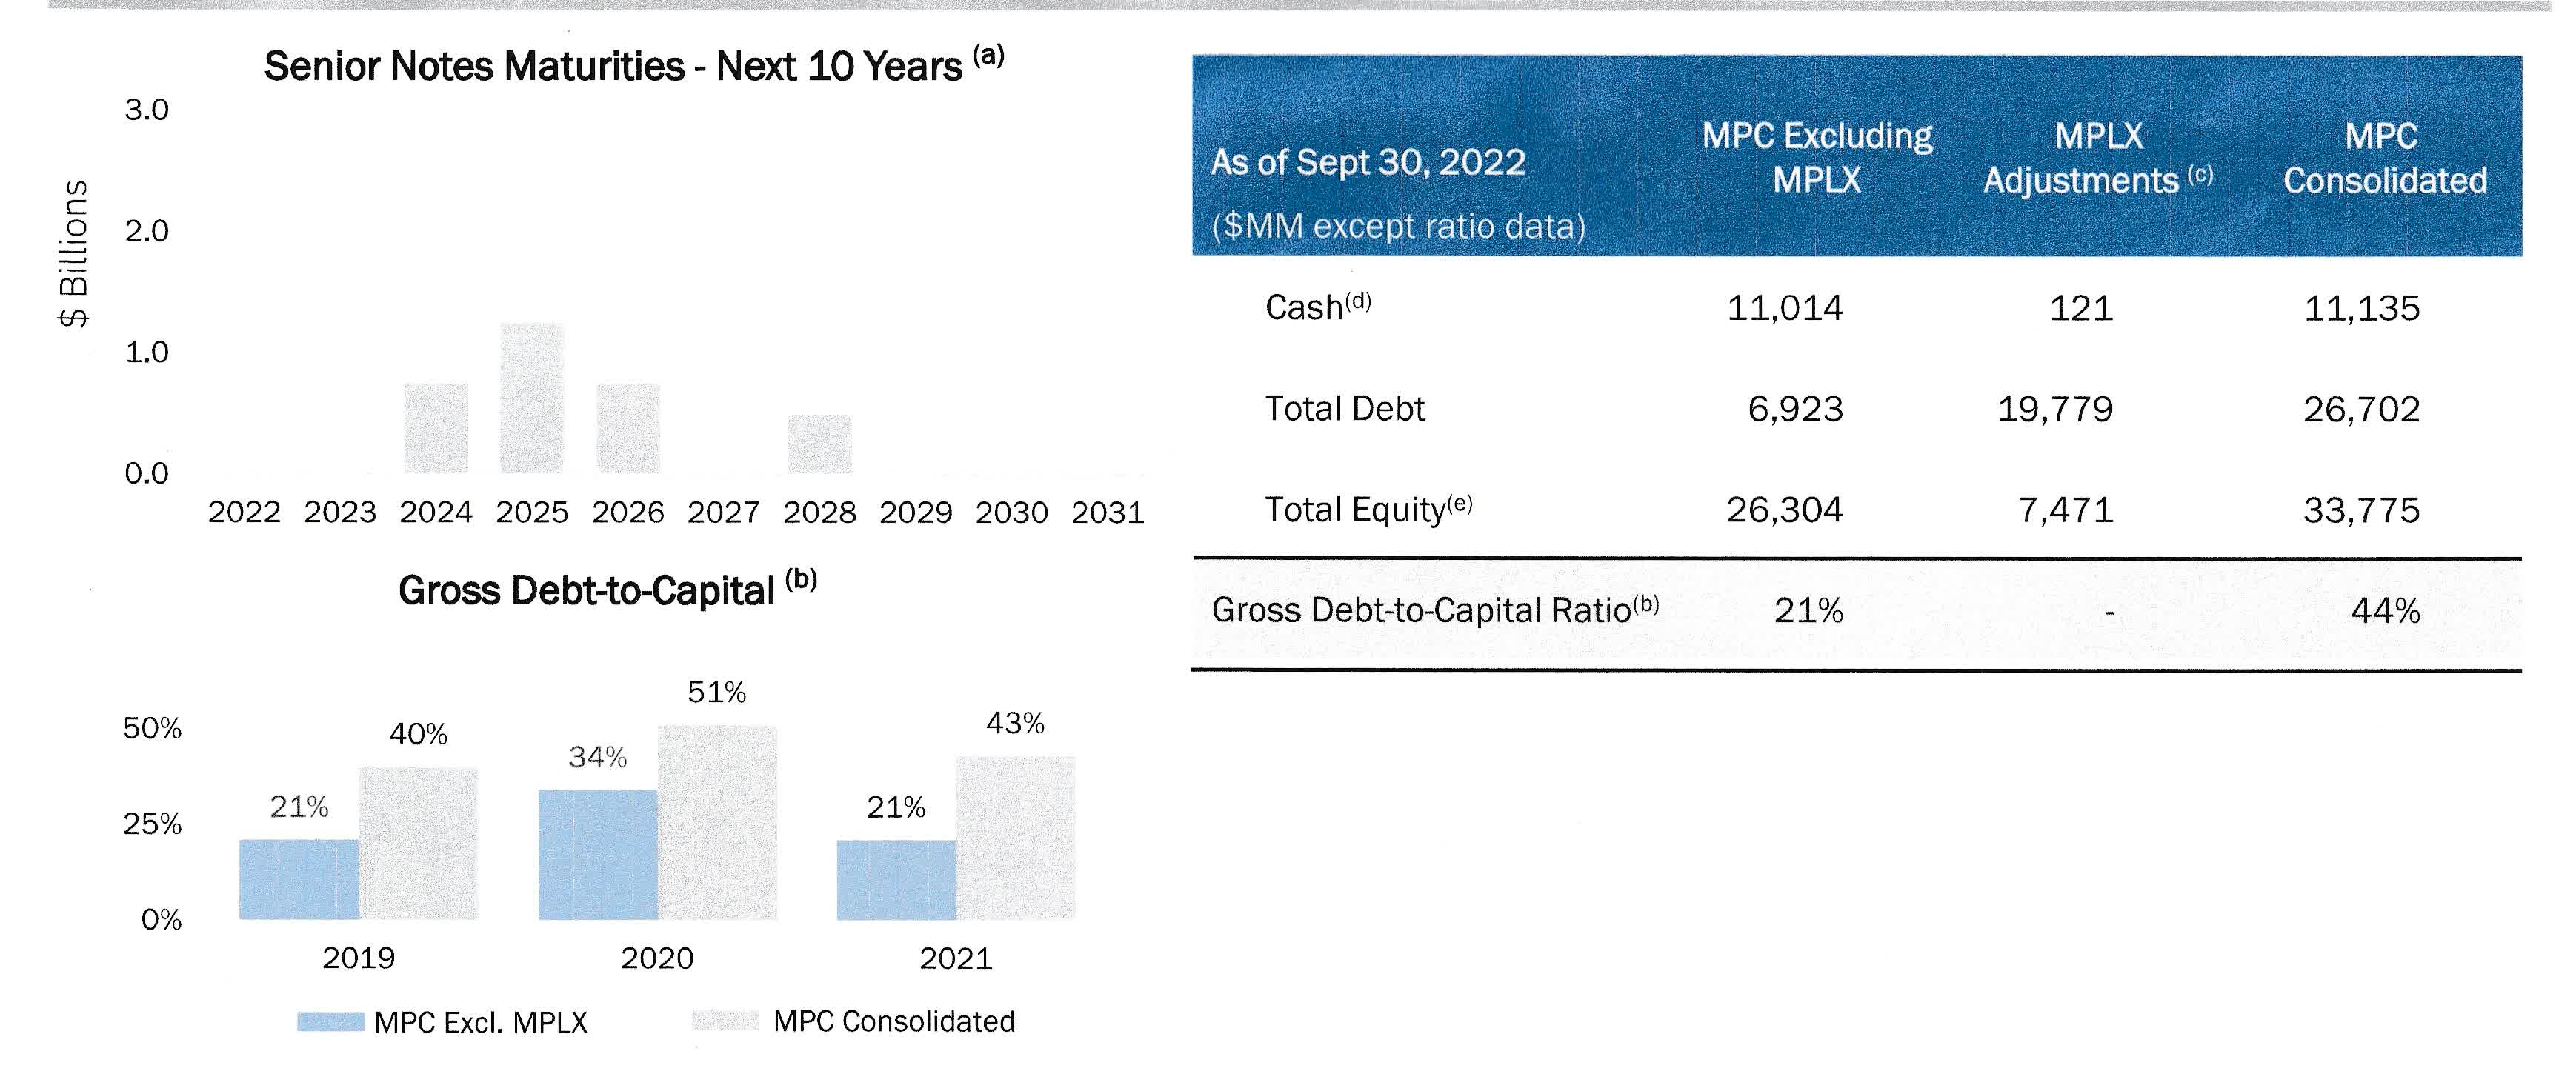
Technical Analysis (Short Term) and Commentary
MPC TA chart short-term (Fun Trading StockCharts)
Note: The chart is adjusted for the dividend.
MPC forms an ascending channel pattern with resistance at $127.7 and support at $120.4. Ascending channel patterns are generally short-term bullish, moving higher within an ascending canal, but these patterns often form within longer-term downtrends as continuation patterns. Thus, I am expecting a retracement soon. The RSI is 73 and signals an overbought situation.
The overall strategy that I suggest in my marketplace, “The Gold And Oil Corner,” is to keep a long-term position and use about 50% to trade LIFO (see note below) while waiting for a higher final price target for your core position between $130 and $135.
The trading strategy is to sell ~30% above $127 and another 20% above $130. I suggest waiting for a retracement between $110 and $102 to accumulate again, with potential lower support at $95.
Note: The LIFO method is prohibited under International Financial Reporting Standards (IFRS), though it is permitted in the United States to generally accepted accounting principles (GAAP). Therefore, only US traders can apply this method. Those who cannot trade LIFO can use an alternative by setting two different accounts for the same stocks, one for the long term and one for short-term trading.
Warning: The TA chart must be updated frequently to be relevant. It is what I am doing in my stock tracker. The chart above has a possible validity of about a week. Remember, the TA chart is a tool only to help you adopt the right strategy. It is not a way to foresee the future. No one and nothing can.
Author’s note: If you find value in this article and would like to encourage such continued efforts, please click the “Like” button below as a vote of support. Thanks.
Be the first to comment