

alvarez/E+ via Getty Images
The Industrial Select Sector SPDR ETF (NYSEARCA:XLI) is down 14%, including dividends, so far this year. That’s actually marginally better than the SPDR S&P 500 ETF (SPY).
ETF YTD Performance Heat Map: XLI Down, But Outperforming SPY in 2022
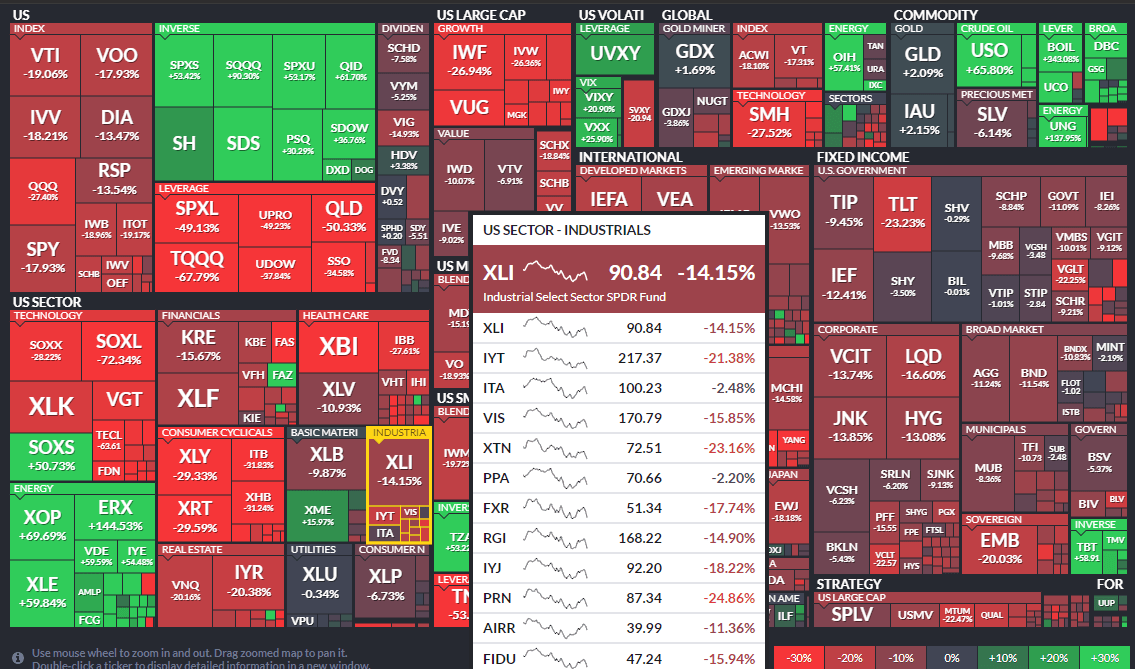
Finviz
It’s hard to group all “industrials” stocks together though. The sector is among the most diversified of all 11 S&P 500 groupings. Consider that within the space you’ll find machinery companies, aerospace & defense firms, integrated shipping stocks, staffing agencies, resource-driven farm and agricultural companies, and transports. That’s a lot going on.
And performance differences are evident in 2022. Industrials has hot industries like aerospace & defense as well as the food/agri companies. Weak industries are some of the more cyclical areas such as the big conglomerate industrial blue chips and many business services stocks that are techy in nature.
Industrials Sector Companies: Forward P/Es (Left), YTD Performances (Right)
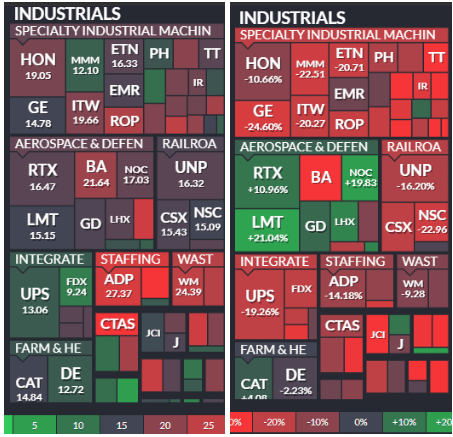
Finviz
The sector’s makeup is quite diverse. Raytheon (RTN) is the biggest holding, but there are many companies with similar weights in XLI, according to SSGA.
XLI Holdings
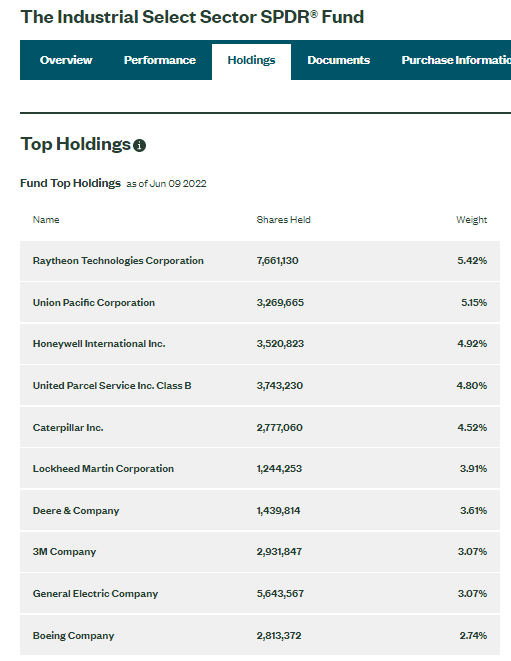
SSGA Funds
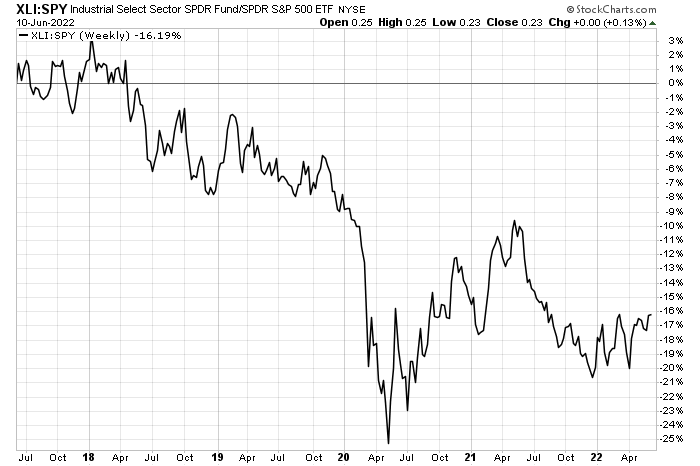
Overall, XLI’s negative alpha this year is nothing new. The sector has been in a relative downtrend off its early 2018 high. Perhaps a bottom was put in during Q2 2020, but the current consolidating, as seen in the weekly relative chart below, looks more like a continuation pattern to me. I’m inclined to lean bearish vs. the broad market.
XLI vs. SPY Relative Chart Since (5 Years, Weekly)
Stockcharts.com
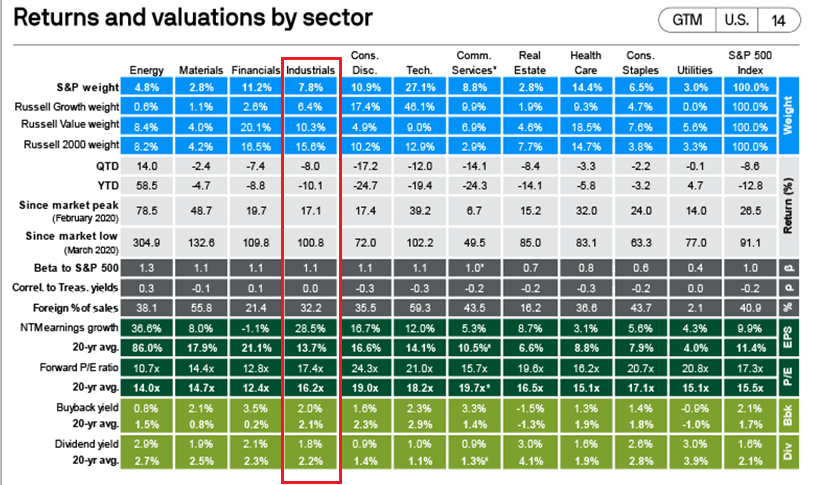
Digging into some sector metrics, you’ll find that XLI is 7.8% of SPY and has a value tilt, according to J.P. Morgan Asset Management. It’s a material chunk of the small-cap Russell 2000 index, however. It’s second only to the Energy sector (XLE) as far as earning growth expectations over the next 12 months. Hence, the forward P/E is 17.4x, but that is still slightly pricier than the sector’s 20yr average of 16.2x. Total shareholder yield (buyback yield plus dividend yield) is near the S&P 500 norm at 3.8%.
S&P 500 Sector Returns, Valuation, and Yields
J.P. Morgan Asset Management
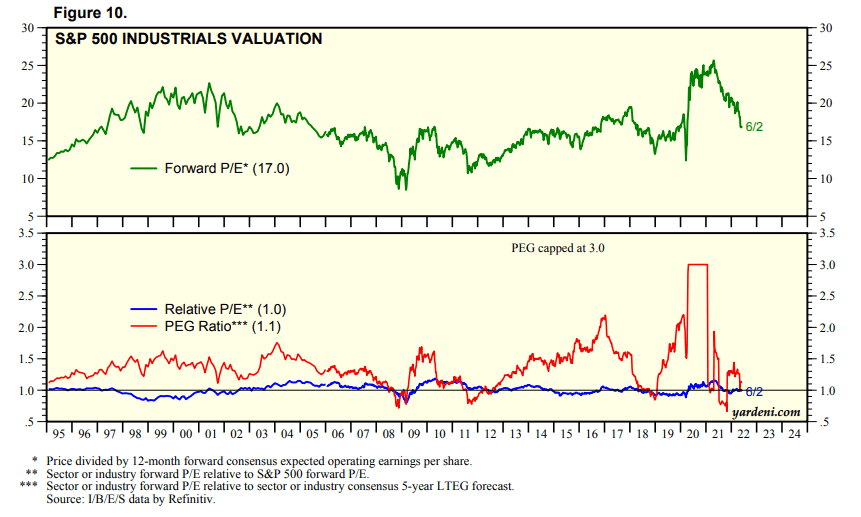
Industrials’ forward P/E ratio has dropped big since the peak several months ago, bringing valuations back to their long-term average. The PEG ratio looks quite cheap, though.
Industrials Sector Valuation History: Favorable PEG Ratio
Yardeni.com
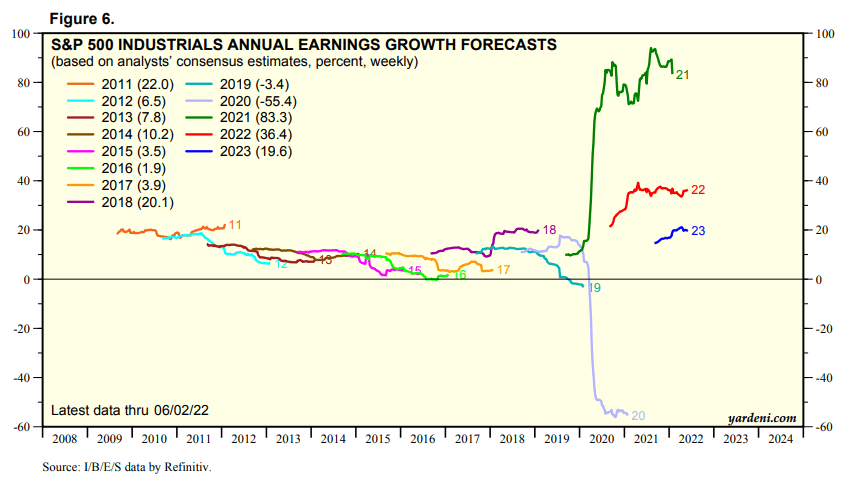
Homing in on the group’s valuation, this year’s EPS growth rate outlook has been steady since early 2021, currently at an extraordinarily strong +36.4%, according to data gathered by Ed Yardeni. Next year’s profit growth rate forecast has dipped after growing in late 2021 and earlier this year.
Industrials Sector Annual EPS Growth Forecast History
Yardeni.com
The Technical Take
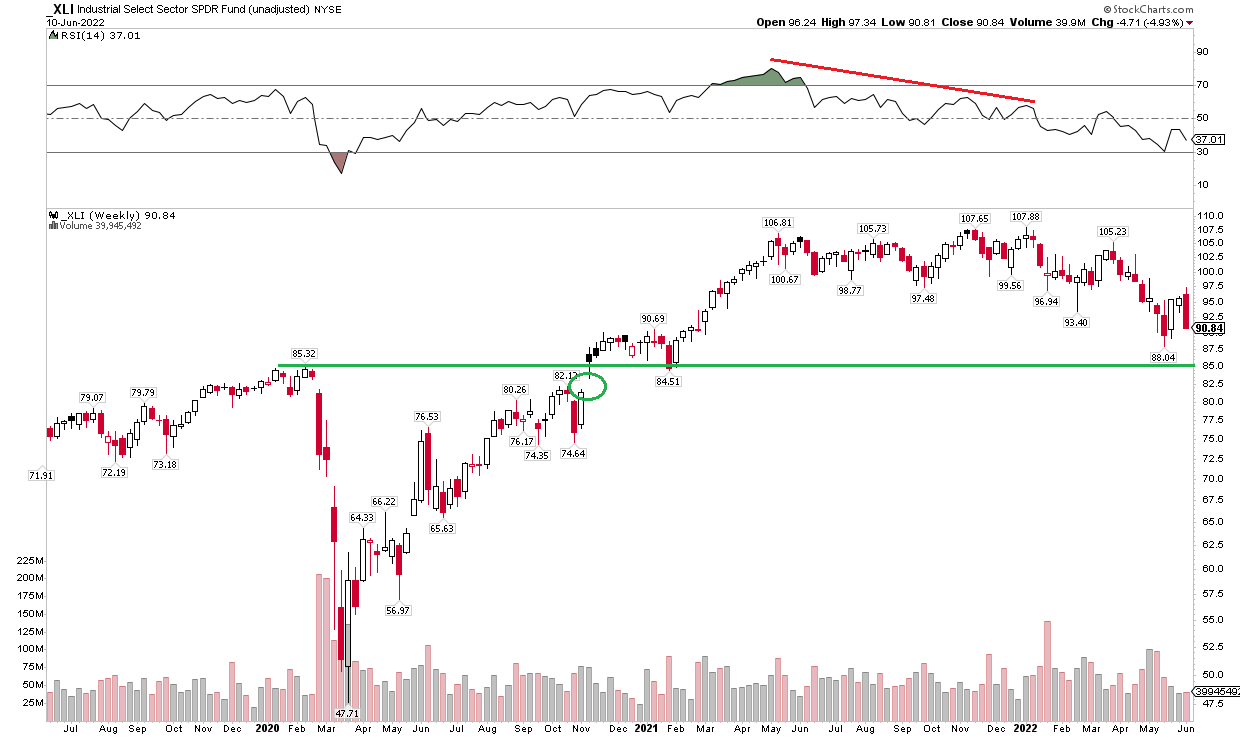
XLI eyes key support at the pre-pandemic high and the successful retest point in early 2021 at $85. It needs to hold that, but there is a gap in the low $80s that could also get tagged before an upside reversal happens. Looking back, there was a significant drop in momentum as shares consolidated last year. That resulted in a downtrend in 2022. It’s hard to be excited about the chart right now, but I’d be a buyer on a dip to the low-mid $80s.
XLI Weekly Chart: February 2020 Support & Gap In Play
Stockcharts.com
The Bottom Line
Industrials is a complex sector. There are diverse industries that make issuing a single call though. Nevertheless, I’m a seller right now but would buy the dip to the low to mid-$80s based on the charts. Moreover, the PEG ratio looks strong here given big EPS growth expected (and yes, we don’t know what the “E” will be).
Be the first to comment