

AntonioSolano
Many investors seek to achieve diversification with a single instrument. When it comes to the US oil and gas sector, the Energy Select Sector SPDR ETF (NYSEARCA:XLE) and the iShares U.S. Energy ETF (NYSEARCA:IYE) offer exactly that. In this article, I’ll compare the two ETFs in order to assess which is the better instrument. Based on my analysis, XLE is the better ETF in virtually all examined criteria, and I see no point why someone will choose IYE if the decision is based on purely objective analysis.
A high level view
XLE is designed to track the Energy Select Sector Index, which includes the energy components of the S&P 500 (SP500) and is market cap weighted. At the same time, there’s a bit of a leeway as according to its prospectus management should invest at least 95% of its assets in the index.
On the other hand, IYE tracks the Russell 1000 Energy RIC 22.5/45 Capped Index. According to the fund’s prospectus:
The Underlying Index uses a capping methodology to constrain at quarterly rebalance: (i) the weights of any single issuer (as determined by Russell) to a maximum of 22.5%, and (ii) the aggregate weight of all issuers that individually exceed 4.5% of the index weight to a maximum of 45%.
Top 10 holdings (etfdb.com)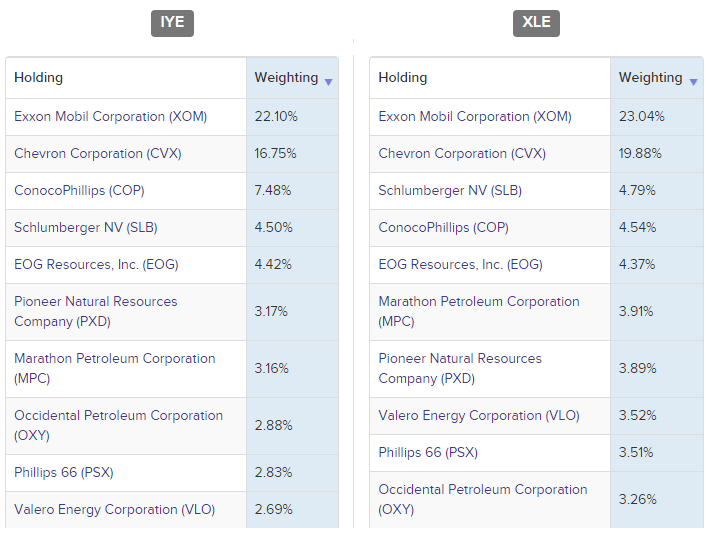
While IYE has some leeway as it should invest at least 80% of its assets in the index, the capping methodology creates some differences with XLE. As the US oil and gas sector is pretty concentrated, in order to fit into the 45% rule, IYE is less concentrated in the largest oil and gas companies and has more constituents. As of 6 January, IYE has 41 holdings, while XLE has 23. Still, I estimated the overlap between the two ETFs at 89.65%, which means that they’re direct alternatives of each other as the difference is quite small.
XLE and IYE sector breakdown (etfdb.com)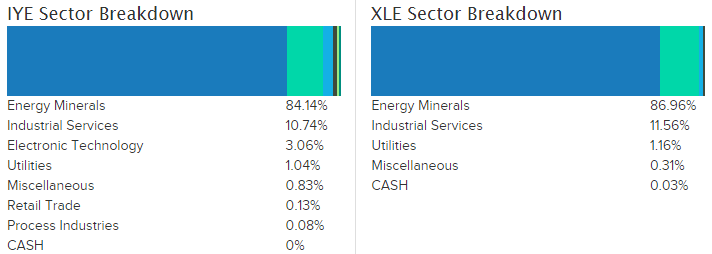
Looking at the main characteristics of the two ETFs, it appears that XLE is superior – it has an expense ratio of just 0.10%, while that of IYE is almost x4 at 0.39%. Also, XLE has a larger AUM and is more liquid. Although both funds have sufficient liquidity, especially for the individual investor.
XLE and IYE key highlights (etfdb.com)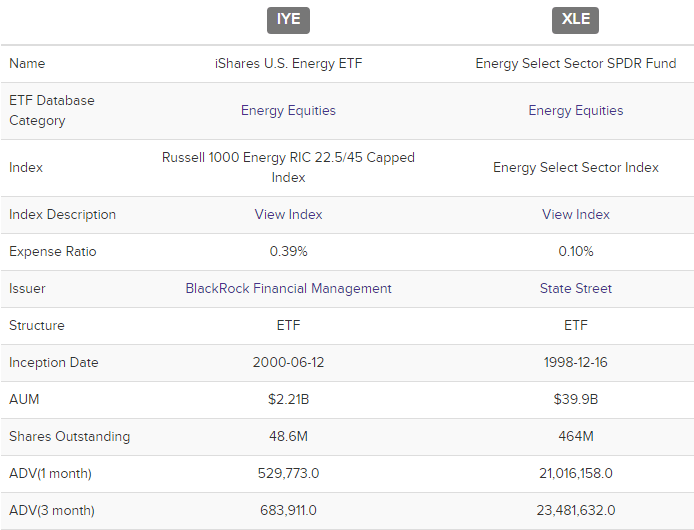
It has to be mentioned that while both ETFs are dividend paying with quarterly distributions, XLE has a higher TTM yield of 3.69% compared to 3.39% for the IYE.
Performance comparison
Still, the most important thing when it comes to investing is the return. A higher return may justify inferior characteristics like a higher expense ratio. However, in the case of XLE and IYE, the clear winner is XLE as it has been outperforming its counterpart routinely throughout the years.
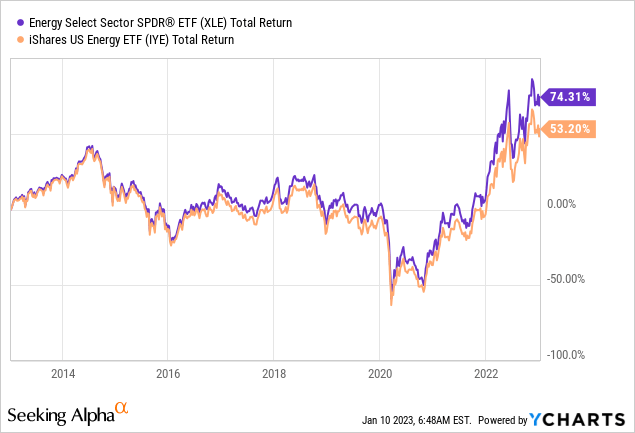
Investing in XLE would’ve returned 21% more on a cumulative basis for the last 10 years. In order to get a better understanding of the risk characteristics of that return, I also examined the Sharpe ratios of both ETFs.
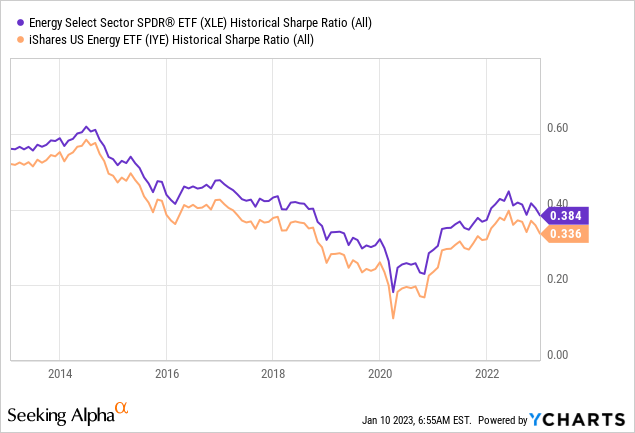
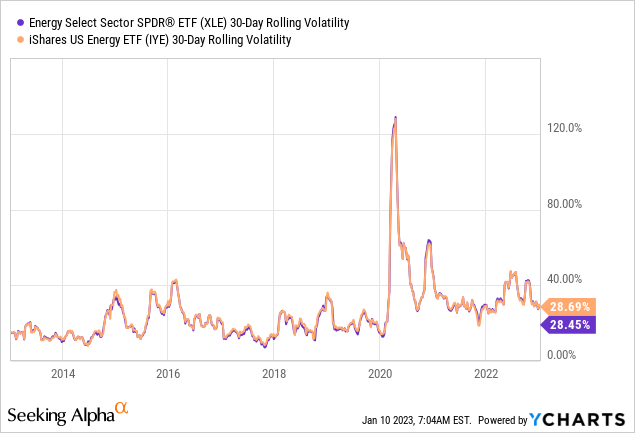
The data shows that XLE consistently maintained higher Sharpe ratio compared to IYE, implying better risk-adjusted return as well. Unsurprisingly, the volatility of XLE is also lower. This could be attributed to a slightly bigger tilt to large cap stocks in XLE, while IYE has a little more exposure to smaller cap companies, which are generally more volatile.
Takeaway
All examined performance characteristics demonstrated the superiority of XLE to IYE. Adding that to a much lower expense ratio, higher liquidity and dividend yield really highlights the clear winner of the comparison. If an investor seeks exposure to the US oil and gas sector in a single instrument, XLE is definitely the way to go. The only scenario where things could shift would be if the large cap companies become target of politicians with for example additional taxes, regulation and so on. In that case, the slightly higher exposure to lower cap companies of IYE could prove to be an advantage. But such a scenario doesn’t look very likely for the foreseeable future.
Be the first to comment