

gremlin/E+ via Getty Images
The SPDR S&P Aerospace & Defense ETF (NYSEARCA:XAR) is an exchange-traded fund with the aim of tracking the performance of the S&P Aerospace & Defense Select Industry Index, XAR’s benchmark index. XAR invests in aerospace and defense stocks, with assets under management of $1.2 billion as of June 16, 2022, and a gross expense ratio of 0.35%. Net fund flows have been positive over the past year or so, at circa $242 million.
ETF Database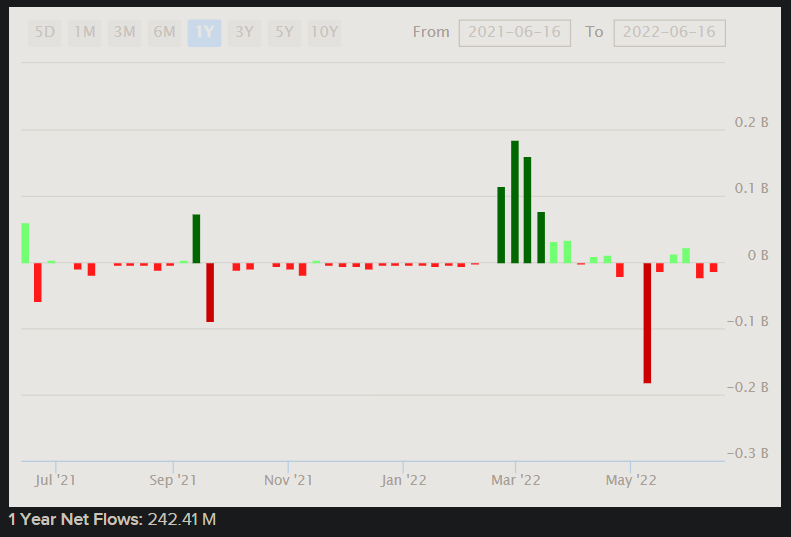
As shown in the chart above, much of these positive inflows occurred after the escalation of the Russo-Ukrainian War in Q1 2022, however sentiment has since soured, and fund flows have retraced into a negative position more recently. This is characteristic of reactive “hot money” in search of opportunistic returns, while the long-term trajectory of the XAR portfolio was probably not going to change materially as a result of European regional conflict.
Just as broader indices have fallen, XAR has fallen this year. The fund’s share price is currently sitting below its 200-week moving average, as shown below, which has in the past been an infrequent state for XAR and evidential of poor risk sentiment.
TradingView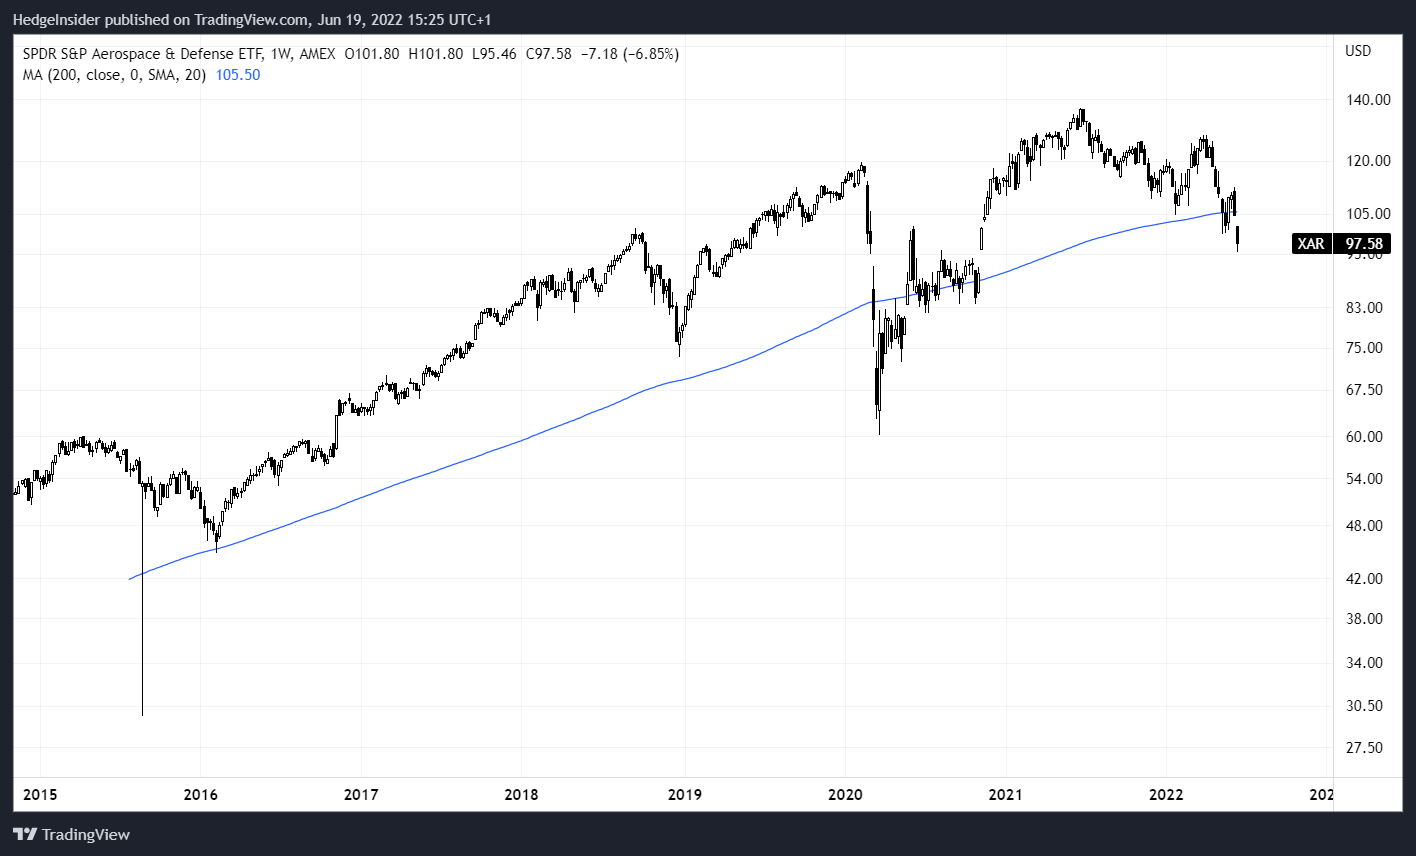
Of course, XAR fell substantially below the 200-week moving average during COVID (in the year 2020), but the fund was able to eventually recover. That shows that XAR could easily fall much further from present prices, but that ultimately one would expect some kind of recovery, provided that the fundamental valuation is not overly optimistic.
Morningstar currently have an average earnings growth rate projection of 14.73% over the next three to five years for XAR’s portfolio. This might be optimistic, but in any case, it suggests analysts still believe in XAR’s forward capacity to generate inflation-adjusted earnings growth. On the other hand, there is a much lower estimate provided by SSGA (4.39%).
A recent factsheet from S&P Dow Jones Indices for XAR’s benchmark index reveals that, as of May 31, 2022, the trailing price/earnings ratio of the fund was 114.18x, which is astronomically high, presumably due to a low overall denominator (earnings base). The forward price/earnings ratio is stated as 52.23x, which is still indicative of a low earnings base, but a significant improvement on the trailing figure. These numbers are unadjusted and therefore preferable for determining fair value in my opinion, however Morningstar offers an adjusted and therefore more forgiving forward price/earnings ratio of 22x. The benchmark index price/book ratio as of May month-end was 3.37x, with a trailing dividend yield of 0.71%.
SSGA offer similar data and is also more favorable: a forward price/earnings ratio of 20.46x, and a price/book ratio of 2.54x, with a lower “fund distribution yield” of 0.47% (although the index dividend yield is quoted at 0.83%, as of June 16, 2022).
Often large, established businesses in aerospace and defense are priced in accord with their dividend yields, which is why you can often see large valuations on the basis of these companies to operate somewhat like bonds. XAR is concentrated just like its benchmark; it had 33 holdings as of June 16, 2022, including the top 10 illustrated below.
SSGA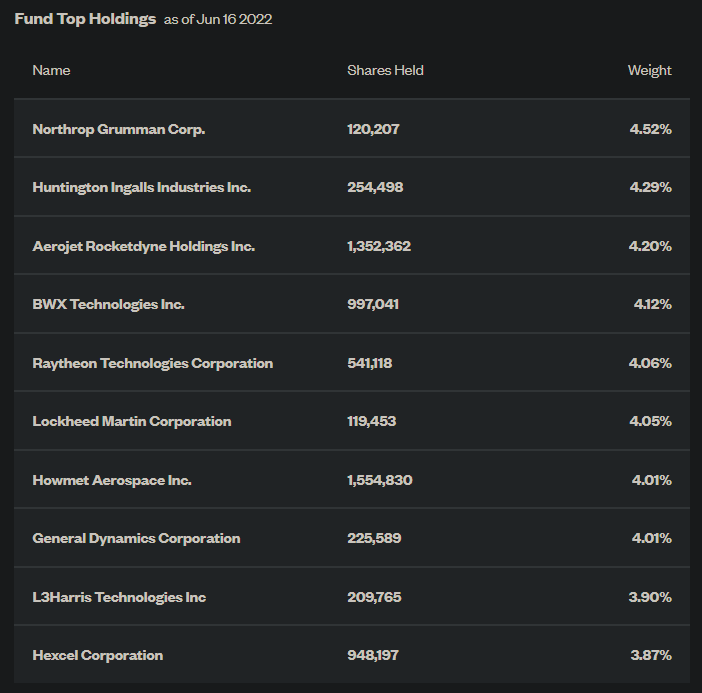
In 33 holdings, a base rate might be circa 3% per holding, so given that the largest holding is “only” 4.52% as of June 16, 2022, you could argue XAR is quite safely diversified at least across the U.S. aerospace and defense sector. XAR is a fairly well-structured, diversified macro bet on this particular U.S. sector.
Whether it is a good bet financially, this would depend on how optimistic you are about earnings growth. Given the noise likely embedded in the benchmark index values, I am tempted to focus on SSGA’s numbers for the sake of gauging XAR. I would still however keep those less favorable figures from S&P Dow Jones Indices in mind. The data, largely taken from SSGA for XAR, tells me that there is a likely forward return on equity of about 12.4%, and a distribution rate of earnings into dividends of just under 20% (we could assume about 20%).
I am conscious of SSGA’s forward one-year earnings growth estimate of 11.63% (implied by the trailing and forward price/earnings ratios given), and yet its three- to five-year average earnings growth estimate of about 4-5%. Given the latter, you would need to anticipate a fairly sharp slowdown in earnings growth, or even a period of negative growth, to balance these figures. Having said that, perhaps the average earnings growth figure is conservative, and Morningstar’s figure optimistic. Somewhere in the middle might be appropriate.
In this case, I am going to base earnings growth on return on equity; from a starting portfolio return on equity of 12.41%, I will assume this trickles down to 9% by year six. A return on equity of 9% is about the minimum I would expect large corporates in this sector to require as a return; any less than that would probably require larger dividends and/or buybacks, since the cost of equity might be about 9% or so for these businesses. (For example, an equity risk premium of 5.5%, adjusted upward for XAR’s beta of 1.21x, plus the risk-free rate in the U.S. 10-year yield of circa 3.25%, would take you to almost 10% already.)
In this case, XAR offers an indicative underlying IRR of about 7.2%, which would imply an equity risk premium of less than 4%. Assuming no buybacks, the return would be closer to 3.3%, leaving almost no room for an equity risk premium.
Author’s Calculations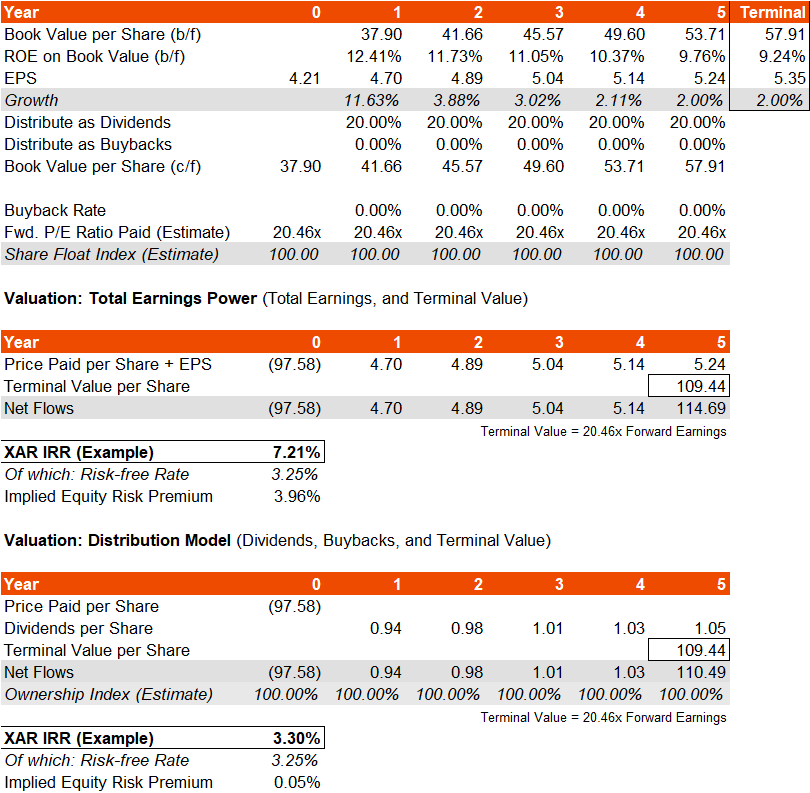
This is based on a declining return on equity with a floor of about 2% earnings growth in line with what I would imagine is a minimum for nominal inflation (i.e., we assume that XAR will never dip into negative real earnings growth). Adding in a buybacks assumption would only modestly affect the model; even with a scaling buyback program up to 50% of earnings in the terminal year, your IRR would still only be 4-7%.
These assumptions also include a constant forward price/earnings multiple of 20.46x (likely an adjusted figure, as discussed earlier). That in itself implies perpetual earnings growth of between 2.56% and 4.41%, depending on the equity risk premium used and using a risk-free rate of 3.25%. With long-term inflation expectations unlikely to breach 2-3% into perpetuity, XAR looks like it is priced fairly optimistically. And the dividend yield is not even high, which leads me to believe that XAR is still not inexpensive, even with recent share price declines.
On an intrinsic value basis, the XAR portfolio is not attractive to me, and I cannot perceive significant risk premiums embedded in the price. It seems to me that investors are not going to be able to “collect” much of an equity risk premium, and even higher risk-free rates would erode this potential even further. I would be unsurprised to see XAR under-perform the major U.S. equity indices (such as the S&P 500), and I would be also unsurprised to see negative or near-flat returns over the next year or so. Although increased regional conflicts might help to support the price/demand for XAR shares, I would also comment that any resolution or de-escalation of the Russo-Ukrainian War is likely to push XAR lower still.
Be the first to comment