

Khanchit Khirisutchalual
This dividend ETF article series aims at evaluating products regarding the relative past performance of their strategies and quality metrics of their current portfolios. Holdings and their weights change over time: reviews are updated when necessary.
DTH strategy and portfolio
The WisdomTree International High Dividend Fund (NYSEARCA:DTH) has been tracking the WisdomTree International High Dividend Index since 06/16/2006. It has 406 holdings (405 stocks and another WisdomTree ETF), a distribution yield of 5.41% and a total expense ratio of 0.58%. It pays quarterly distributions.
As described by WisdomTree, to be eligible in the index companies must pay regular cash dividends, be incorporated in Japan, 15 European countries, Australia, Israel, Hong Kong or Singapore, have a market capitalization of at least $200 million and an average daily dollar volume of at least $200,000. The top 5% ranked by dividend yield and the bottom half of a risk ranking based on momentum and quality metrics are excluded.
Then, companies ranking in the top 30% by highest dividend yield are selected for inclusion. They are excluded when they fall out of the top 35% by dividend yield. Their weights are adjusted based on dividends. The index is reconstituted once a year. Components are mostly large and mega-cap companies (80.8% of asset value).
The heaviest countries in the fund’s portfolio are Japan (20% of asset value), the U.K. (16.1%) and Australia (15.8%). Other countries weigh less than 8% individually and 48% together. The next chart includes all countries with a weight over 1%, which represent 96.7% of the portfolio.
DTH countries (Chart: author with WisdomTree data)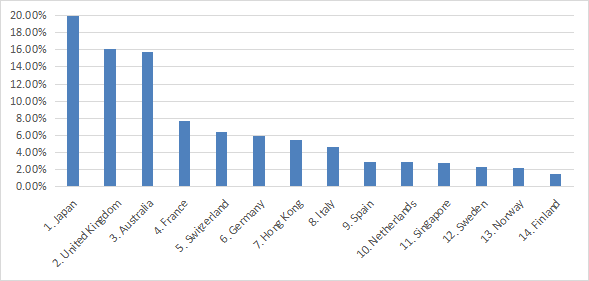
The three heaviest sectors are financials (24% of asset value), materials (16.5%) and communication (13.2%). Other sectors are below 10%.
DTH sectors (Chart: author with WisdomTree data)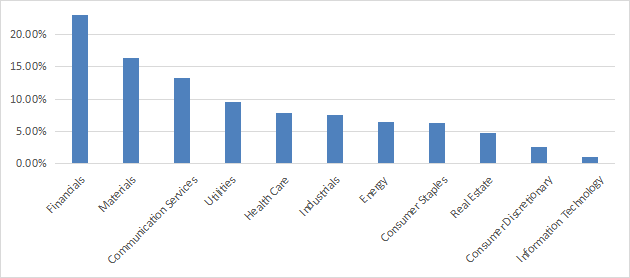
DTH looks much cheaper than the U.S. index S&P 500, as reported in the table below. However, keep in mind these metrics are skewed by the heavy weight of financials, whose ratios are naturally lower, and less reliable than in other sectors.
|
DTH |
SPY |
|
|
P/E TTM |
8.59 |
19.63 |
|
Price/book |
1.16 |
3.72 |
|
Price/sales |
0.86 |
2.4 |
|
Price/cash flow |
5.55 |
14.98 |
Data: Fidelity
The top 10 holdings (next table), represent 23.7% of asset value. Exposure to BHP Group is significant: over 5%. Risks related to other companies are limited. For convenience, U.S. tickers are listed below, whereas the fund holds stocks in primary listing exchanges.
|
US Ticker |
Name |
Primary Ticker |
Weight |
Sector |
EPS growth %TTM |
P/E TTM |
P/E fwd |
Yield% |
|
BHP Group Ltd. |
BHP AU |
5.63% |
MATERIALS |
N/A |
5.54 |
8.12 |
12.99 |
|
|
Rio Tinto |
RIO LN |
3.01% |
MATERIALS |
-4.77 |
5.02 |
5.95 |
13.55 |
|
|
Novartis AG |
NOVN SW |
2.98% |
HEALTHCARE |
158.82 |
7.39 |
12.53 |
4.37 |
|
|
Nippon Telegraph & Telephone Corp. |
9432 JT |
2.29% |
COMMUNICATION |
15.02 |
9.35 |
10.86 |
3.53 |
|
|
SoftBank Group Corp. |
9434 JP |
1.73% |
COMMUNICATION |
-220.77 |
N/A |
13.13 |
1.05 |
|
|
Unilever PLC |
ULVR LN |
1.73% |
CONS. STAPLES |
3.55 |
17.14 |
17.60 |
4.28 |
|
|
BP PLC |
BP/ LN |
1.72% |
ENERGY |
-234.42 |
N/A |
3.42 |
4.70 |
|
|
Fortescue Metals Group Ltd. |
FMG AU |
1.67% |
MATERIALS |
-38.26 |
5.34 |
N/A |
13.18 |
|
|
Sanofi SA |
SAN FP |
1.50% |
HEALTHCARE |
7.92 |
12.72 |
9.43 |
4.59 |
|
|
Commonwealth Bank of Australia |
CBA AU |
1.46% |
FINANCIAL |
5.45 |
12.86 |
N/A |
4.77 |
Fundamental data: Portfolio123
Past performance
The next table compares DTH performance since January 2008 with the First Trust Dow Jones Global Select Dividend ETF (FGD), reviewed here last year, which has a higher yield (7.35%) and includes U.S. based companies.
|
Since 1/2008 |
Total Return |
Annual.Return |
Drawdown |
Sharpe |
Volatility |
|
DTH |
-7.67% |
-0.54% |
-61.72% |
0.09 |
19.40% |
|
FGD |
28.27% |
1.70% |
-66.23% |
0.17 |
21.29% |
Data: Portfolio123
With a loss of -7.67% in 14 years (dividends reinvested), DTH has significantly underperformed FGD. As a reference, SPY has returned 226% in the same time (about 8.3% annualized).
In fact, DTH has suffered a capital loss of -39.40% since inception:
DTH share price (TradingView on Seeking Alpha)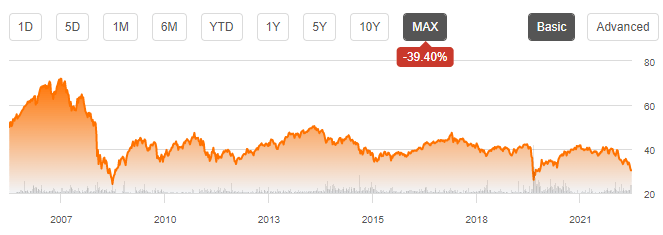
Including distributions, the total return since inception in June 2006 is about 28% (calculated with Portfolio123). It is 1.5% annualized. The average annual inflation rate since 2006 has been over 2%, so the inflation-adjusted total return since inception is negative.
The only positive point is that DTH has been a bit more resilient than two competitors in 2022 to date: FGD and the Schwab International Dividend Equity ETF (SCHY).
DTH vs. SCHY, FGD (Portfolio123)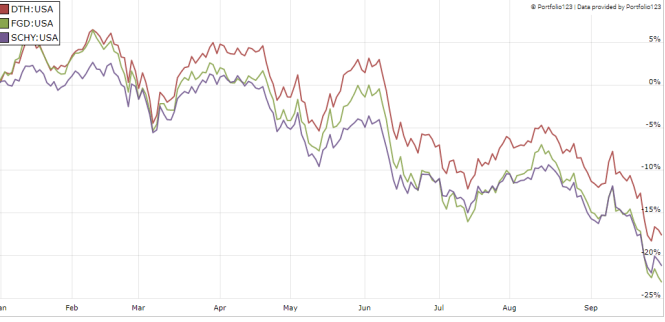
Takeaway
DTH has a portfolio of over 400 high-yield stocks from developed countries. About 52% of asset value is concentrated in three countries (Japan, U.K., Australia) and 54% is in three sectors (financials, materials, communication). Capital loss since inception has resulted in a negative inflation-adjusted total return. DTH may be useful for swing trading or tactical allocation strategies, but it doesn’t look a good choice for a sustainable retirement plan. This issue is not specific to DTH: many high-yield instruments have been suffering significant capital decay and/or income stream decay. For transparency, a dividend-oriented part of my equity investments is split between a passive ETF allocation and my actively managed Stability portfolio (14 stocks), disclosed and updated in Quantitative Risk & Value.
Be the first to comment