

Cloud transformation TU IS
Introduction
The world is rapidly adopting technology, and in the past decade the technology sector has become the largest sector in the S&P 500 Index (SP500) with a 26.3% weight. Cloud computing businesses have seduced investors worldwide with their very attractive – more than 50% CAGR – growth tractions, high gross margins and massive operating leverage.
But everything has a price. And the hawkish interest rate policy outlook has not boded well for the stock prices of these fundamentally attractive businesses. In this article, I discuss my stance on stocks exposed to the cloud computing theme:
WCLD; A Way to Play Cloud Transition Trends
The WisdomTree Cloud Computing EFT (NASDAQ:WCLD) aims to give exposure to the BVP Nasdaq Emerging Cloud Index. Here’s the composition of WCLD:
WCLD ETF Composition
WCLD ETF Top 5 Holdings (WCLD ETF Website, Author’s Analysis)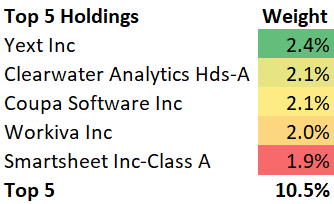
Yext, Inc (YEXT), Clearwater Analytics (CWAN), Workiva (WK), Coupa Software Inc (COUP) and Smartsheet (SMAR) make up the top 5 holdings.
Altogether, the top 5 holdings make up slightly above 10% of the overall index, which implies that the exchange-traded fund (“ETF”) is very much diversified among the 75 different holdings. Moreover, the top 5 holdings are rather equally weighted, with a standard deviation in their weights of only 0.2%, suggesting balanced exposures.
Key Fundamental Drivers of WCLD
In the current environment, robust corporate earnings is the most important driver for cloud computing firms. Despite the willingness to adopt the latest technology to gain a competitive edge in the increasingly digital world, enterprises will still cut back, re-prioritize or delay their spending decisions in a recessionary environment. This may reduce growth prospects of cloud computing companies.
Reduced growth prospects for high-growth enterprises combined with a higher opportunity cost of investable capital, as measured by higher interest rates, are a major headwind for WCLD. I have discussed my broader outlook on growth stocks in my coverage of IVW here, IWY here, and IWO here.
That said, there is a partial mitigating factor to depressed growth outlooks that I have been hearing amongst various industry participants. The cloud based delivery model, when delivered as a software as a service (SaaS), implies a run-the-business operational cost charge for customers as they pay at regular intervals such as once a month. Compared to traditional multi-year license models, this reduces the capital spending commitments that businesses need to make and gives them far greater flexibility to opt in and out of their technology spend programs.
The leading indicators to me are the Federal Reserve’s decisions as they impact interest rates and the bottom-line growth metrics of underlying cloud computing companies. I am not so worried about margins due to the immense operating leverage present in these business models.
My long-term outlook on the businesses in the WCLD ETF is still very upbeat, as cloud adoption is still quite underpenetrated. The industry is expected to grow at around 20% CAGR till 2030. However, I believe much of this secular growth has already been priced in the market. What matters incrementally is the overhang of the Fed’s hawkish stance in December 2022. And that is why I am currently neutral in my fundamental or tactical view of WCLD.
To complement that fundamentals based view, here’s what my price, volume, time based read looks:
If this is your first time reading a Hunting Alpha article using Technical Analysis, you may want to read this post, which explains how and why I read the charts the way I do, utilizing principles of Flow, Location and Trap.
Read of Relative Money Flow
WCLD vs SPX500 Technical Analysis (TradingView, Author’s Analysis)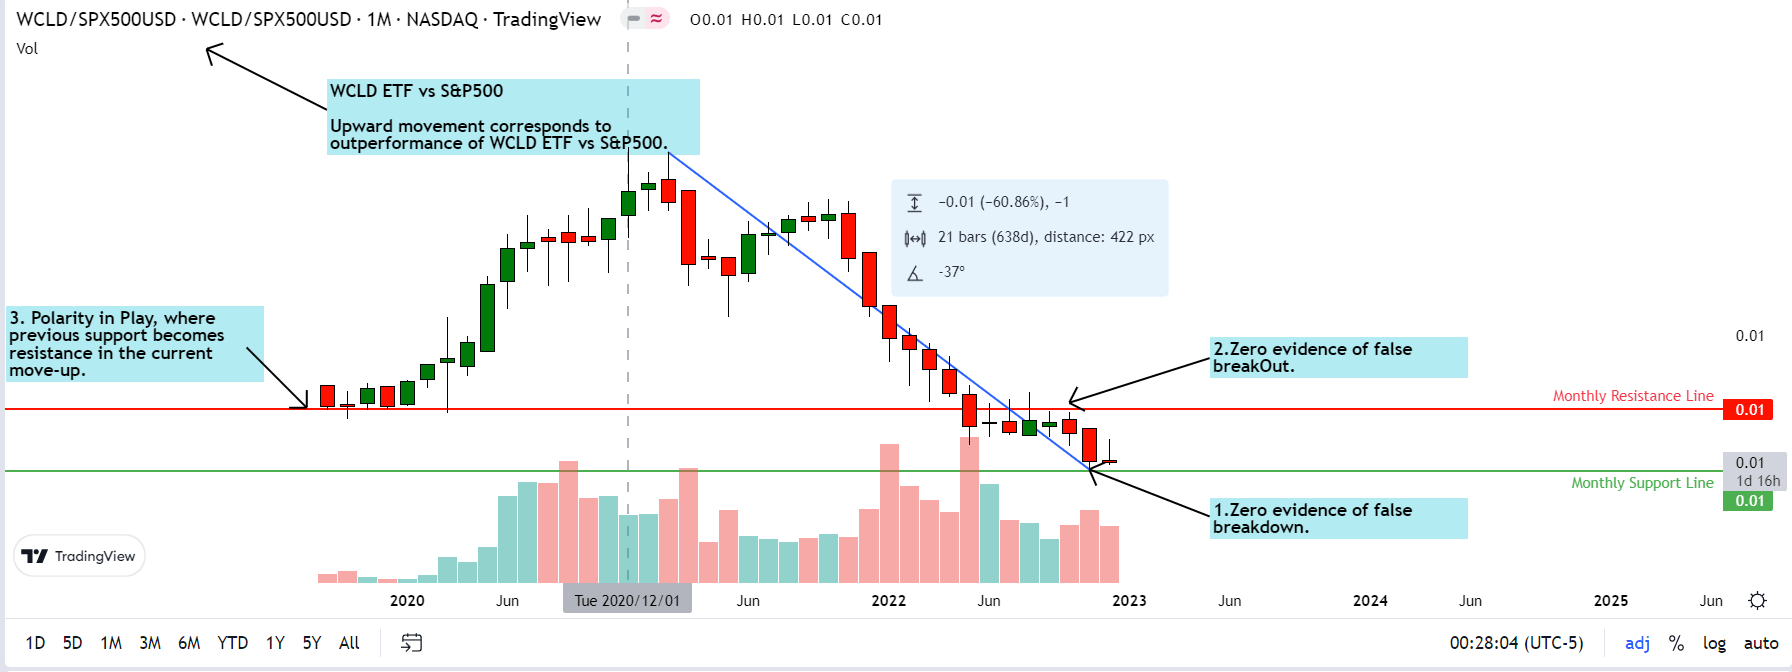
An upward movement on the relative chart of WCLD/SPX500 means WCLD is outperforming the S&P 500 (SPY). Conversely, a downward movement means the WCLD is underperforming the S&P 500.
After more than a 60% decline since Feb 2021, WCLD/SPX500 has depicted bearish lower low formations and continues to go down. The previous support location in 2020 has now become the key monthly resistance level putting a lid on price advances.
There is no evidence of a false breakdown or a bullish trap to join in on the sellers’ parade currently. Neither is there any sign of buyers holding the fort at the monthly support. Thus, I remain bearish, but with a “hold” currently as price is not at a good location to add positions right now.
Read of Absolute Money Flow
WCLD ETF Technical Analysis (TradingView, Author’s Analysis)
Similar to the relative chart, the absolute chart of WCLD also shows a sharp decline from the peak of $65.51 back in November 2021, after which we witnessed a correction of more than 65%. The price broke the previous support zone of $28.26 and has started to make rapid moves down. However, a support area resides below $21.76, and failure to hold this level may very well trigger a further downside.
So far, there is no clear evidence of prices creating a false breakout down to mark a sharp reversal in the trend. I believe prices may range between the monthly resistance and support levels.
Conclusion
Leading indicators such as corporate earnings growth, overall spending trend, and an easing of rate hikes will be key triggers for WCLD to stop its bearish descent, consolidate and outperform the overall market again. Until these developments manifest, I am maintaining a “hold” rating on WCLD.
Be the first to comment