

I haven’t noticed how quickly a decade of renewable energy investing flew by. Dozens of companies are no more, but some got unexpectedly big, and their market capitalization/assets/sales place them well into the “Stalwarts” or even “Slow-growers” category. Back then, I only imagined a day when a wind energy producer would earn 15 billion or more. Now, Vestas Wind System (OTCPK:VWSYF) (OTCPK:VWDRY) does that. This article describes the state of the wind energy space, the place of Vestas in it, the potential future, and a portfolio manager’s take on this stock.
Major trends and targets in wind energy
Starting with basic information about currents that shape wind energy past, present, and future, when we talk about electricity generation, regardless of its source, is all but complicated. Too many details in this area, which makes it hard for a stranger to make a sound judgment. For example, last year, in 2021, we read a lot of complaints about how the wind failed Europe since its absence left a void in electricity generation of several countries. Unfortunately, few people followed the whole story. Most were obsessed with the “bad” part of it in their brains. However, despite the dead calm summer, which brought a lot of troubles to European producers and consumers, the rest of that year more than compensated for it. You can see it on the chart below.
Eurostat
Thus, the wind didn’t fail anyone; it was simply itself. The world just lacks renewable energy infrastructure, such as vast enough energy storage solutions to properly handle the errand of putting the wind to our service. We are lucky that engineers and economists are heavily involved in decision-making rather than stock investors or “wise pundits.” That enables decade-long policies and massive renewable energy projects to continue sustainably developing. You can see on the following chart the cumulative result renewables have been piling up.
Global changes in electricity generation, YoY TWh
Global changes in electricity generation, 2015-2021 (IEA)
The five-year change for coal is 763 TWh, for gas – 590 TWh, renewables 2,022 TWh. You can follow this link to discover the expectations for 2022-2024.
The reader can observe what progress has been made through the years by wind energy. The scale of operations keeps up. Back in 2007, when wind energy capacity grew by a fraction of what it does nowadays, First Trust Global Wind Energy ETF (FAN) cost more than now. I bet some nerves were lost in the following years. Anyways, the picture below suggests where the train is going.
New wind capacity and FAN ETF (Irena.org and Author’s estimates)
Digression: What is LCOE?
I used this metric as it is – an approximate relative indicator of price competitiveness of different energy sources, usually for the developed countries. But for this article, I go slightly deeper to understand how it works and be able to explain it to others.
LCOE (Levelized cost of energy/electricity) will inform if a power-generating project will break even/make a loss/be profitable. Unprofitable projects will not proceed. The LCOE is a financial instrument, basically, a formula, that calculates and compares different energy-producing technologies regardless of unequal life spans, differing capital costs, size of the projects, and the differing risk associated with each project. It simply calculates a per-unit cost of electricity generated. The risk of a project is represented by the specific discount rate peculiar to the project type.
LCOE = Σ[(It + Mt + Ft) / (1 + r)t] / Σ[(Et/(1 + r)t], where:
- I – the initial cost of investment expenditures;
- M – maintenance and operations expenditures;
- F – fuel expenditures (if any);
- E – the sum of all electricity generated;
- R – the discount rate of the project;
- N – the life of the system.
Here is a simple example of the calculation; at the end of the article.
Lazard Ltd (LAZ) is a financial advisory and asset management firm. Each year the Company publishes an LCOE analysis. I want to share a couple of charts from the recent release. You will see the chart in full scale if you click on them. According to Lazard ltd:
In light of material declines in the pricing of the system components and improvement in efficiency, among other factors, wind and utility-scale solar PV has exhibited dramatic LCOE declines; however, as these industries have matured, the rates of decline have diminished.
Levelized Cost Of Energy (Lazard Ltd. LCOE Analysis)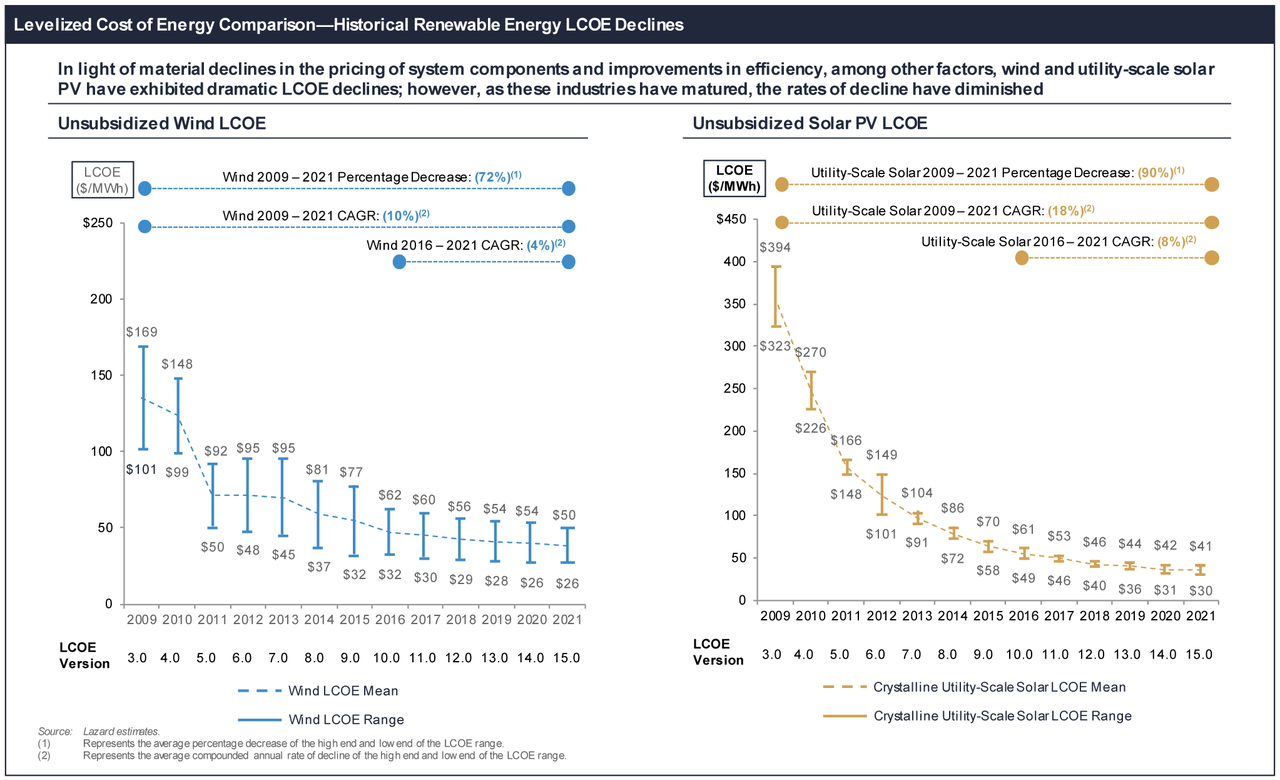
Сertain renewable energy generation technologies have an LCOE that is competitive with the marginal cost of existing conventional generation.
Levelized Cost Of Energy (Lazard Ltd. LCOE Analysis)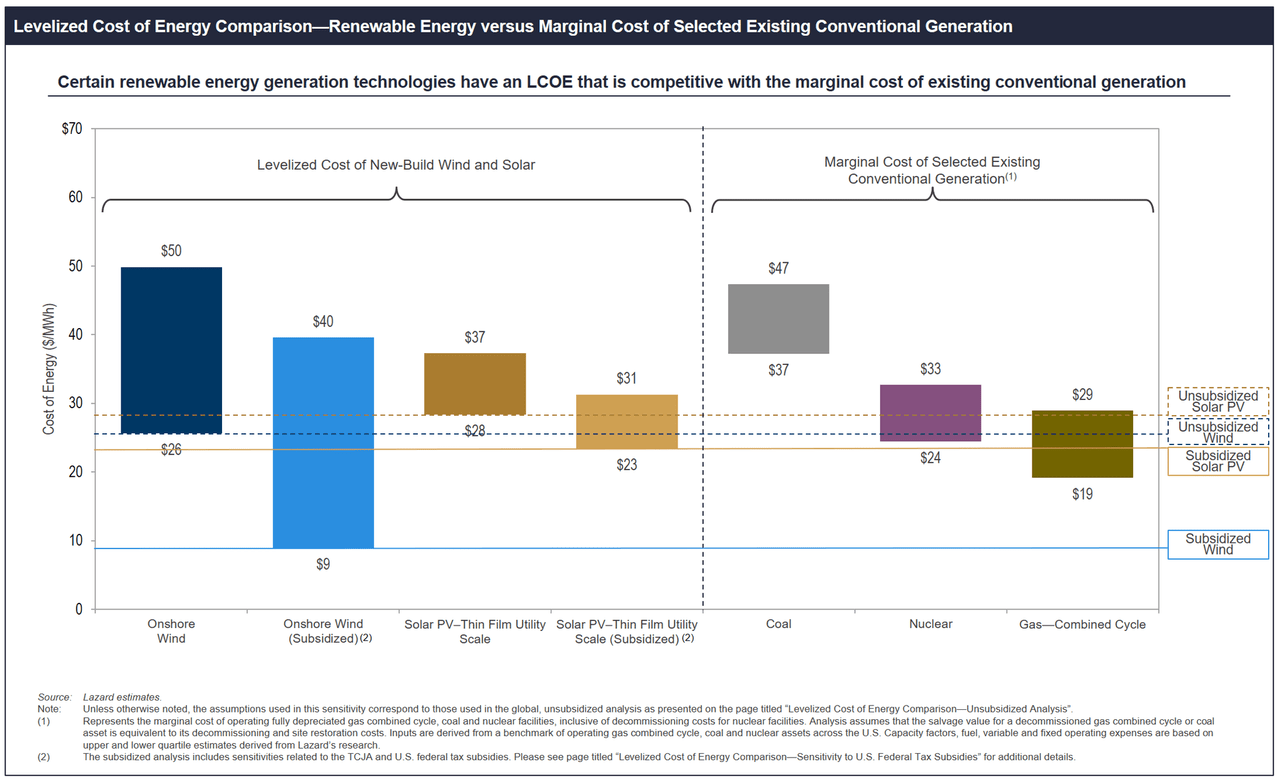
The marginal cost is the change in total production cost that comes from making or producing one additional unit. If the marginal cost of producing one additional unit is lower than the per-unit price, the producer has the potential to gain a profit.
(source: Investopedia)
There is no point in arguing about clean energy’s affordability since it’s been affordable for quite a few years by now. So, I will just proceed. I believe that we are not going fast enough in this direction.
Wind costs (Irena.org)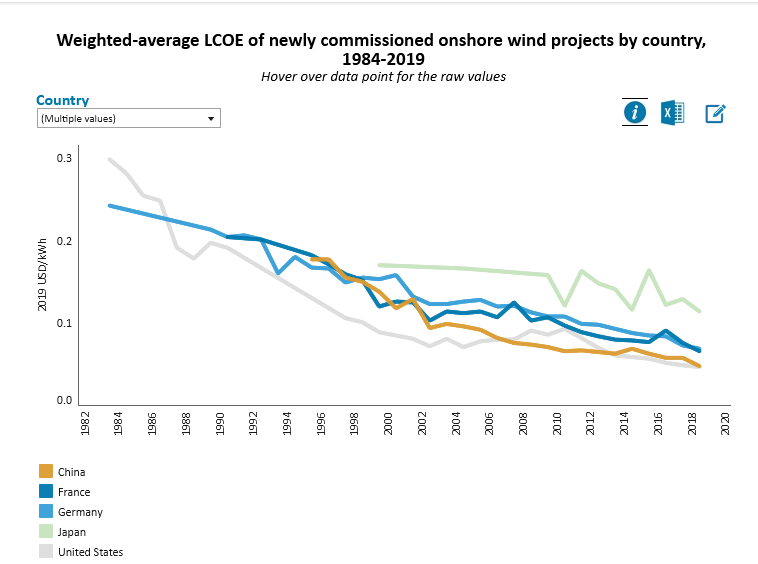
According to the chart above, in 2019 (last available), the most expensive LCOE was in Japan at $0.113 KW/h; the least expensive market was the US at $0.046 KW/h. And there are more countries here.
So, no wonder the Renewable energy and Battery Tech areas get more funding each year. But, let me kindly repeat that I believe we’re not nearly going fast enough.
Global energy supply investment by sector 2019-2021e
IEA.org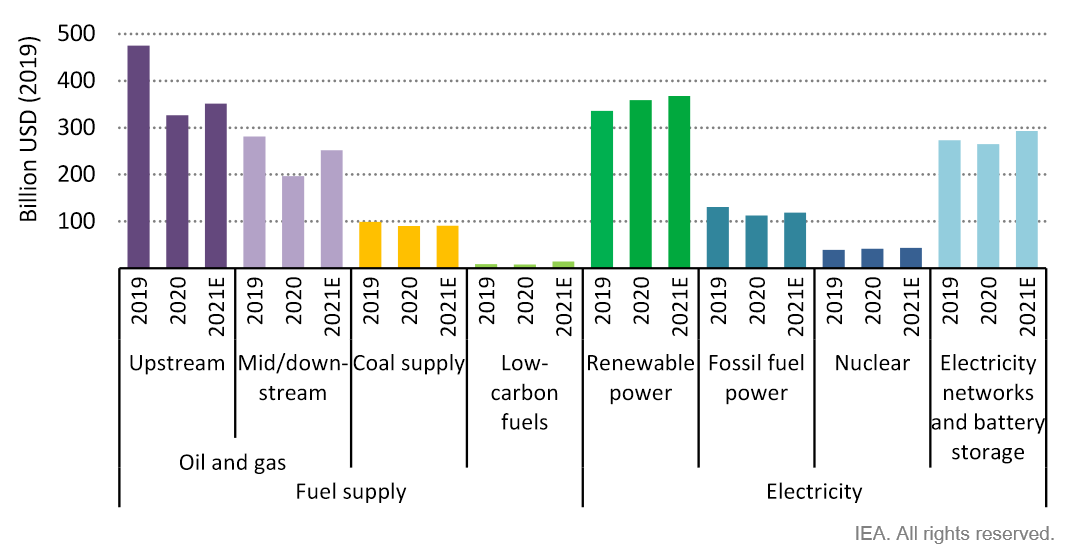
Wind targets
Here is what the Renewable power capacity looked like at the end of 2020.
Total renewable energy, GW
Irena.org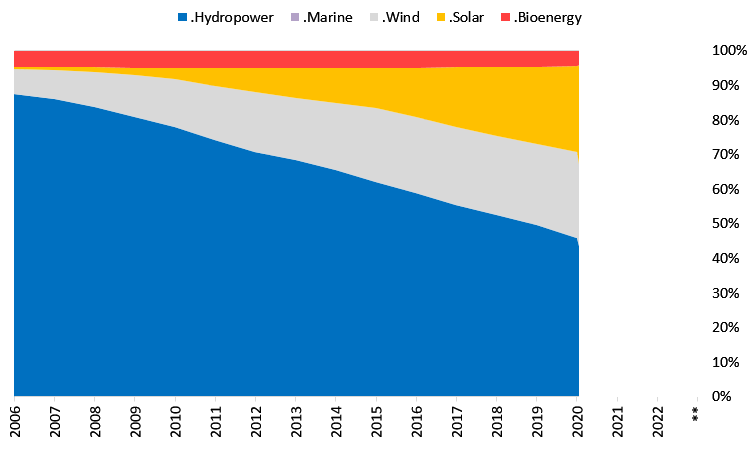
In my opinion, by 2030, the wind will firmly occupy second place since solar energy grows much faster and is cheaper. But there is more to it. Onshore wind energy rightfully dominates wind energy capacity because it has been and still is more affordable than Offshore; it accounts for only 7% of installed wind energy capacity worldwide. But this leg of wind energy is quickly gaining presence.
Onshore and Offshore wind capacity (Irena.org and Author’s estimates)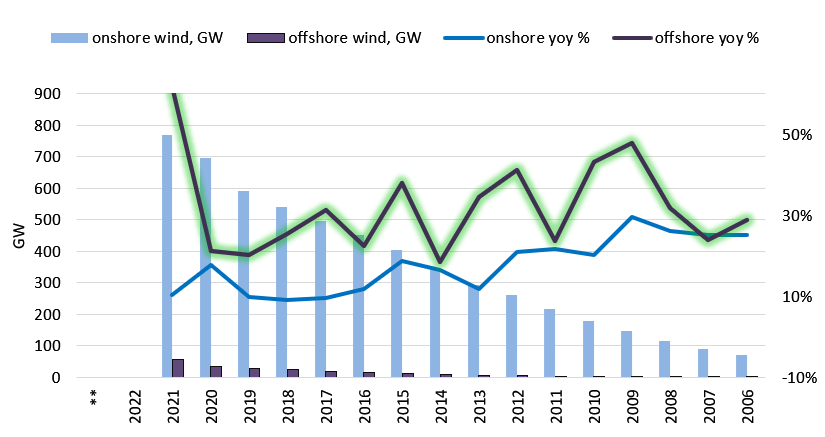
Offshore wind is at least two to three times more expensive than Onshore, but on the other hand, it is so underemployed, and the technology keeps progressing. That enables even more room for rapid increases. In Europe, Offshore wind has already won a significant share for several reasons like price, incentives, competition, and abundance of coastal areas.
New wind installations in Europe
windeurope.org and Author’s estimates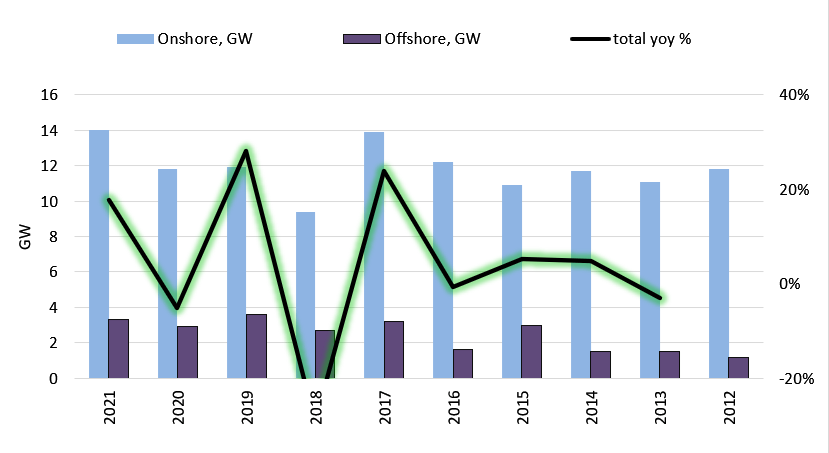
WindEurope expects Europe to install 116 GW of new wind farms from 2022-2026. That’s 23 GW a year on average. Three-quarters of these new capacity additions will be onshore wind.
The UN Climate Change Conference (COP26) highlighted that at the current installation rate of 90GW per year, the world is on track to meet only 43% of the 8TW-8.3TW of wind energy capacity needed by 2050 for a net zero world. Thus, the world must ramp up the installation effort – an obvious goal; it implies doubling the annual norm from 90 to 170+ GW.
Wind energy stocks
I suggest examining stocks that are available to investors. The most accessible way is to go through First Trust Global Wind Energy ETF (FAN) names because it corresponds with ISE Clean Edge Global Wind Energy TM Index (GWE). It does a decent job uncovering public wind energy companies, though including some companies is a stretch. When a company derives a lesser part of its revenue from wind energy and the rest from coal and gas – I don’t accept it and will not show it in this article.
Fourteen companies made my list, three of them only in part of their wind energy business. The following chart verifies the maturing of the wind energy business; an average company now has total assets of around 13 billion – almost double what it was five years ago.
Tikr.com and Author’s estimate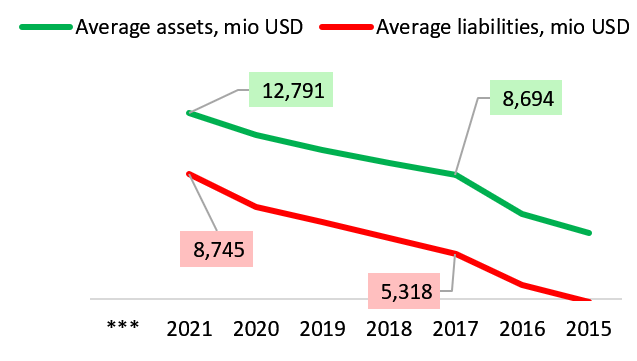
The next chart excludes China Longyuan Power Group Corporation Limited (OTCPK:CLPXF) and Northland Power Inc (NPI:CA) because they get less than 50% out of wind-related activities.
3-year average Book value of some companies in the list
Tikr.com and Author’s estimate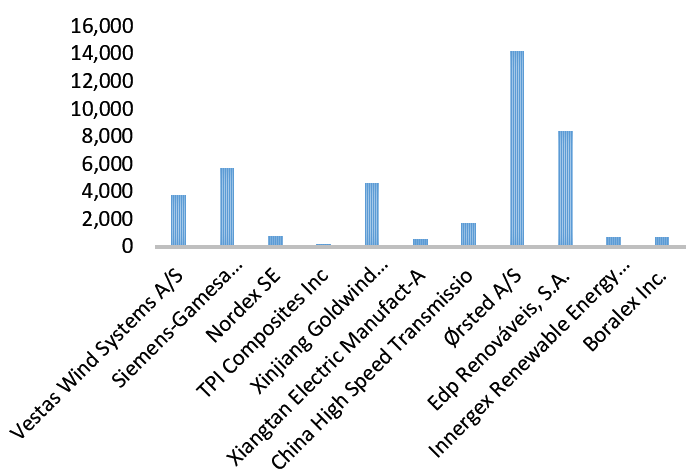
As you can see, Vestas is not the “tallest”; Siemens Gamesa Renewable Energy, S.A. (OTCPK:GCTAF) is one head higher. Ørsted A/S (OTCPK:DNNGY) and Edp Renováveis, S.A. (OTCPK:EDRVF) are big because their power generation business is big, whilst VWDRY and GCTAF are primarily equipment producers.
The following charts show the industry’s revenue growth, size, and dynamics of some FAN components.
Revenue growth of wind energy industry, except for non-wind sales of OTCPK:CLPXF and NPI:CA
Tikr.com and Author’s estimate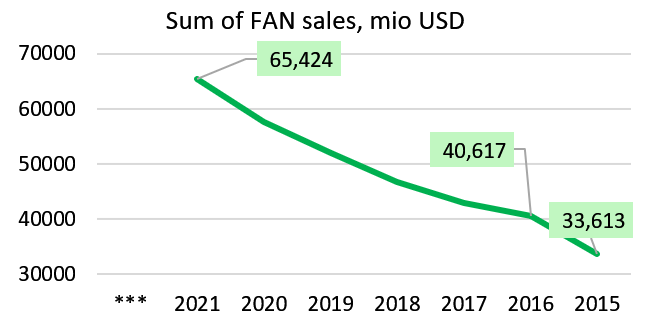
Sales of wind energy equipment producers, in EUR for VWS, SGE, Nordex SE (OTCPK:NRDXF) TPI Composites Inc (TPIC)
Tikr.com and Author’s estimate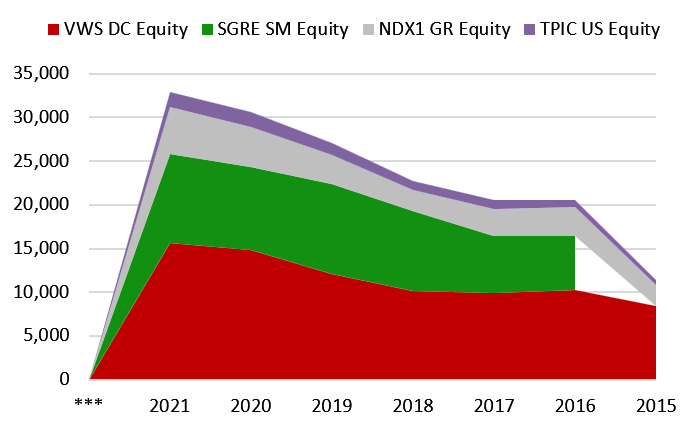
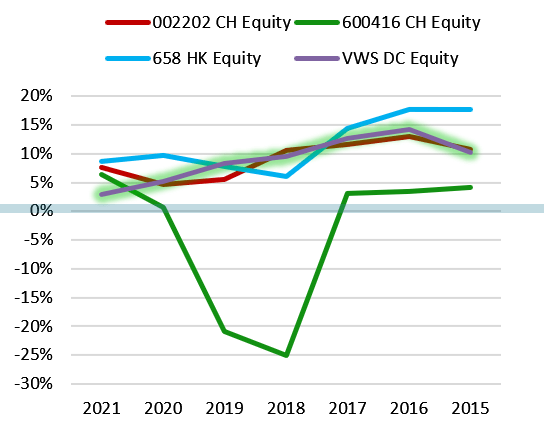
Dynamics of Sales of wind energy equipment producers
Tikr.com and Author’s estimate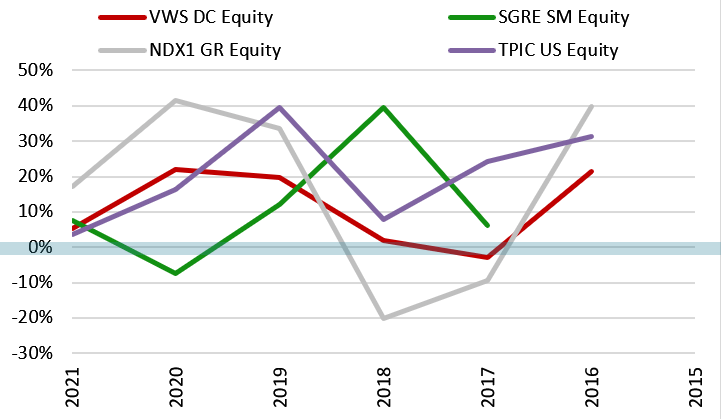
The last chart highlights Vestas as the most reliable and smooth, TPI Composites Inc as the most nimble, and a nice comeback for Nordex SE.
For the sake of scope and conclusions of this article, I will not cover too extensively other companies, since Chinese wind and power companies live in a parallel world and earn most of their sales in China. Power generating companies are not pure wind energy players; they are also boring even compared to matured Vestas and other equipment producers. But you can observe the sizes of players in the following chart.
3-year average Sales of some companies in the list
Tikr.com and Author’s estimate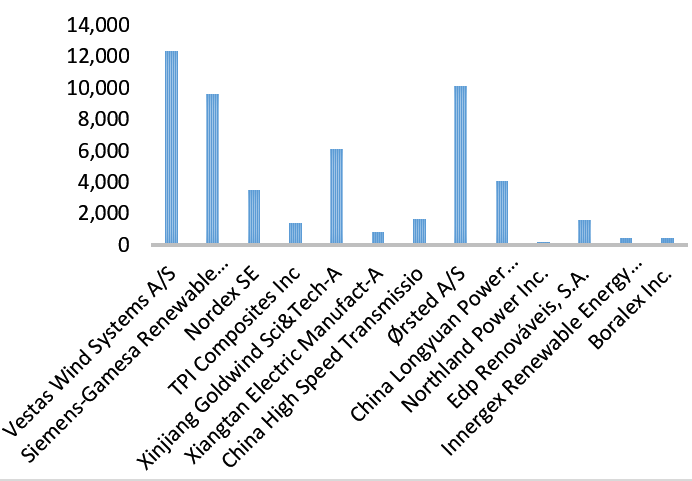
Dynamics of Sales of other noteworthy companies in FAN
Tikr.com and Author’s estimate
Innergex Renewable Energy Inc (INE:CA) and Boralex Inc. (BLX:CA) are the best examples in the chart above. But, as I said, these are not purely wind players; they are capital-intensive businesses with high debt.
For Vestas, the main competition for the market share in developed countries is raging with Siemens-Gamesa, so here is how they look in terms of revenue and profitability. Vestas has a more favorable profile here.
Competition between Vestas and Siemens-Gamesa
Tikr.com and Author’s estimate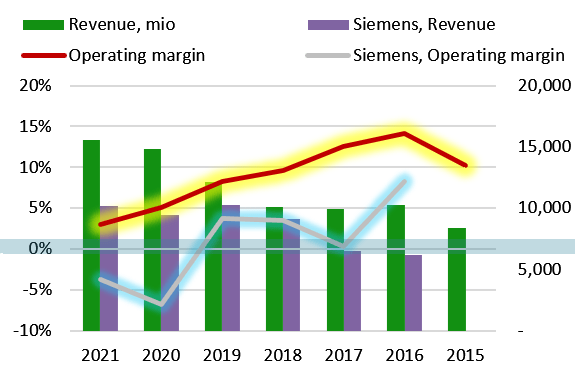
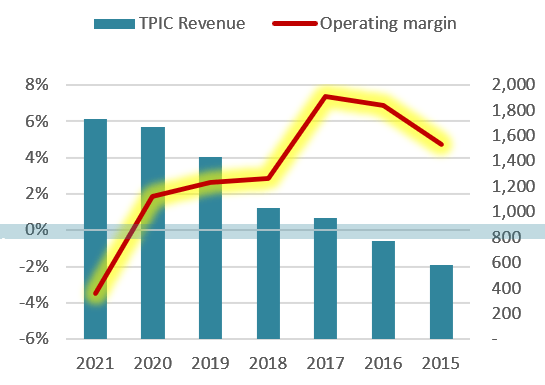
Also, as the next few charts will show, Nordex is struggling to be profitable despite showing vigorous growth. That is growth through the pains of being unprofitable. TPI Composites is growing well, but since 2017 its operating margin has been getting ever-sorrowful.
Nordex SE Revenue and Operating margin (Tikr.com and Author’s estimate) TPI Composites Revenue and Operating margin (Tikr.com and Author’s estimate)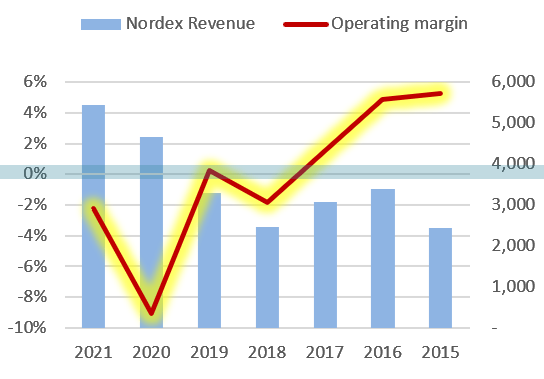
Power producers’ operating margins are looking great. The best companies here are INE:CA and BLX:CA.
Tikr.com and Author’s estimate Tikr.com and Author’s estimate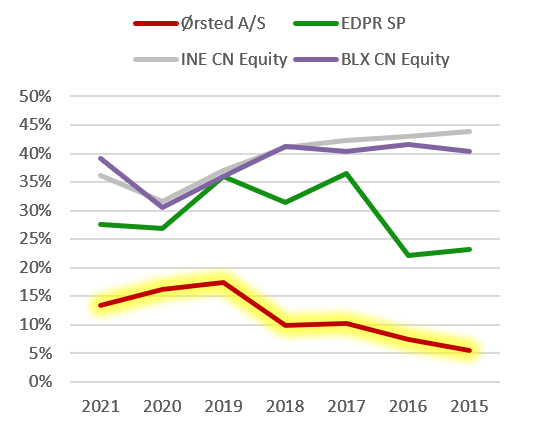
Once Vestas had a tight cash cushion, but not anymore because the company’s maturity comes through winning large international contracts, which most probably requires multi-year planning and an elevated inventory level. So, VWS just spent more than 1 billion EUR on Capex and Inventory. Here is how other companies and Vestas managed their cash reserves. Nordex and TPI Composites look favorably, by the way.
The ratio of Cash, Cash Equivalents & STI to Total assets among wind energy equipment producers
Tikr.com and Author’s estimate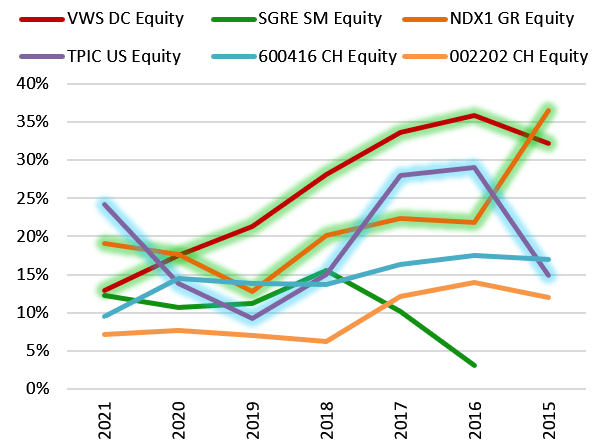
Inventory to Total Assets among wind energy equipment producers
Tikr.com and Author’s estimate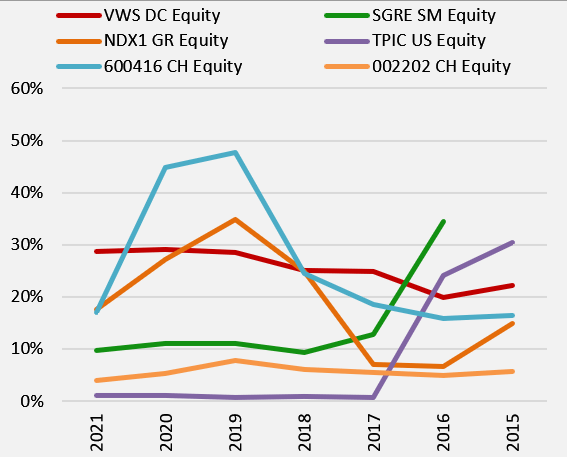
I discovered that Siemens-Gamesa doesn’t share with Vestas the same approach to Inventory levels; it did the opposite – decreased the Inventory to Assets ratio from 35% in 2016 to 10% in 2021. Still, its Revenue grew from 6 billion EUR to 10 billion. Nordex boosted its Revenue from 3.3 billion EUR in 2016 to 5.4 billion in 2021; its Inventory to Assets ratio changed from 6.6% to 17.59% for the same period peaking up at 35% in 2019. And finally, Vestas had a Revenue of 10 billion EUR in 2016 and an Inventory to Assets ratio of 20%, but in 2021 Revenue was at 15.5 billion EUR and the same ratio at 29%. Reasons for that I have explained previously, that’s a toll of raging competition for the developed markets. As a result, Vestas had to get more complex; it got bloated with the inventory, which is not good but serves as an indication of maturity and size.
The average debt to assets, except for power producers
Tikr.com and Author’s estimate
I was surprised to learn that wind energy equipment producers’ average level of debt to assets hasn’t grown for the last five years. It must be a good sign for the industry – growing old. And the following table shows that Vestas, Nordex, and Siemens-Gamesa look very favorably operating with low indebtedness. TPI Composites has improved. Innergex and Boralex, at this point, finally demonstrate the price of smooth elevated operating margins, but are heavily reliant on debt.
| 3-year average debt to assets | FY 2021 debt to assets | |
| Vestas Wind Systems A/S | 5.79% | 7.28% |
| Siemens-Gamesa Renewable Energy | 8.88% | 13.03% |
| Nordex SE | 19.82% | 11.86% |
| TPI Composites Inc | 32.72% | 24.19% |
| Xinjiang Goldwind Sci&Tech-A | 23.96% | 26.24% |
| Xiangtan Electric Manufact-A | 34.82% | 29.37% |
| China High-Speed Transmission | 19.28% | 13.49% |
| Ørsted A/S | 19.59% | 21.65% |
| Edp Renováveis, S.A. | 24.95% | 22.25% |
| Innergex Renewable Energy Inc | 72.53% | 68.71% |
| Boralex Inc. | 72.45% | 68.51% |
During my analysis, I discovered that the CapEx is usually small for the leading wind energy players. For instance, the average CapEx to Sales ratio for Vestas, Siemens, Nordex, and TPIC was at 3.12%, 4.26%, 4.48%, and 4.74%, respectively. However, CapEx is essential for power producers; the CapEx to Sales ratio is between mid to high double-digit. Edp Renováveis – 78%; Innergex Renewable Energy – 92%; Boralex – 36%.
The noteworthy players
I want to conclude this part with a brief observation. Vestas is the major wind energy equipment producer, and it has a decent size, but the dynamic is getting slower. Nevertheless, it held onto its leadership, and I will separately talk about Vestas in the next section. The other companies that show potential are Siemens for improved financial health, Nordex for improved health plus better dynamics, and TPI Composites purely for sales dynamics. Unfortunately, I cannot say that the rest could charm me, so I am skipping them.
Vestas specifically
In this short section, I will raise several points about Vestas’s business and how a long-term investor may approach this company. I hope everybody knows what a behemoth of the Wind energy industry this company is; a pioneer and the most prominent player. The factsheet on the business can be found here, but I think this is irrelevant since you already know that Vestas is number one. The company says its roots can be traced back to the 19th century; however, it started as a wind energy equipment producer in the 1970s. And here is how the top wind turbine suppliers are juxtaposed:
Top 15 wind turbine suppliers in annual global market in 2021 (GWEC Market Intelligence, May 2022) Geography of Vestas’s Sales (Tikr.com and Author’s estimate)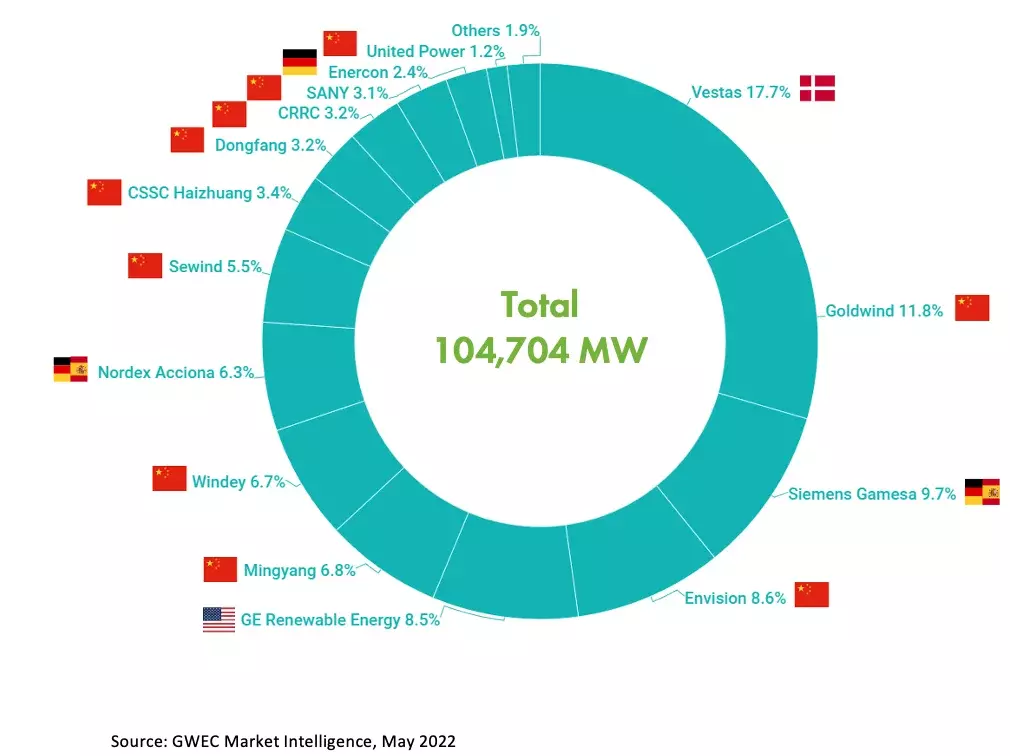

Generally, with few exceptions, businesses go through Start, Early stage of rapid growth, Moderate growth stage (“Stalwartness”), Slow growth stage (“Top maturity”), and Decline. I argue that VWS has reached the late Stalwartness but not the Slow growth stage yet. That puts us investors in a perfect place where we can have better visibility of the future and still have very agreeable returns. The following chart shows that VWS’s three-year average revenue was 14.18 billion EUR in 2021. Trust me that is very high for a clean-energy business; I have witnessed this industry maturing.
Vestas’s Revenue 2005-2021 in mio EUR (Tikr.com and Author’s estimate)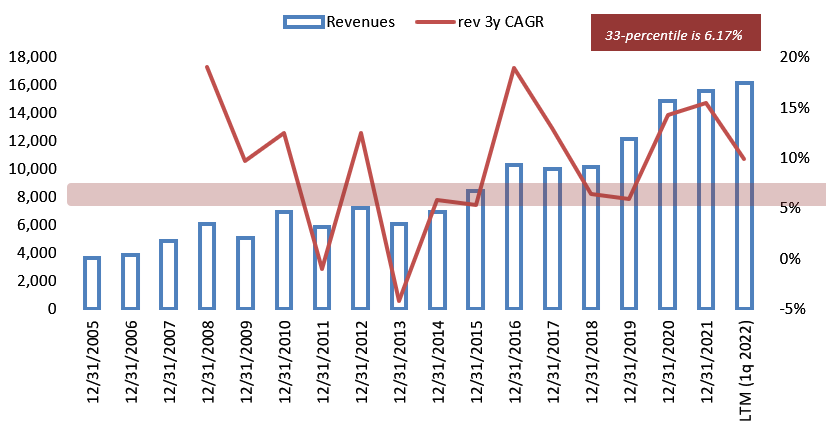
It won’t be easy to continue growing in double-digits, though not impossible. Therefore, I suggest using a three-year CAGR rate in its lowest 33-percentile cases. Thus, I define VWS’s growth rate to be around 6% in the next 7 to 10 years; Sometimes 12-17% but sometimes -7% or +2%.
Unfortunately, the moat Vestas has is not wide enough, the competition drives margins lower, and Vestas’s still has the highest. Since the wind energy market is still cyclical, we can also expect swings upwards. The latest report said the company raised its prices in Q2 by 22% Y/Y. Whether it to sustain, only time tells. I want to remain on the skeptical side for safety reasons.
Gross margin and Operating margin of Vestas (Tikr.com and Author’s estimate)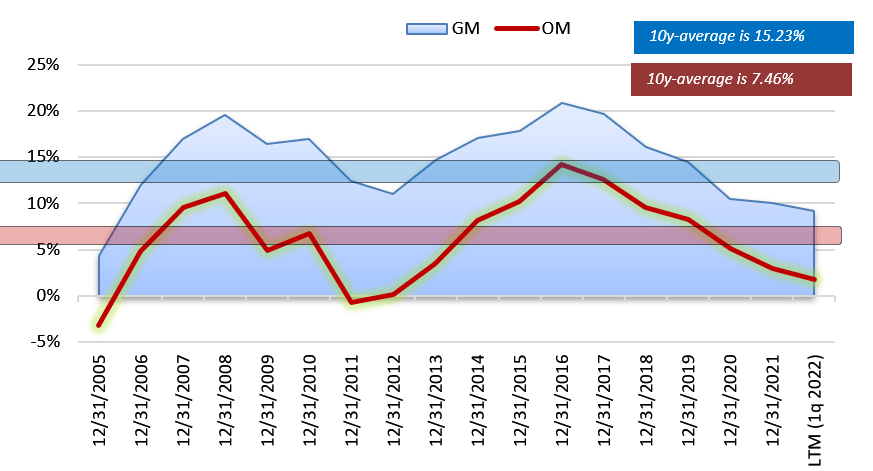
To maintain its leadership, Vestas has to spend, and that eats up the profitability.
Vestas’s main expenses (Tikr.com and Author’s estimate)
Previously, the company was more flexible in handling inventory and staff, but big tangible businesses tend to be rigid and complex, especially in Europe. As a result, it is hard to fire people when necessary, and Vestas’s employee YoY growth rate has remained positive since 2013, bouncing between 6.7% and 0% since 2015, except for the FY20202. I believe that rigidness is simply unavoidable, and we must bear with it while the business keeps buzzing. And the following chart explains how increased complexity through multi-year contracts packed total assets with the inventory. That’s a bad thing that they cannot manage it like Siemens or Nordex. What can we do about it!? The company operates worldwide in the most significant wind power projects, which asks for being fully stocked.
Vestas’s Asset structure (Tikr.com and Author’s estimate) Interconnection of LT Contract liabilities and Revenue growth (Tikr.com and Author’s estimate)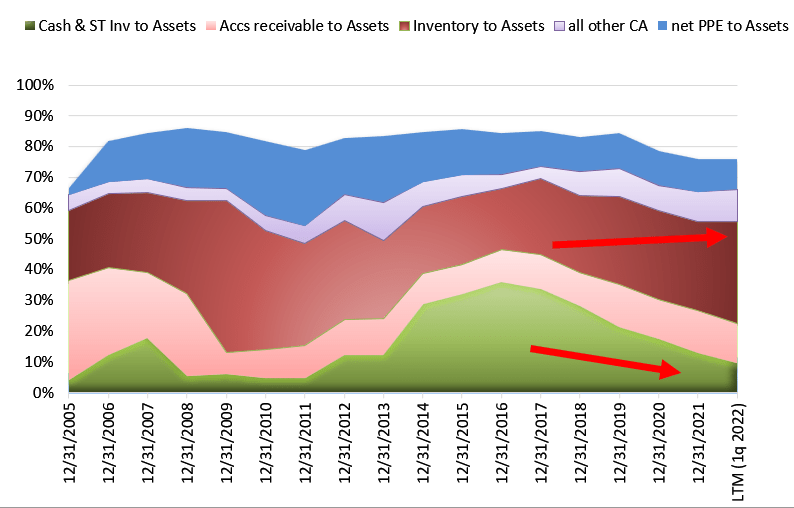
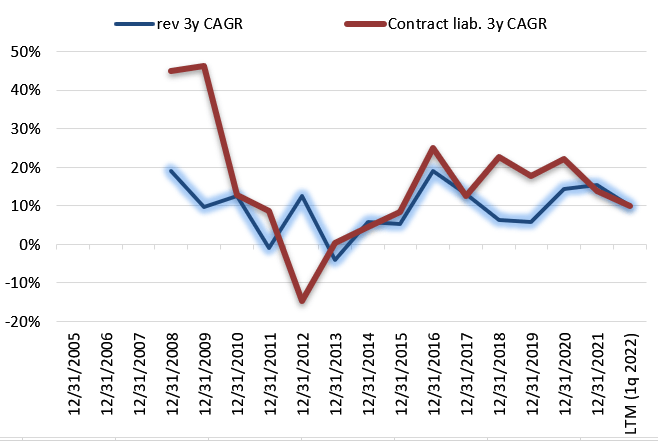
Worth noting is the dependence between a rising of the cash conversion cycle and growth of Revenue. The cash conversion cycle hit bottom around 2016-2017 and since then has been climbing up with Revenue; it has doubled. That tells me the same story – Vestas’s projects keep getting longer and greater, and the company’s size and technology enable it to work at the most significant building sites. However, it comes at the price of leveling up the complexity to the detriment of dynamics.
VWS’s debt to assets ratio has been kept humble since 2012. I hope it stays this way.
Tikr.com and Author’s estimate
This article avoids speculation about which short-term or long-term wind projects the company is currently involved in or expected to be involved in could drastically affect its seven to ten year business path. That would be a short-sighted endeavor and naturally futile. We are also avoiding speculation about whose technology is the best and who will be the king in a couple of years because that is also not pre-defined and requires deep engineering expertise. Instead, we are looking at the financials and expecting moderate growth over seven to ten years. Thus, we must value this asset somehow.
Operating margin of Vestas and CFO to Sales ratio (Tikr.com and Author’s estimate)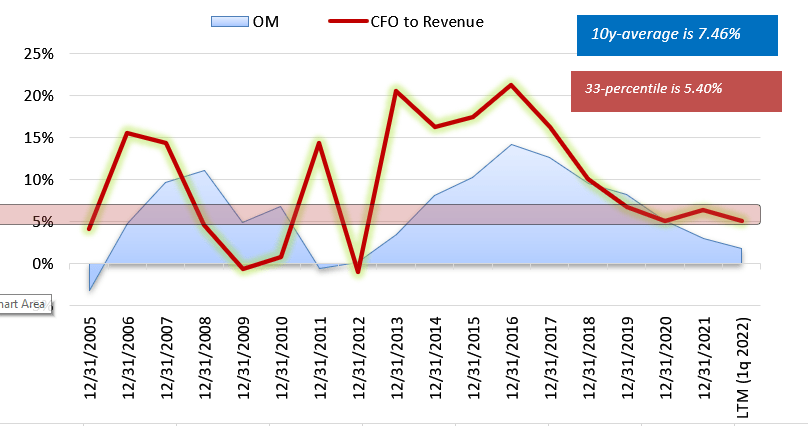
The generation of cash for investors has been slowing since 2016. If the compression of the CFO to Sales ratio moved it to a 5%+ level, the same process made the Free cash flow to Sales ratio even thinner. The last year brought in only 520m EUR, but in 2017 it was 1357m. Seven-year average would give us 924m. I don’t want to hold Vestas if I can’t expect at least 750m EUR of average Free cash flow in the next ten years, and since it lies within the historical range and with the flow of time, VWS ought to grow, then I would use 750 as a baseline.
Free cash flow Vestas and FCF to Sales ratio (Tikr.com and Author’s estimate)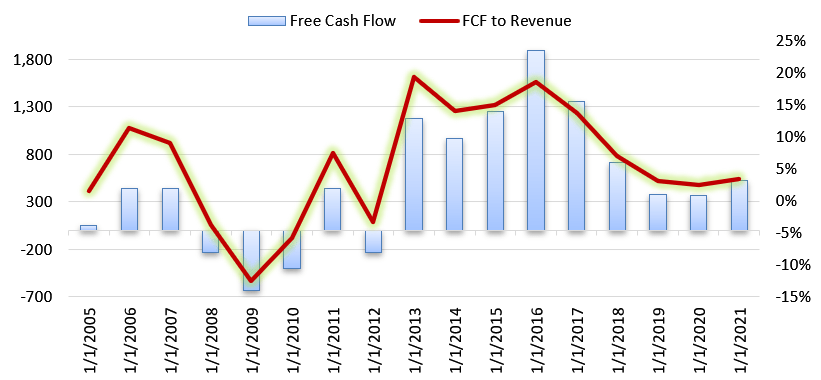
Investment thesis
Vestas is a poster child of wind energy; it is the largest and oldest among currently active companies. All major wind energy markets across the globe, except for China, are served by Vestas. Its revenue and assets base is colossal for the clean energy sector. However, big infrastructural projects and competition make margins thinner, and shareholders get less profit. Hard to imagine how this trend can be reversed; however, Vestas could prosper with its dominant position.
Valuation-wise, using a primitive DCF (10 years, 7% discount rate, 750m for the cash flow, 3% for Terminal value), I get a fair value of 25.35 EUR per share. We could also cut that approximate value by 40% to use the “Margin of safety” concept and get 15.21 EUR per share as the proper price to enter.
Based on my observations, Mr. Markets puts a thin but existent premium on Vestas unless things go entirely south for the company. Therefore, for the next twelve months, I will not dare to open a considerable position in Vestas above 20 EUR per share; 18 EUR would be a good starting point for the accumulation.
The following chart also suggests that Vestas is not cheap at the moment.
Tikr.com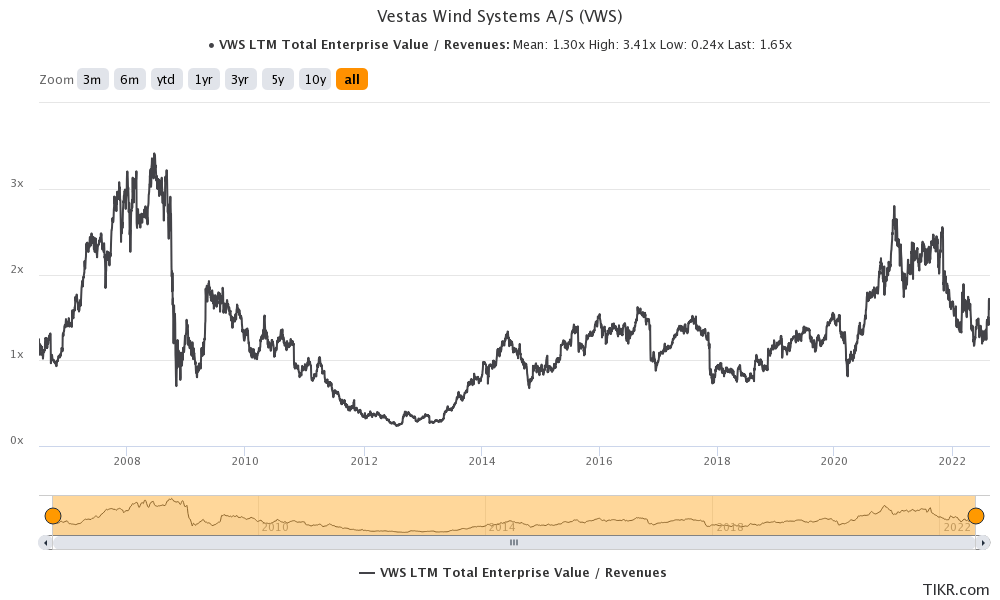
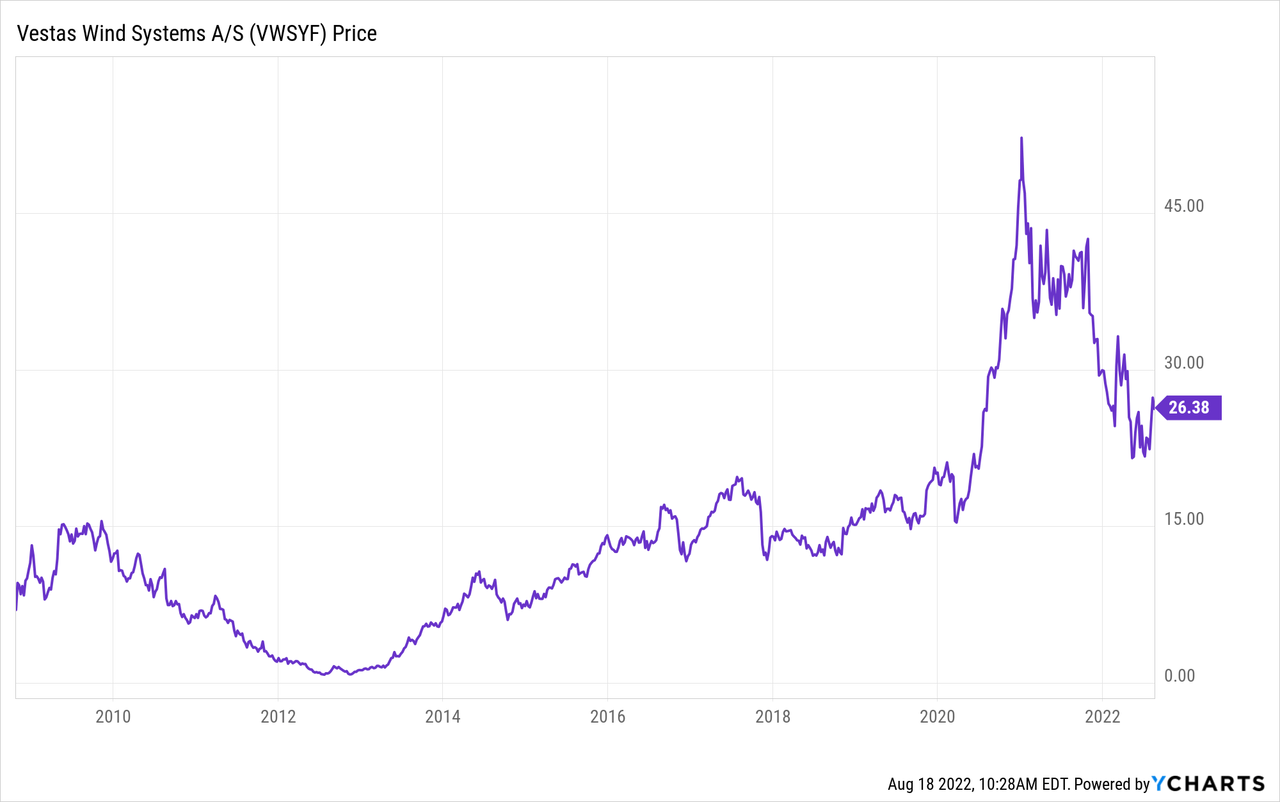
The chart above is priced in USD.
Risks
- VWS works in a cyclical industry, and a few-year decline could follow the returns we saw in 2019, 2020, and 2021;
- Wind energy equipment producers and service providers play in a very competitive market that cannibalizes players’ profitability;
- Not only thinner margins but as a result of competition, a shift in leadership can happen because a couple of years ago, Siemens-Gamesa was close to taking the crown and could do it in the future.
Be the first to comment