Editor’s note: Seeking Alpha is proud to welcome The Agile Agent as a new contributor. It’s easy to become a Seeking Alpha contributor and earn money for your best investment ideas. Active contributors also get free access to SA Premium. Click here to find out more »
asbe/iStock via Getty Images
My Investment View on SARK
To fight inflation, the Fed has made a strong pivot from dovish to hawkish, from expansionary to contractionary. As we’ll explain in greater detail, these forces particularly punish hypergrowth companies like those held in the ARK Innovation ETF (ARKK) which has and will continue to experience substantial declines.
Because Tuttle Capital Short Innovation ETF (SARK) is an ETF that tracks the inverse performance of ARKK, it is an easy and efficient way to short the growthiest of growth companies, thus profiting from the downward pressure on valuations presented in the current inflation and interest rate environment. As such, I rate SARK a Strong Buy.
After introducing SARK (which by extension, requires an overview of ARKK as well), we’ll discuss why the rising rate environment punishes ARKK’s individual holdings, thus leading to a strong outlook for SARK continuing forward.
Introduction to SARK
With prescient timing and a good product-market fit, SARK launched on Nov 9, 2021 and surpassed $100 million in AUM in just 24 trading days. SARK’s advisor is Tuttle Capital Management (formerly known as Tuttle Tactical Management), which was founded in 2012 by Matthew Tuttle.
SARK now has $550 million AUM as of the date of this article, an average trading volume of 3.86M and a 30-day median bid-ask range of 0.05%, it is liquid enough for nearly any investor’s needs. The fund charges a 0.75% expense ratio (same as ARKK) and does not pay a dividend.
What is SARK’s Objective?
Also known as “short ARKK” or the “short the ARKK” ETF among traders, SARK is self-described as follows:
Do you think disruptive innovation is overbought? Do you believe that ultra-high growth stock valuations have reached uncomfortably lofty levels? Does the bull thesis for transformational industries such as next-gen internet, electric vehicles, genomics, and fintech seem stretched? If so, consider the Tuttle Capital Short Innovation ETF (Nasdaq: SARK). SARK is an attractive opportunity that allows investors of all types to obtain short exposure to a concentrated portfolio of secular growth companies.
SARK is an actively managed exchange traded fund that attempts to achieve the inverse (-1x) of the return of the ARK Innovation ETF (ARKK) for a single day, not for any other period.
SARK Under the Hood: How It Works
The SARK Prospectus states it “attempts to achieve the inverse (-1x) of the return of the ARK Innovation ETF for a single day, not for any other period, by entering into a swap agreement on the ARK Innovation ETF…”
Swap agreements are complex investments that by definition are subject to counterparty risk. SARK describes its “one or more swap agreements” as being with unnamed “major global financial institutions.”
The ETF’s Prospectus also states the following. “The pursuit of a daily investment objective will result in daily compounding. This means that the return of the ARK Innovation ETF over a period of time greater than one day multiplied by the Fund’s daily target (i.e., -100%) generally will not equal the Fund’s performance over that same period.”
This raises two questions:
1. How well does SARK track the inverse of ARKK on a daily basis? An analysis of the daily returns of SARK vs. ARKK performed by me reveals that out of 116 trading days so far this year, SARK matched the inverse of ARKK’s daily return only four times. Below is the distribution of daily tracking error vs. ARKK. Importantly, the average is to underperform the magnitude of ARKK’s daily movement by only 0.03%, while the median was even less, at 0.02%. While no tracking is perfect, this is pretty good.
Overall SARK tracks the daily inverse of ARKK pretty well. (Barchart.com data compiled by author)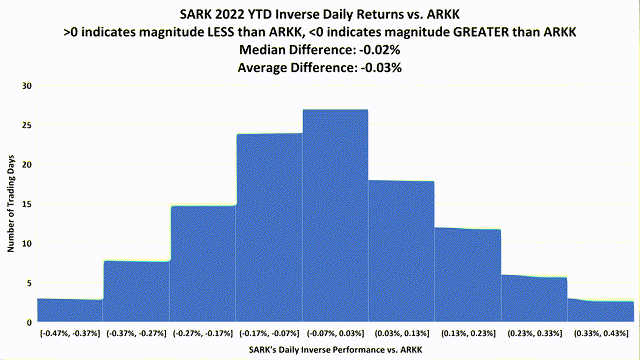
2. Though not it’s stated performance objective, how well does SARK track the inverse of ARKK on a longer-term basis?
| YTD Performance | Since 11/9/21 | |
| ARKK | (-59%) | (-69%) |
| SARK | 82% | 225% |
As you can see, the effects of compounding and volatility cause the longer term performance to not track ARKK as well. It is discussed in detail in the Prospectus but because it’s to the upside, it’s not like there’s anything to complain about here.
SARK Risks
Like any security, SARK has risks. In the case of SARK, most of these are the ones we’ve just discussed: counterparty risk inherent in swap agreements; tracking errors; and the way in which SARK’s objective to match daily inverse ARKK returns can affect compounding results over time. Thus, to disclaim liability the Prospectus states SARK “is intended to be used as a short-term trading vehicle… As a consequence, especially in periods of market volatility, the volatility of the ARK Innovation ETF may affect the Fund’s return as much as, or more than, the return of the ARK Innovation ETF.” Also, as with any actively traded fund, SARK’s performance relies on the fund adviser’s ability to select the right derivatives contracts (swap agreements) and effectively manage risk in a way that meets the fund’s stated objective.
SARK is effectively a bet against ARKK. Thus, to understand SARK we must understand ARKK as well.
ARKK Overview
Under the auspices of manager Cathie Wood, ARK Investment Management first launched the ARK Innovation ETF, or ARKK, on Oct 31, 2014. ARKK’s has a massive $7.3 billion AUM (as of June 16, 2022), trades over 30 million shares daily, and has an even narrower (thus more liquid) 0.02% bid/ask spread compared to SARK. It’s 0.75% expense ratio is the same as SARK.
What is ARKK’s objective?
As an actively managed ETF, ARKK is not tied to any index, indicator or metric, so its holdings are subjectively selected by management for meeting its “investment theme of disruptive innovation” which it defines as a tech-enabled “new product or service that potentially changes the way the world works” while naming these four themes in particular: the genomic revolution, automation and robotics, AI and ‘next generation internet’–whatever that means–and fintech innovation (i.e., crypto).
ARK Invest publishes a daily list of holdings on its website. Here are their top 10 as of June 16, 2022:
ARKK top 10 holdings as of June 16, 2022 (ARK Invest)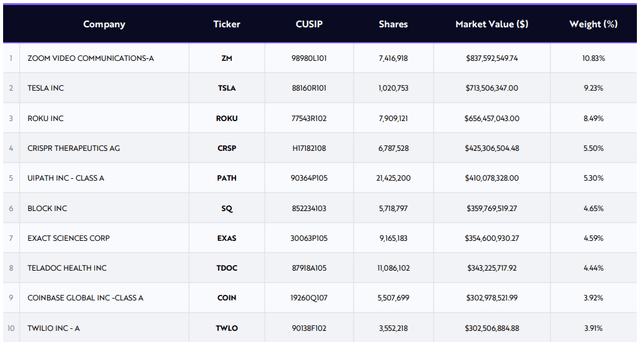
Though ARKK’s holdings change significantly over time on the basis of purely subjective factors, here are some metrics from Altavista Research on a per-share basis:
ARKK per-share figures (Altavista Research) ARKK’s per share ROE and net margin have always been negative (Altavista Research) ARKK’s per-share valuations are still obscenely high (Altavista Research)
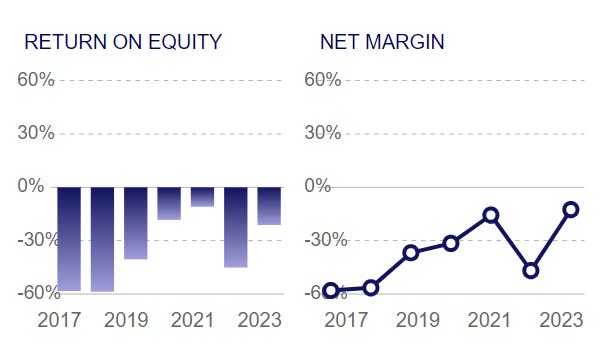
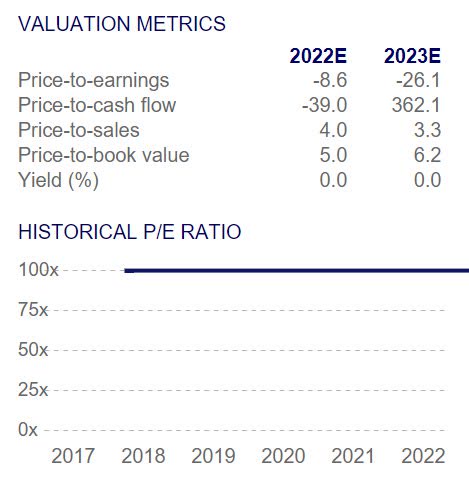
In short: overvalued and never profitable (on a per-share basis).
ARKK’s recent performance
For reasons we’ll discuss below, in 2020 ARKK was one of the best-performing of all ETFs. According to The Intelligencer, this earned manager Woods “a rockstar reputation among stonks-obsessed retail investors, making her a mascot for buy-the-f’ing-dip Robinhood traders” at the time.
ARKK’s total return in 2020 was 155%.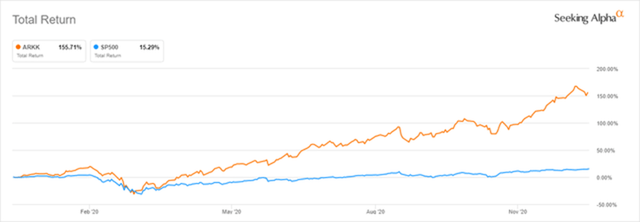
Yet after treading water for much of 2021, growing talk of inflation caused ARKK to begin to slide, finishing the year down over -20% and trailing the S&P 500 (SP500) by over 50 points.
ARKK’s total return in 2021 was -22%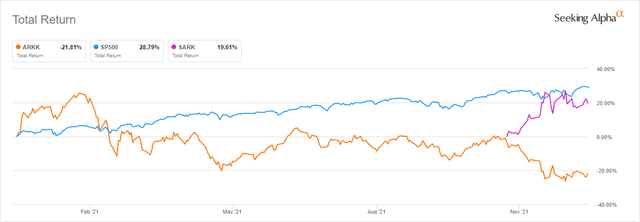
With ARKK’s loss being SARK’s gain, things have only intensified during 2022 YTD:
Through June 16, ARKK’s total YTD return is -62%.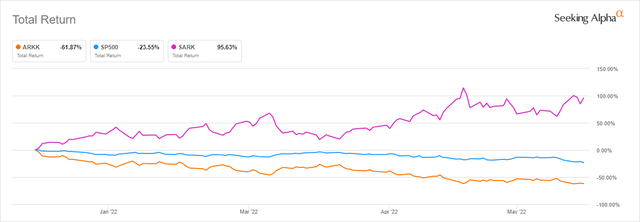
ARKK Risks
The risks in ARKK I believe are many, serious, and fall into four main categories.
ARKK Risk 1: Thesis sounds nice, but…
For starters, most of the slides in its pitch deck start with “we believe that..” followed by the possibility that such things “could” create massive new TAMs. Even if they do, one must also “believe that” ARKK’s ever-changing holdings will be the ones to win. There are no discussions whatsoever of actual company holdings, enterprise value, profitability, valuation, price/earnings–nothing at all of the sort. It’s long on possibilities and aggregate TAM projections and doesn’t even attempt to create an intrinsic valuation of the companies within its ever-changing portfolio. It does, however contain these three gems:
- ARK seeks to size the potential investment opportunity, noting that risks and uncertainties may impact our projections and research models.
- Companies that ARK believes are capitalizing on disruptive innovation and developing technologies to displace older technologies or create new markets may not in fact do so.
- The potential growth or displacement of market industries discussed herein may not translate to favorable investment performance.
(Quotes taken from slide 2 of ARKK’s Investment Case presentation, numbering and emphasis are mine.)
ARKK Risk 2: Overly Concentrated, Undiversified
While there are a plenitude of public companies pursuing disruptive innovation, ARKK is both decidedly undiversified (70% of holdings are in tech and healthcare sectors, and all holdings are in just 4 of 11 S&P sectors) and highly concentrated (top 10 holdings comprise >50% of the fund’s 36 total holdings). This is unforgivable for a modern-day ETF. ARKK’s sector concentration and undiversified holdings are so bad that it’s forced to disclose its classification “as a “non-diversified” investment company under the 1940 Act.”
In an unusually scathing rebuke, the typically dispassionate fund rating company Morningstar wrote, “Since its meteoric rise in 2020, the strategy’s exchange-traded fund has been one of the worst-performing U.S.-sold funds, as the aggressive-growth stocks it held fell back to earth,” describing a “wretched 45.5% loss over the trailing 12 months through February 2022” due to Wood’s “perilous approach. The report also made the following observations.
She has saddled the portfolio with greater risk by slashing its number of stocks to 35 from 60 less than a year ago–thereby amplifying stock-specific risk–and growing its aggregate exposure to companies in which ARK Investment Management is a large shareholder. The strategy has effectively become less liquid and more vulnerable to severe losses.. The firm has no risk-management personnel.
Wood’s reliance on her instincts to construct the portfolio is a liability. This is a high-risk, benchmark-agnostic portfolio that invests across technology platforms the team thinks will revolutionize how sectors across the globe operate. The firm favors companies that are often unprofitable and whose stock prices are highly correlated. Rather than gauge the portfolio’s aggregate risk exposures and simulate their effects during a variety of market conditions, the firm uses its past as a guide to the future and views risk almost exclusively through the lens of its bottom-up research into individual companies..
ARK could do more to avert severe drawdowns of wealth, and its carelessness on the topic has hurt many investors of late. It could hurt more in the future.
Risk 3: Extreme Volatility, Dismal Momentum
In this already-volatile market, ask yourself if these kinds of metrics feel prudent for anyone’s portfolio. From ValuEngine:
- 1.7 beta While a high beta may work well during a low-vol, bullish market (such as 2020), it’s terrible in a high-vol bearish market.
- -0.90 alpha If you were ‘seeking alpha’ or excess returns above the market, you won’t find it here. ValuEngine places ARKK in the 2nd percentile of alpha (i.e., 98% of ETFs have better alpha than ARKK).
- 42% standard deviation/volatility representing the standard deviation of the fund in annualized terms, this puts ARKK at the 97th percentile of volatility among ETFs (i.e., 97% of ETFs have lower volatility than ARKK). For reference, the S&P 500 has a volatility % in the 13-17% range.
- 0.23 Sharpe ratio – in a world where investors strive for Sharpe ratios >2 while considering >1 acceptable, 0.23 is not.
- -58.58% in asset flows – Seeking Alpha data show ARKK’s AUM have plummeted over 58% in the last 6 months, and 27% in the last month alone! Despite all this, ARKK still retains approximately $7 billion in AUM.
Risk 4, and Most Important: Inflation
Despite SARK’s already significant YTD return, I believe many investors have not yet come to grips with just how punishing a rising rate environment is for newer, riskier, more volatile growth companies like those in ARKK’s holdings. I therefore expect ARKK to continue to decline, leading to continued upside performance for SARK, until such time as the fundamental factors below change course.
Let’s start with the obvious: don’t fight the Fed.
For the better part of the last 12 years but especially during 2020 to mid-2021, the Fed-supported market had a posh life. Unprecedented QE and low interest rates encouraged the market to seek after and reward moonshot risk-taking business ventures like those in ARKK. With seemingly endless amounts of capital on tap and no imminent demand for profit, many of these companies knew nothing except a growth-at-all-costs approach. For a time and particularly during 2020 to mid-2021, stocks fitting this profile grew the fastest, resulting in ARKK’s unbelievable returns.
To put it mildly, times have changed.
Soaring inflation has forced the Fed to do a complete 180-degree turn. In announcing last week’s triple-rate increase, the Fed still “anticipates that ongoing increases in that range will be appropriate [and] in addition, we are continuing the process of significantly reducing the size of our balance sheet.”
Translation: ALL the things moonshot companies needed to grow (easy money, low rates, excessive risk taking, a dovish Fed) are gone. Party’s over.
The Fed’s pivot from expansionary to contractionary monetary policy “aims to quell unsustainable speculation and capital investment that previous expansionary policies may have triggered” (as per Investopedia). In other words, risk-taking moonshot business ventures aren’t just no longer encouraged or rewarded these days: now they’re punished.
The reason has to do with the way Discounted Cash Flow analysis–also called Discounted Cash Flow valuation, or DCF for short–affects the current market value of companies.
Discounted Cash Flow Analysis: How Inflation Brings Down Companies’ Stock Valuations
While the Discounted Cash Flow equation is a complex one, the question it attempts to answer is not: based on what the company is expected to earn in the future, what is it worth today? It does this by looking at two variables: expected future cash flows and the discount rate.
Expected Future Cash Flows
As discussed above, consider how hard it is to create a future expected cash flow for many of the companies in ARKK’s portfolio relying on nascent technologies and future industry potential that is difficult at best to quantify. Some examples from ARKK’s current top 10 holdings:
Zoom Video Communications (ZM) – Zoom became profitable during the pandemic. But Google and Microsoft have now included vastly improved videoconferencing with their business office productivity software packages. Will Zoom crowd them out and retain a dominating market share, or will they eventually become irrelevant as employees return to work and Microsoft and Google use their vastly larger value offerings to become the dominant players? Who knows.
Tesla, Inc. (TSLA) – Tesla has had a big head start with EVs and is highly profitable. But the rest of the industry is now 100% focused on an EV future. How will that affect Tesla’s future cash flows over the next 10 years? No idea.
Coinbase Global, Inc. (COIN) – I don’t even know where to start with this one. Cryptocurrencies were all the rage in 2021, but Coinbase just announced layoffs of nearly 20% of its workforce in order to preserve cash. To determine the future cash flows here, you’ve got to decide between the range of future estimated market cap for Bitcoin, Ethereum, and the crypto universe (good luck); how frequently holders will trade them vs. hold them; what Coinbase’s market share will be of that unknowable number, etc.
You can see the difficulty here.
ARKK’s Kryptonite: The Discount Rate
Of the two variables in estimating a company’s current valuation, the discount rate is the more sensitive and arguably important of the two. A relatively small change in the discount rate makes an outsized difference in the present value of a company, therefore of its stock.
Most valuation methods use the Weighted Average Cost of Capital as the discount rate. Simplifying, it has three primary components:
- Rf – The rate of a risk-free return (i.e., Treasury bond yields). Regardless of time frame, treasury bond yields have exploded due to the Fed. In the case of the 10 year yield it has increased some 6x from 0.6% to 3.6%. The higher the Rf used in DCF analysis, the lower the present value.
- Equity beta – The stock’s beta (beta is a measure of a stock’s volatility compared to the market-the more volatile, the more investors will want to be compensated for that additional risk). Earlier we discussed how ARKK’s volatility is greater than 98% of other ETFs. This crushes valuation for companies in ARKK because investors require additional compensation (in the form of lower stock price) to account for the significantly higher risk posed by the volatile stocks held by ARKK.
- Cost of debt – As interest rates rise, companies pay more for their debt. Cost of debt goes up for all companies when rates increase. Yet for newer, riskier, unprofitable companies with lower credit ratings, the cost of debt goes up much higher, again punishing ARKK-style companies even more than their peers.
Higher Rf, higher equity beta, higher cost of debt – it’s a triple whammy. And when it’s hard to properly estimate longer-term expected future cash flows for disruptive technology companies high on potential, low on cash and negative on profit, analysts and investors alike are wise to take a conservative view. Higher WACC/discount rate and lower (or lower confidence in) future cash flows, the lower the present value is for unprofitable growth companies contained within the ARKK portfolio.
Remember too, that inflation is certainly not over. It’s not tamed. It hasn’t even flattened yet. As depressed as valuations currently are, remember that the Fed has gone on record that rate increases will continue until inflation is tamed. Thus, Fed policy is crushing ARKK and the companies within it.
Again, as its inverse, ARKK’s loss is SARK’s gain. Let’s see how it’s showing up in the performance of SARK, compared to the S&P 500, ARKK and its top 10 current holdings by weight:
SARK returned 130% over the last year, vs. -13% for SPY and -68% for ARKK. (TradingView)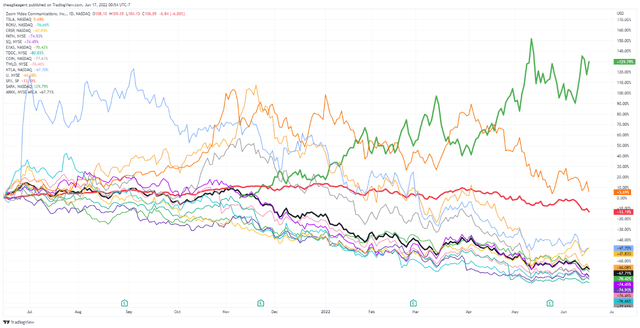
There’s a lot going on here, but the most important line is the green one, showing SARK’s 130% performance over the last year. TSLA has been trending down for a few months now but is the only one still beating the S&P 500 shown in red. The rest of ARKK’s top 10 holdings range from -48% for NTLA and an eye-popping -80% for TDOC. ARKK’s 1-year performance is -68%.
Conclusion: SARK as an Effective Inflation Hedge
Inflation, and the painful contractionary monetary policy necessary to quell it, erodes capital, leaving investors to search far and wide to preserve and grow it. Except for energy, every other sector of the market has been down this year-and with dramatically increased odds of recession over the last week, now even energy is starting to plummet. Crypto is not at all the inflation hedge it was supposed to be. Gold hasn’t been, well, worth its weight in gold so far this inflationary cycle. Even Simplify Interest Rate Hedge ETF (PFIX), a holding of mine custom-tailored for this purpose, hasn’t quite kept up.
Is there anything that can beat inflation?
SARK does. Quite handily.
SARK is beating the rise in CPI inflation by a factor of 2.6 to 1. Calculated by comparing SARK’s 130% 12 mo performance vs CPI’s estimated 50% rise during that same period. (TradingView)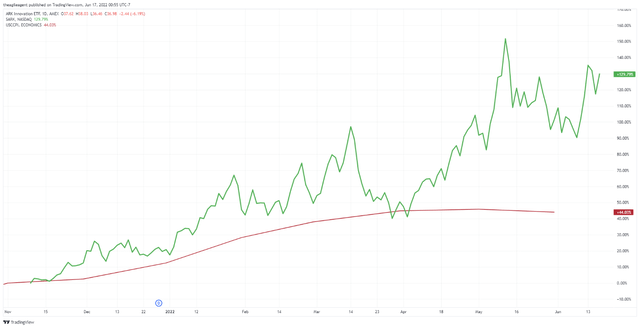
Me? I’ll take that any day.
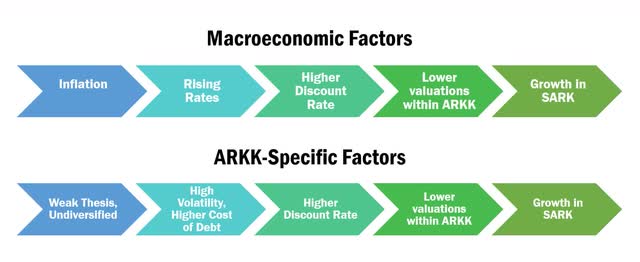
Macro and ARKK-specific factors both point to continued growth in SARK Recently there has been talk that “sentiment is so bearish, it’s bullish.” While that may be true in the short term, these same commentators recognize that the longer term outlook remains bearish for the market. While ARKK may experience some bear market rallies, its longer term is even more bearish for the market due to the factors below. Because ARKK’s loss is SARK’s gain, I rate SARK a Strong Buy.


Be the first to comment