

Kwarkot
Let’s a take a look at REIT performance year-to-date:
Yahoo Finance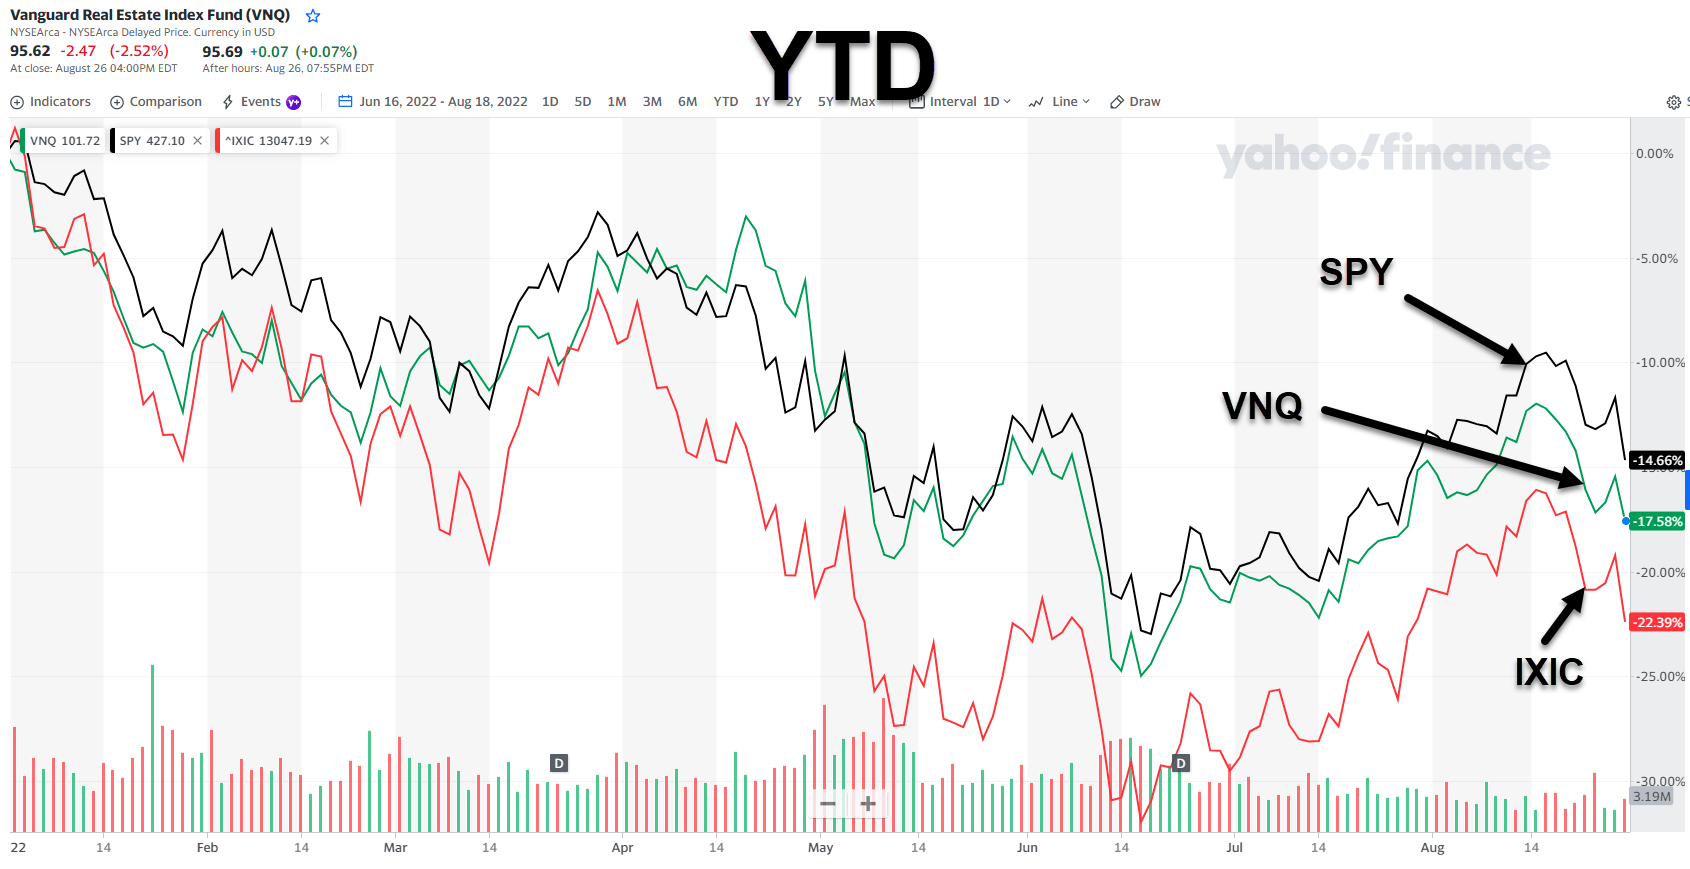
As you can see, the Vanguard Real Estate ETF (VNQ) is down by almost 18% YTD, sandwiched between the S&P 500 (SPY) and the NASDAQ (IXIC).
Remember that the VNQ is a large market cap weighted Index, so it includes over 170 companies, representing the good, bad, and ugly.
And I’m sure nobody likes to call their stock ugly, or at least admit they own it.
Last Friday Federal Reserve Chairman Jerome Powell said in a speech at a conference that the Fed is committed to bringing inflation down to its 2% goal, which means interest rates will continue to rise.
Meanwhile there are encouraging signs with regard to inflation – the Fed’s preferred inflation gauge – the personal consumption expenditures price index – showed a year-over-year rise of 6.3% in July, down from 6.8% in June.
This means the plan is working – higher interest rates, slower growth, and softer labor market conditions may bring down inflation. Powell explained,
While the lower inflation readings for July are welcome, a single month’s improvement falls far short of what the Committee will need to see before we are confident that inflation is moving down.
Mark Gatto, co-CEO of CION Investments explained,
The Fed’s commitment to moderating the demand side through ‘forceful and rapid steps’ implies that additional sharp rate increases are likely coming, which we believe will inflict even more pain for the traditional investment markets.
So, what can REIT investors expect over the next few months?
History Doesn’t Repeat Itself, It Rhymes
In a research report, Cohen & Steers explains,
Although sharp increases in interest rates may unsettle markets in the near term, history shows that the direction of the economy and job growth tends to have a greater impact on REIT returns than rising rates do.
In other words, the environment that may be pushing the Fed to raise rates is one that can benefit REITs in the form of higher rents while REITs’ characteristics can make them an inflation buffer.
Cohen & Steers puts REIT performance into perspective, by analyzing the 12 largest one-month increases in the 10-year U.S. Treasury yield dating back to 2000.
The data shows (below) that while REITs have underperformed equities in the immediate aftermath of significant yield increases, they have historically outperformed 3, 6 and 12 months after such increases.
Cohen & Steers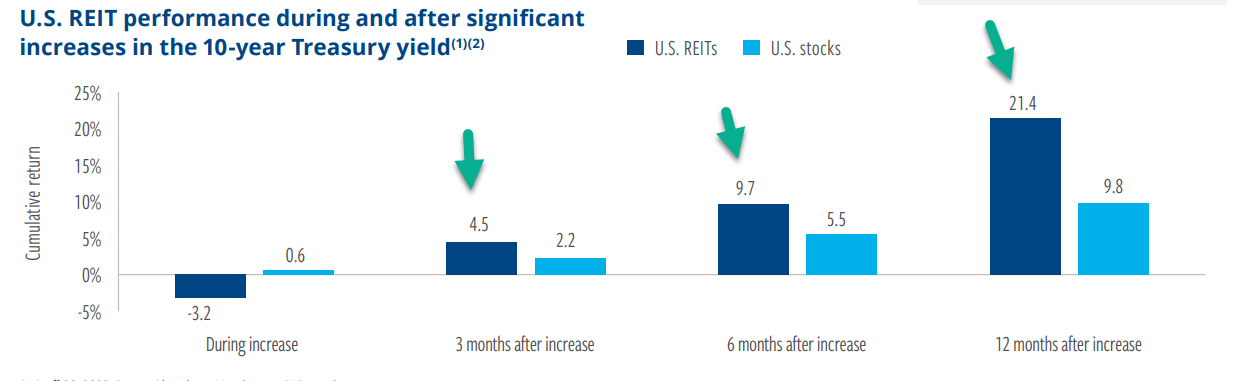
It seems that supply chains are consistently improving and should continue to bring inflation rates down, as the Fed begins to put more gas on the pedal. Powell warned on Friday,
While higher interest rates, slower growth, and softer labor market conditions will bring down inflation, they will also bring some pain to households and businesses.
What about real estate landlords?
As Cohen & Steers explains,
REITs typically enjoy operating margins of around 60%, reducing the effect of higher costs. In addition, higher costs for land, materials and labor can reduce the potential profits of development, raising the economic barriers to new supply and reducing potential competition for existing properties.
Traditional asset allocations may provide less safety to defend against a prolonged environment of higher inflation than real estate assets, which have historically performed well in elevated inflationary periods, as shown below:
Cohen & Steers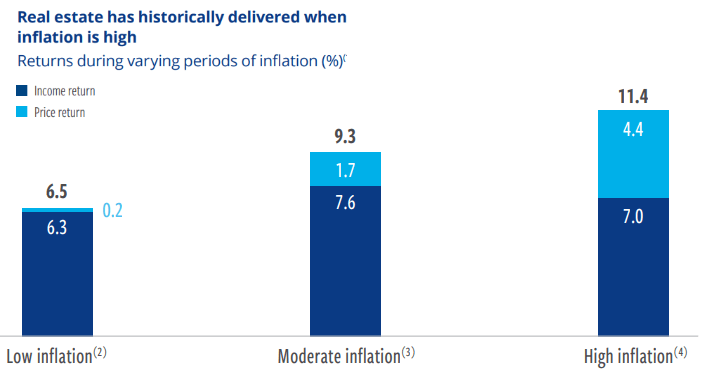
As evidence of solid REIT fundamentals, REIT Funds from Operations (or FFO) reached an all-time high of $19.6 billion, a 9.8% increase from last quarter. Nearly 84% of REITs reported increased FFO from a year ago.
Nareit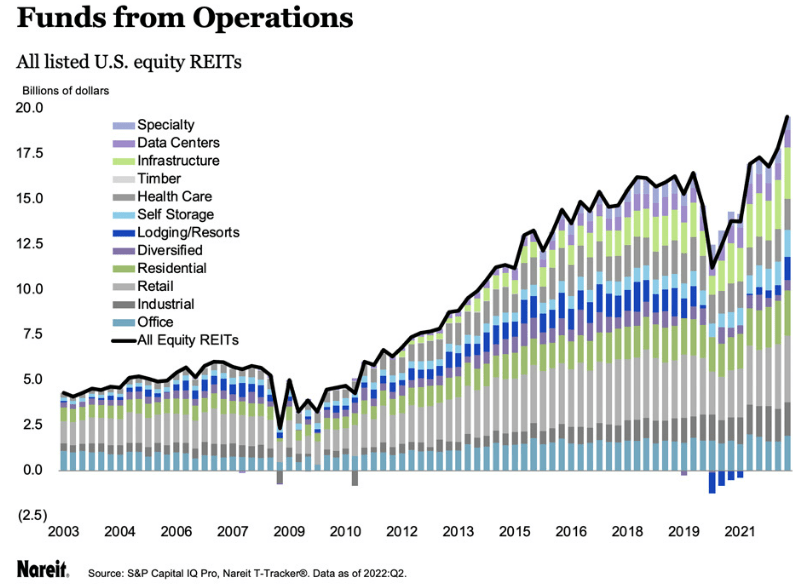
Also, occupancy rates of all REIT-owned properties increased to 93.7%, the first quarter in which they reached and exceeded pre-pandemic levels.
Beyond 2022, REIT dividend growth should remain attractive, thanks to the cash flow-focused nature of the business model and REITs tax-advantaged distributions. Cohen & Steers expects FFO to grow by 17% in 2022 and 7.9% in 2023, well above its historical average of 5.6%.
Cohen & Steers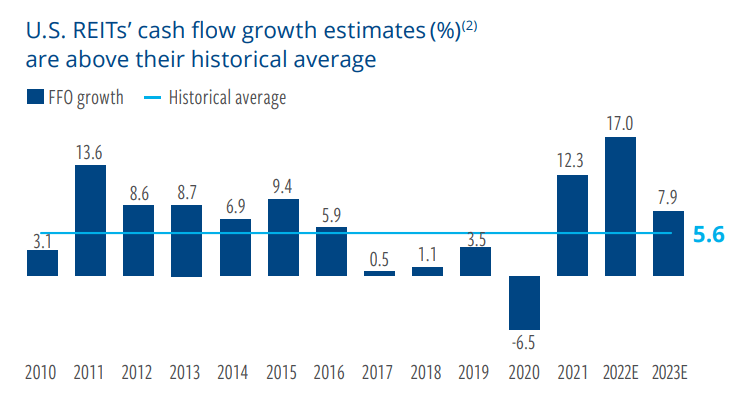
Now, let’s get down to business, so I can provide you with 3 of my favorite picks that we expect to rally by over 25% during the next 12 months.
Who’s Ready for a REIT Revival?
My first pick is Medical Properties Trust (MPW) that has fallen on hard times thanks in large part to a short thesis focused on the REIT’s largest operator, Steward Hospital.
Yahoo Finance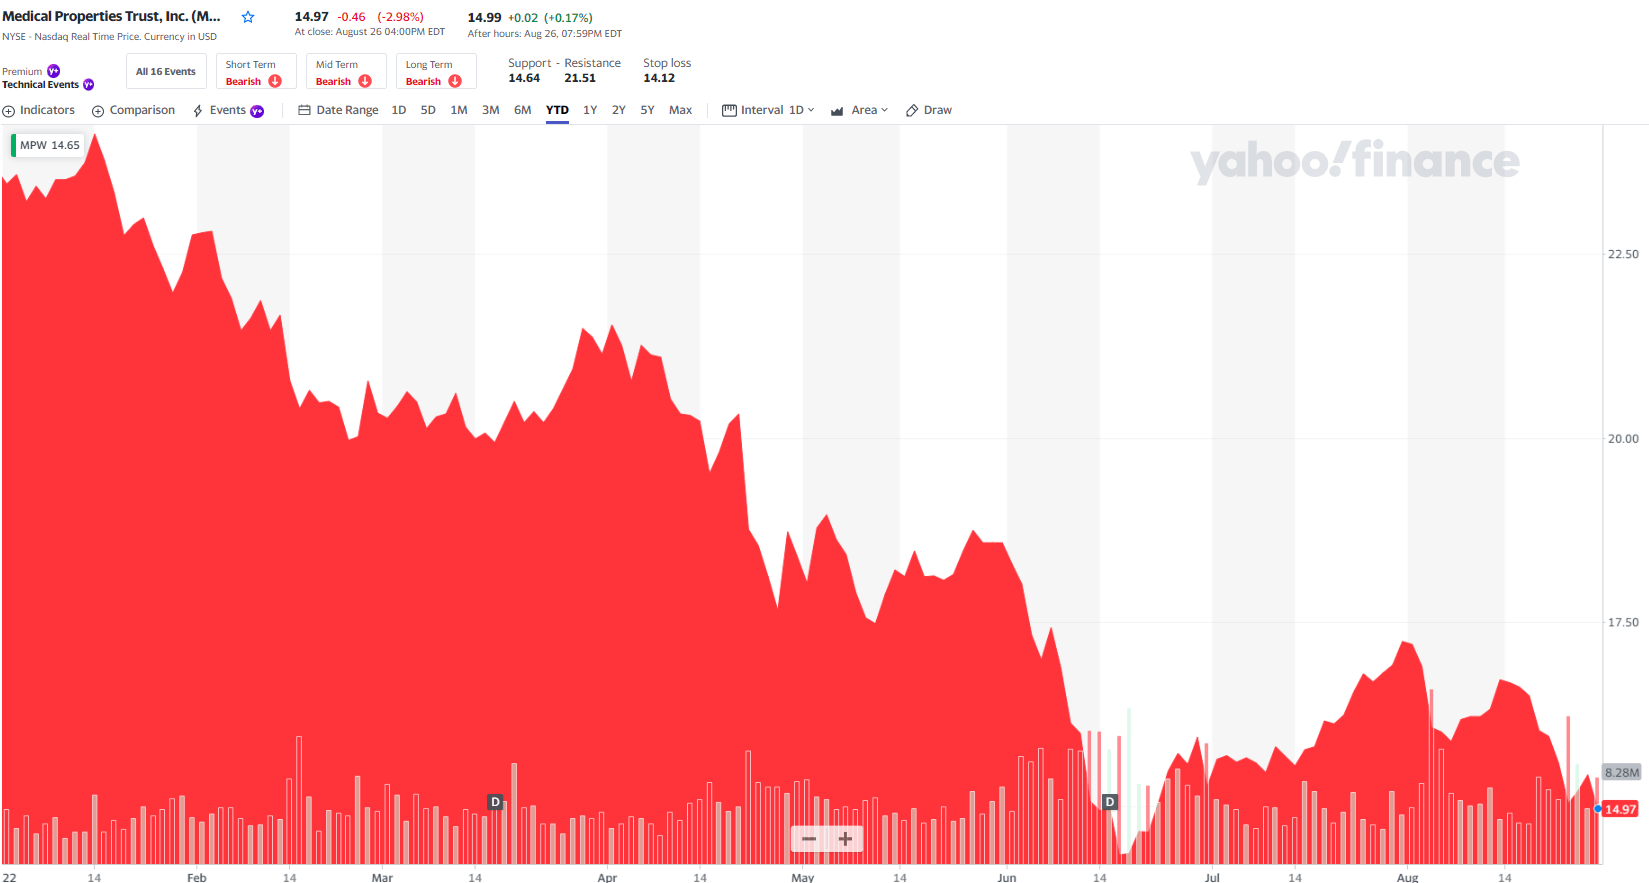
Fortunately, I just spent the least five hours putting together a granular research report in which we scored all of the Steward properties. Upon completing this report, I am reaffirming my Strong Buy as it relates to MPW, a deep conviction pick that is now yielding 7.8%.
I’m not concerned with the short thesis, especially since iREIT has done its homework, analyzing the underlying assets, and putting together our own model in which we look at the most vulnerable properties.
There’s little to question with regard to MPW’s valuation, as shares are now trading at 10.6x P/AFFO with a normal multiple of ~13.2x. The payout ratio as of Q2-22 is around 86% and given our latest research, we’re not too fearful of a dividend cut.
MPW is not the highest quality REIT in our coverage spectrum, yet we find the risk-reward setup extremely compelling which is why we added this name to our weekly high conviction report (we provide a weekly high conviction list for our members).
The upside is massive (+40% annualized returns) and we believe there are catalysts in place to support multiple expansion (i.e. monetizing Utah via JV or sale from Steward).
FAST Graphs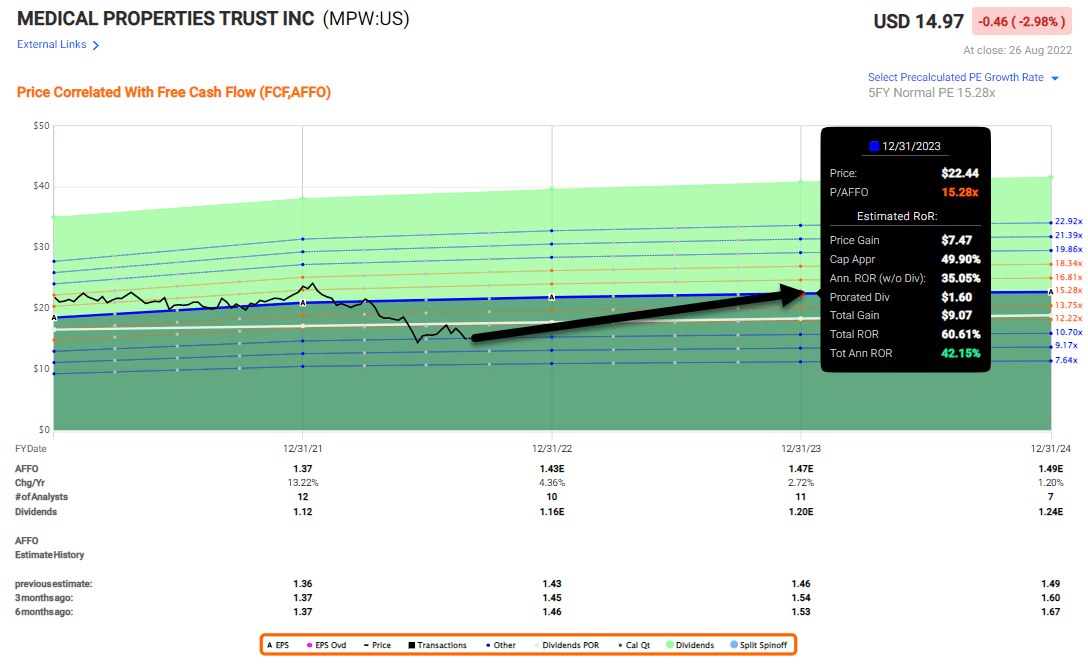
Our next REIT “revival” pick is SL Green (SLG), name we recently wrote about for our members at iREIT. As we explained,
The story is complex… and while there are considerable risks, the value at SL Green Realty’s current stock price is undeniable.
Yahoo Finance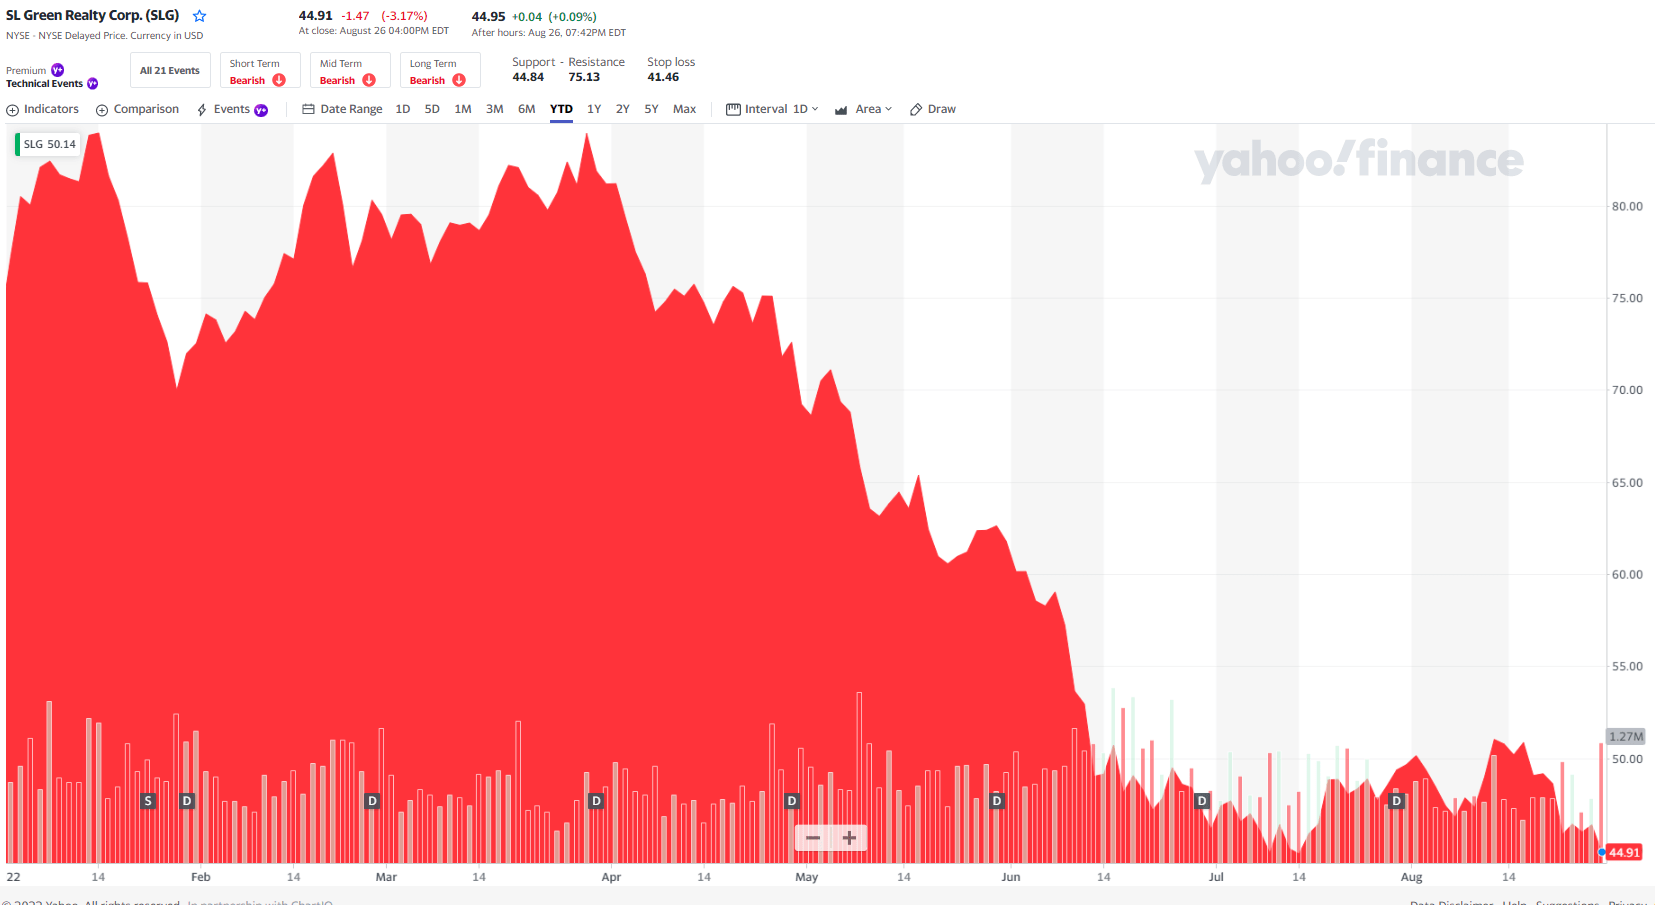
In a recent Barron’s article William McCormack explains,
SLG which operates SUMMIT at One Vanderbilt expects $20 million to $25 million in observatory net operating income this year and 1.85 million to 2.15 million yearly visitors when its new business stabilizes in 2024.
That’s just one signal that New York City is not down and out and as I explain in my article,
SLG’s dividend is currently 8.2%, the highest in decades. That’s partly because the stock is trading near 12-year lows. The dividend was at $0.85 quarterly pre-pandemic compared to $0.308 monthly today. That’s $3.40 annually then versus $3.72 now, plus we get the higher dividends monthly.
Before the pandemic, SLG traded for between 12x and 15x forward FFO estimates. It’s at 6.8x today, or a 50% discount to the midpoint. That means 100% upside potential from current levels with one of the most attractive dividend yields of any investment grade REIT while we wait.
We believe SLG offers very attractive risk-adjusted return below $47.50 per share making it a Strong Buy.
FAST Graphs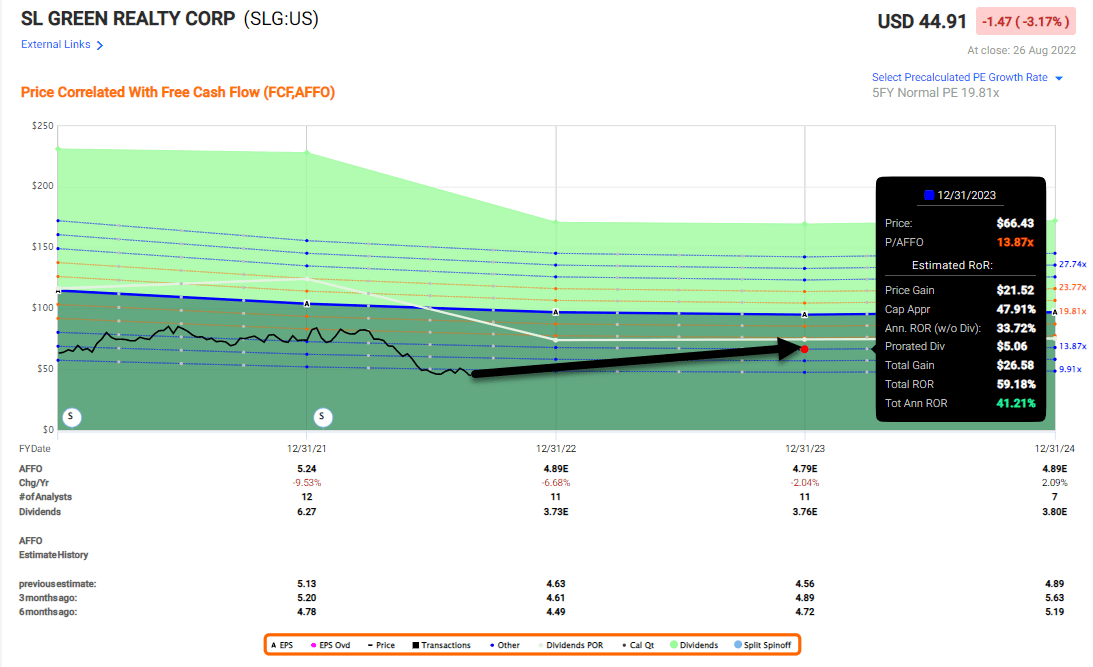
Our final REIT “revival” pick is a newbie to the mREIT sector, Chicago Atlantic (REFI).
Yahoo Finance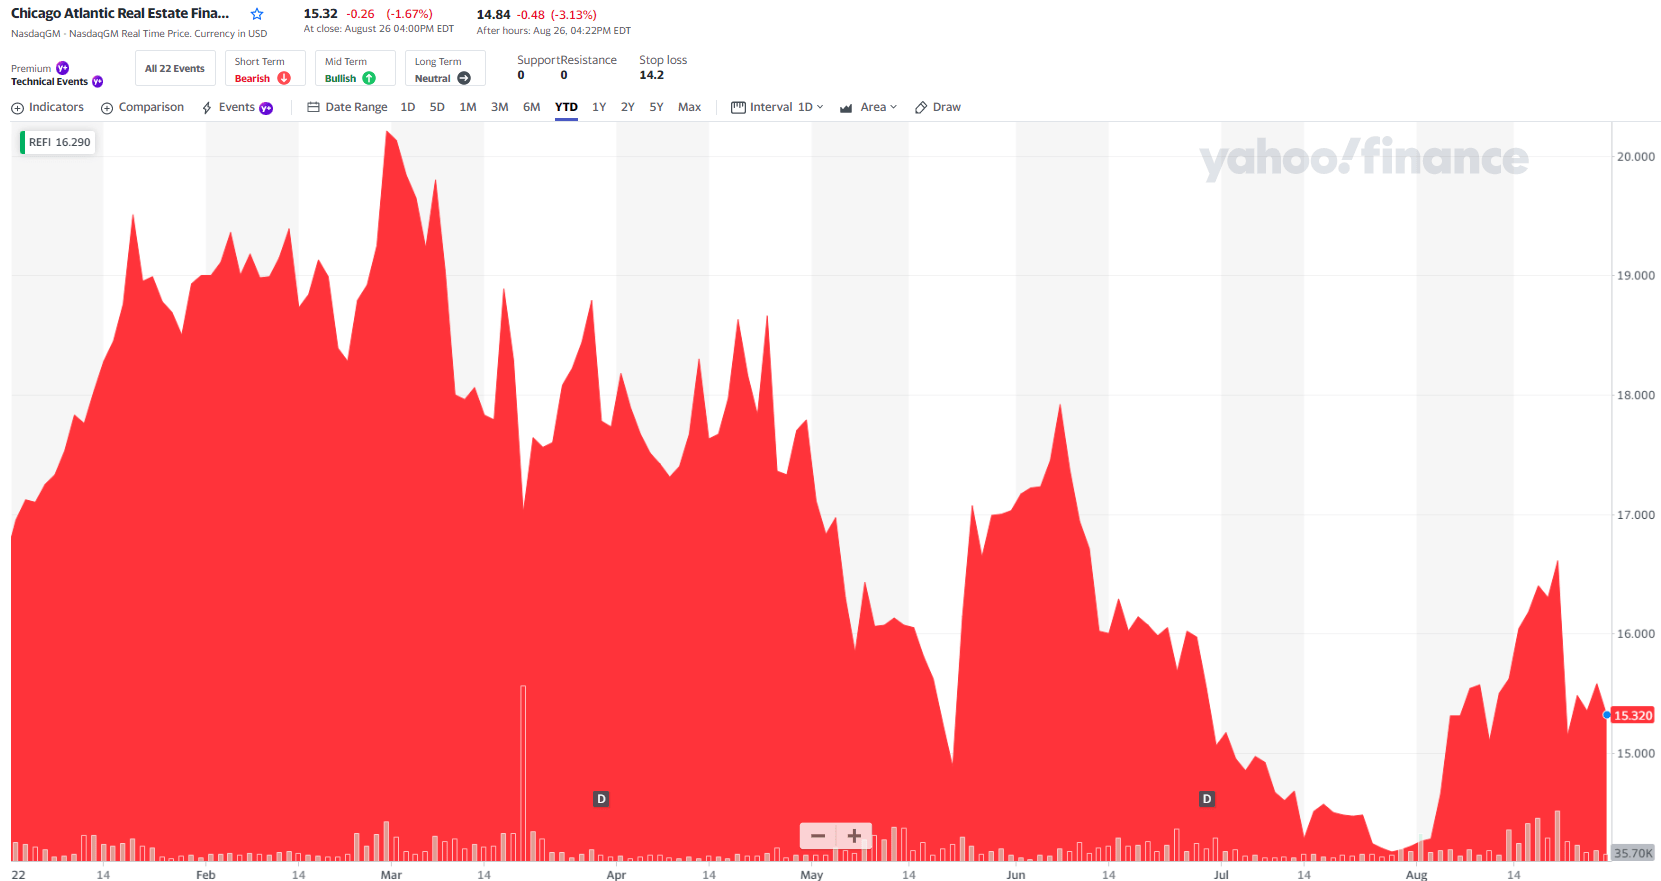
While there are risks to owning cannabis REITs, we recognize the value behind the REFI business model and potential for enhanced total returns in the months ahead. As we do quite often at iREIT, I recently spoke with the management team about the business model and they told me,
…we started in this space in 2018, started looking at the opportunities, obviously really looking for inefficient markets. We actually did our first loan in April of 2019 with our own money because we saw how compelling of an opportunity this was.
And at that point, that’s really where we developed our investment thesis and what we do. And that’s financing cannabis and related businesses focused on, what we would say are the limited license states or east of the Mississippi.
To be clear, REFI is a mortgage REIT, so the company does not actually own the assets, instead they lend to cannabis operators. I thought this comment from management was rather intriguing,
I think it’s important to note if we’re being compared to an equity REIT, that we are the beneficiaries of an all asset lien with UCC-1 filings. As a lender, we have the ability to actually get stock pledges of the operating entities that hold the licenses they’re buying. In event of default, we could force our will, if necessary, and step into the shoes of the operator, which I think is a little harder to do on the equity REIT side because of the lack of having the stock pledges in place.
So you see, this is a good reason that we enjoy these interviews, because it provides us with insight that we could not get from financial reports.
REFI is also attractive based on its risk/reward setup – shares are trading at just 8.5x (P/E) with a juicy dividend yield of 12.3%. We could see shares return in excess of 40% over the next year or so. (Keep in mind, REFI is a small cap and we have a speculative rating on the shares for that reason).
FAST Graphs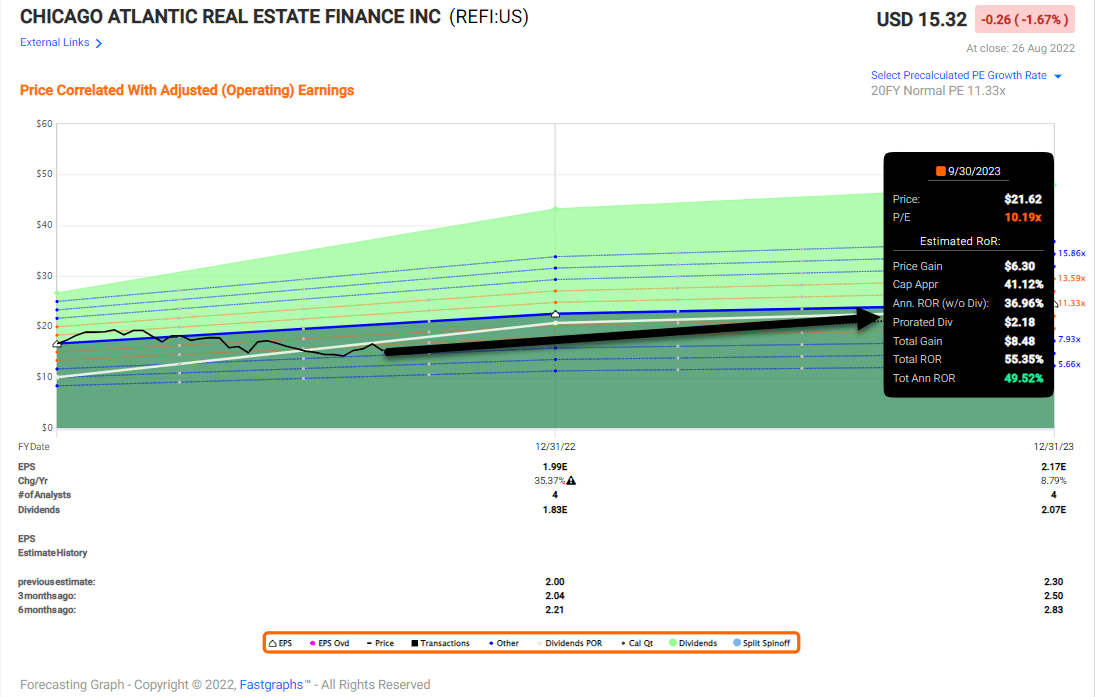
In Closing…
I’ll remind you as I do often, do not put all of your eggs in one basket.
While these three REITs offer compelling total return prospects, you must always maintain discipline if you seek to harvest optimal long-term value.
It’s only because of our intense research at iREIT that we provide you with these picks and much of our time is focused on underwriting income statements, balance sheets, and property-level fundamentals.
We encourage you to add more REITs to your portfolio as we believe the current market conditions are ripe for investors to reap the rewards.
While all three of these REITs (referenced in the article) are generating above average yields, we consider them to be mispriced, and that could result in some very attractive total returns.
advisor.visualcapitalist.com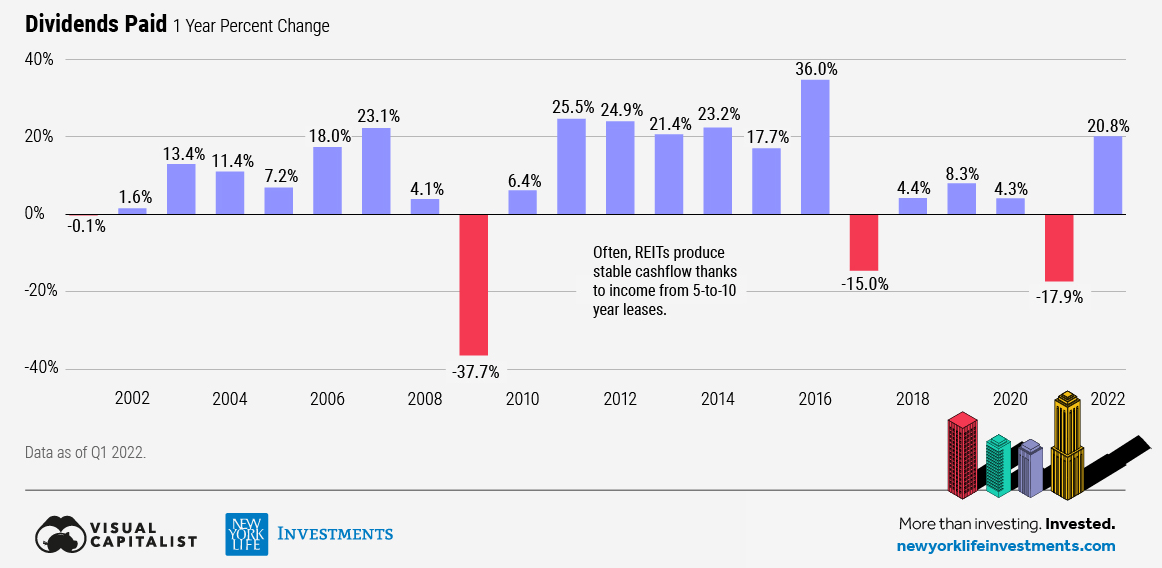
Thank you for reading and I look forward to your comments below!
Be the first to comment