Joe Raedle
The Fidelity MSCI Consumer Staples ETF (NYSEARCA:FSTA) is a relatively cost-efficient fund (expense fee = 0.08%) that gives investors broad diversification in sector that over the past year has outperformed the S&P500 by 13%. Consumer Staples if one of those boring sectors (like utilities, and some would even say Energy, but that sector has been anything but boring this year) that generally outperform when the broad market averages struggle. That being the case, investors building and managing a well-diversified portfolio should consider allocating some capital to Consumer Staples or order to smooth-out the portfolio’s returns and act as somewhat of a ballast during uncertain times and/or weak markets.
Investment Thesis
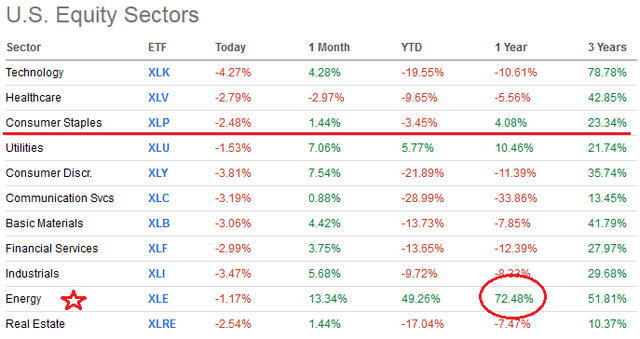
As mentioned earlier, the Consumer Staples sector is one of only three sectors in the green over the past year and during the 2022 bear-market:
This graphic serves as compelling evidence for why investors should build, and hold throughout the market’s up-n-down cycles, a well-diversified portfolio. Obviously, investors holding an allocation to the Energy Sector – which, up until the last year-or-two had been the worst sector of the entire market (by far …) over a 10-year time frame – are likely ecstatic over the total returns (capital appreciation & strong dividend growth) they have gotten from their energy holdings. That said, the 3-year column on the far-right of the graphic also shows the value of having a well-diversified portfolio because the returns by sector vary significantly.
The Fidelity FSTA ETF holds all of the top-brand consumer staples companies that you would expect it to own and yields 2.26% – which is 68 basis points above the S&P500 yield (1.58%). Today, I’ll take a close-up look at the FSTA ETF to see what it might offer the well-diversified investor going forward.
Top-10 Holdings
The FSTA top-10 holdings are shown below and equate to what I consider to be a moderately concentrated 62% of the entire 110 company portfolio:
Fidelity Investments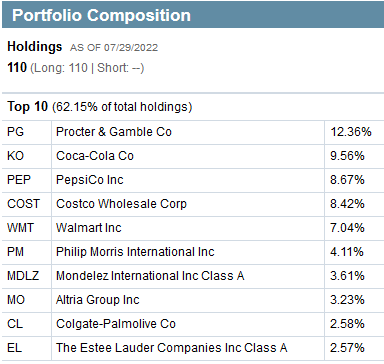
The #1 holding is Procter & Gamble (PG) with a 12.4% weight. P&G is arguably the most dominant consumer staples company on the planet. In my opinion, the company deserves such a high weight because it has demonstrated it can generate strong free-cash-flow throughout the market-cycles (see Procter & Gamble is no Gamble). The maker of leading global brands like Head & Shoulders, Pantene, Olay, Old Spice, Secret, Braun, Gillette, Crest, Oral-B, Downy, Vicks, Cascade, Dawn, Febreze, Pampers, Luvs, Tampax, Bounty, and Charmin is currently trading with a forward P/E = 24x and yields 2.5%. The stock is flat over the past 12-months.
Coca-Cola (KO) is the #2 holding with a 9.6% weight. Coke stock is up 13.6% over the past year and currently yields 2.7%. Coke delivered a strong Q2 EPS report last month that was a beat on both the top- and bottom-lines.
With a 8.4% weight, Costco (COST) is the #4 holding and has a significantly higher weight as compared to peer retailer Walmart (WMT). Of the two, Costco has been the clear out-performer here while Walmart got cross-ways with inventory management and has simply mirrored the S&P500 over the past year (i.e. down):
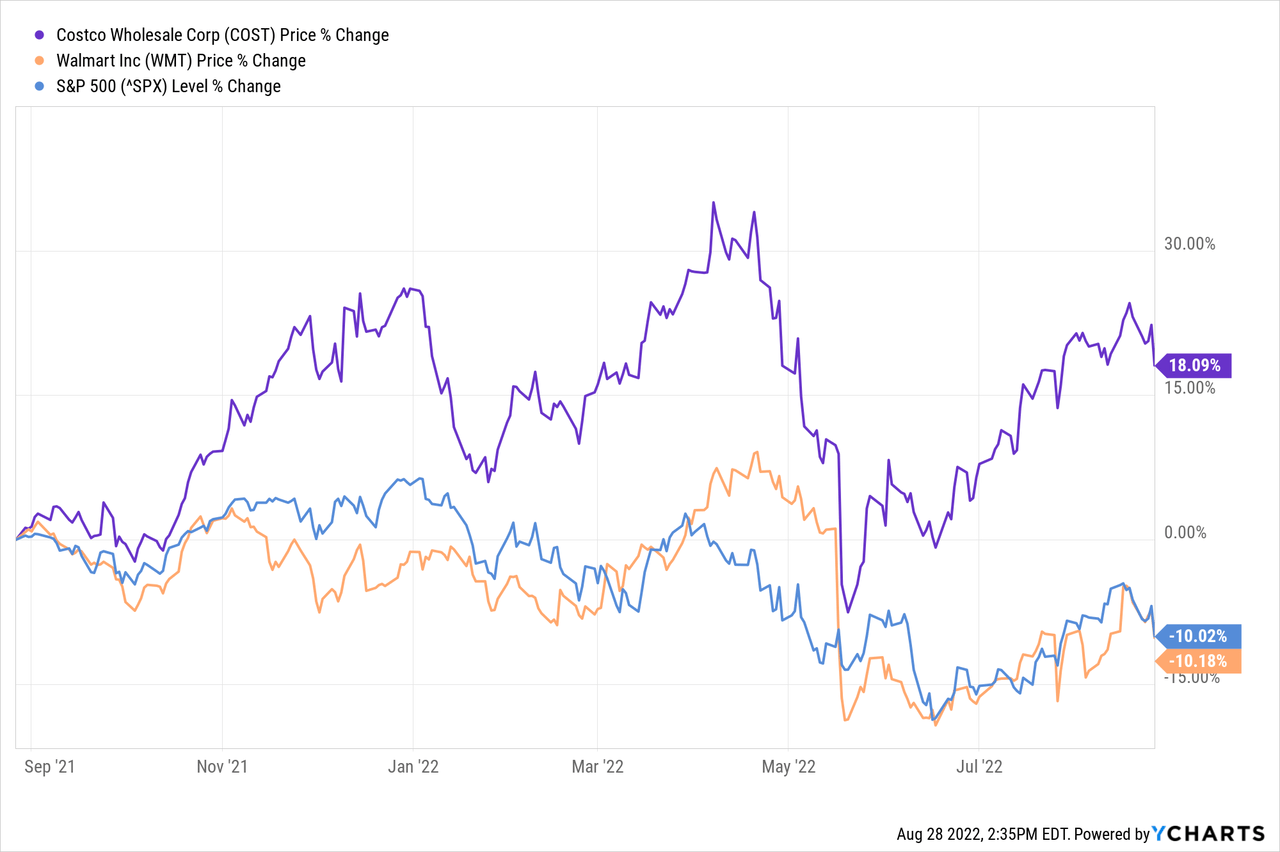
Costco’s comps were up 10% in July. The stock trades with a quite lofty forward P/E = 40x and yields only 0.64%. On the other hand, after a big stock-drop back in June, WMT is currently yielding 1.69%.
In aggregate, tobacco companies Philip Morris (PM) and Altria (MO) equate to 7.3% of the portfolio and deliver strong income for the portfolio with yields of 5.18% and 7.9%, respectively.
Estee Lauder (EL) rounds out the top-10 holdings with a 2.6% weight. At one point after the worst of covid-19 appeared to have passed, make-up and hair-care products were thought to be promising investment themes given the “open-up” and travel narrative. However, EL is down 22% over the past year yet still trades at a relatively lofty forward P/E=34x.
Fidelity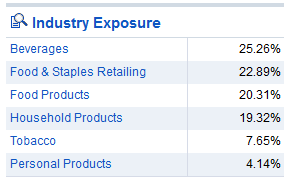
As can be seen by the graphic above, the FSTA portfolio is most highly exposed to the beverage, food & food products, and staples industries. Given the defensive nature of the Consumer Staples sector, the portfolio trades at a significant discount to the S&P500 on a number of key valuation metrics and is therefore considered a less-risky investment at the current time:
Fidelity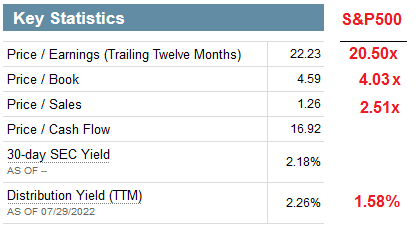
Performance
The long-term performance track-record of the Fidelity FSTA consumer staples ETF is shown below and has demonstrated a very solid five-year average annual return of 8.35%:
Fidelity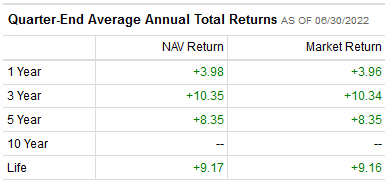
The graphic below compares the five-year price action of the FSTA ETF with peers the Consumer Staples Select SPDR (XLP), the Vanguard Consumer Staples ETF (VDC), and the iShares Global Consumer Staples ETF (KXI):
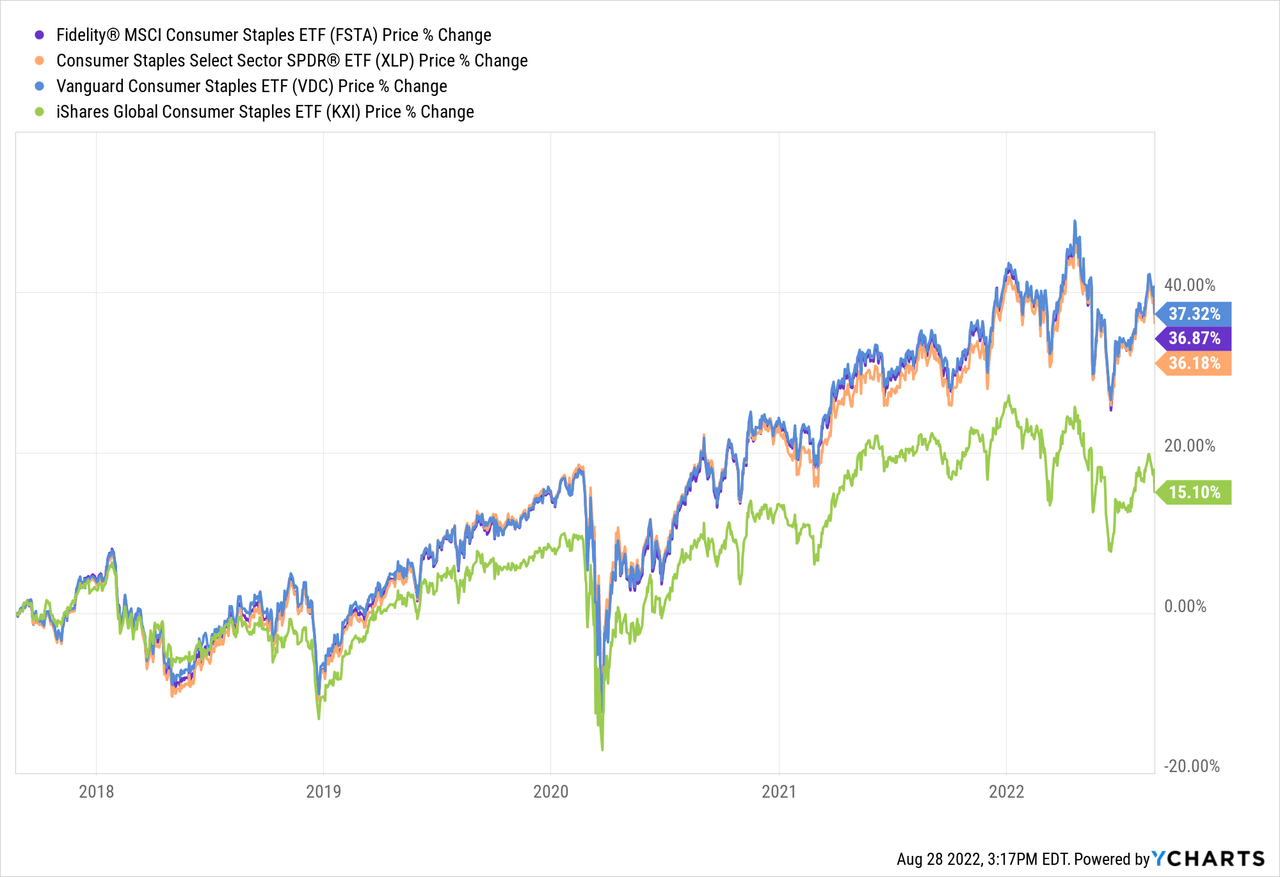
As can be seen, the FSTA ETF was only edged-out by the Vanguard ETF, while the iShares KXI ETF appears to have paid the price for more global exposure to the sector.
Risks
The Consumer Staples sector is not immune from the fundamentals of the current macro-environment: high inflation, rising interest rates, the continued impact of covid-19 on supply-chains and lock-downs, and Putin’s horrific war-of-choice on Ukraine that, combined with sanction placed on Russia by the United States and its Democratic & NATO allies, has effectively broken the global energy & food supply chains. Any or all of these factors could lead to a slowing of the global economy and/or a recession that would negatively affect global demand for consumer staples.
In addition, given the headwinds the above factors have on consumers, you could see them trade-down from relatively higher-priced popular name brands (i.e. think P&G, the #1 holding in FSTA) to discount off-brands. However, note the portfolio also has strong positions in Costco & Walmart which are well positioned to benefit from such a change in consumer behavior (although perhaps not as much as discount stores like Dollar General (DG), which is not even held in the FSTA portfolio).
The FSTA is a 100% domestic fund. That being the case, foreign currency headwinds as a result of the strong US dollar can reduce earnings of the companies within the portfolio and therefore negatively affect potential dividend increases.
Summary & Conclusion
The Fidelity FSTA ETF is a solid choice for exposure to the Consumer Staples sector. With a 0.08% expense ratio, it is a relatively cost-efficient fund and somewhat surprisingly is more so than the Vanguard VDC ETF, which has an expense fee of 0.10%. FSTA’s 2.26% yield is 68 basis points above that of the S&P500 yield and provides investors with a modicum of income and, as a result, some downward price protection in weak markets. All that said, given current market volatility as a result of Fed Chairman Powell’s recent “Fed Speak” regarding its commitment to fighting inflation, the best I can rate the FSTA ETF now is a HOLD. However, for investors who are looking to add exposure to the Consumer Staples sector as a sleep-well-at-night ETF (“SWAN”), they should consider putting the FSTA ETF on their watch-list in order to take advantage of market volatility for a better entry point. FSTA closed Friday at $44.88. I find it attractive at ~$40.50, which would equate to a yield of 2.5%.
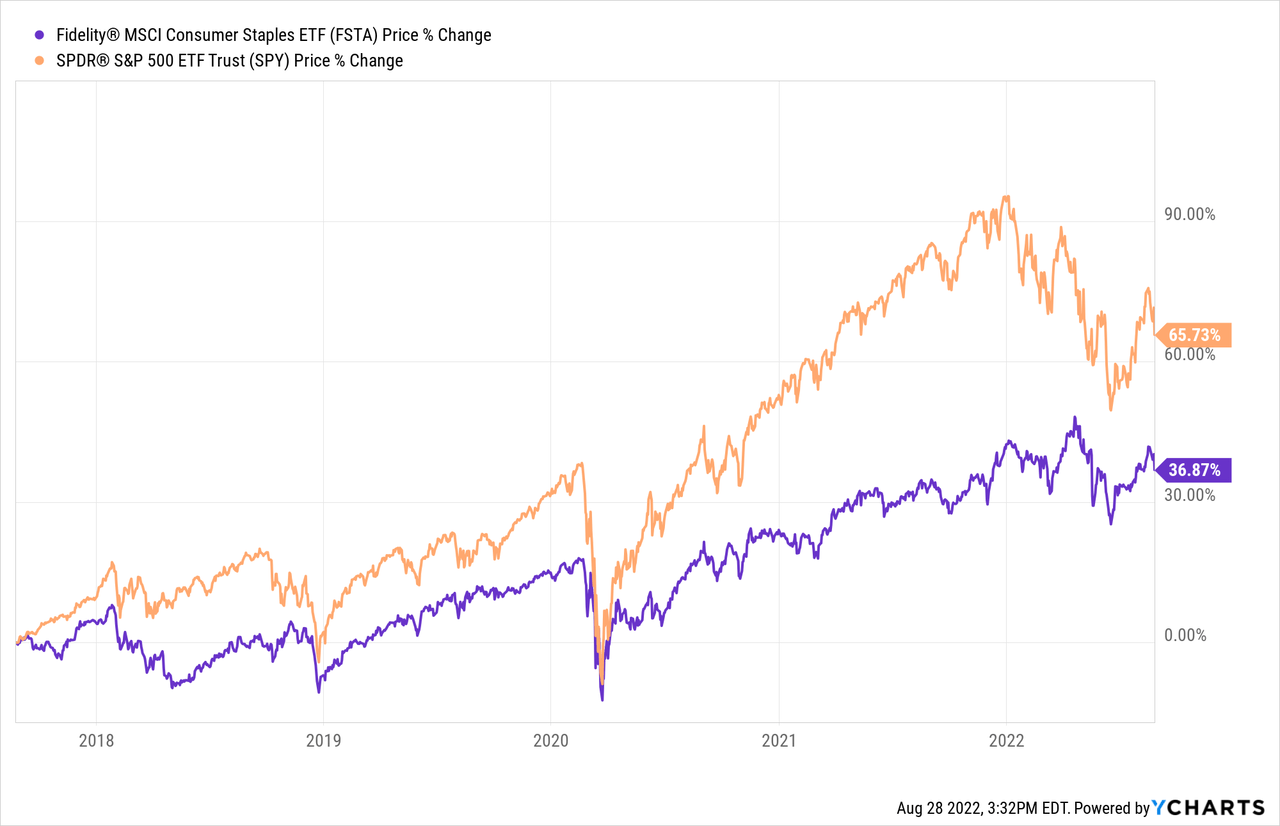
I’ll finish with a chart of the FSTA ETF versus the S&P500 over the past five years and remind well-diversified investors that any allocation to the Consumer Staples sector should be considerably less than that to which they are exposed to the S&P500. For example, investors with a $1-2 million portfolio might have as much as 50% in the S&P500 and perhaps only 4-6% in Consumer Staples (depending on age and many other factors).


Be the first to comment