


Roman Tiraspolsky/iStock Editorial via Getty Images
The Toronto-Dominion Bank (NYSE:TD) reported fiscal Q3 results on August 25th, beating expectations on both earnings and revenue. The Q3 results were particularly notable because Royal Bank of Canada and Scotiabank reported weak earnings earlier in the week. The Canadian and U.S. retail banking lines delivered record revenues and the wealth management business increased its Canadian market share. Management comments indicate that TD anticipates completing the merger with First Horizon Bank and the acquisition of Cowen, a boutique investment bank, early in FY 2023. Both of these transactions add to the depth and breadth of TD’s business lines.
Seeking Alpha
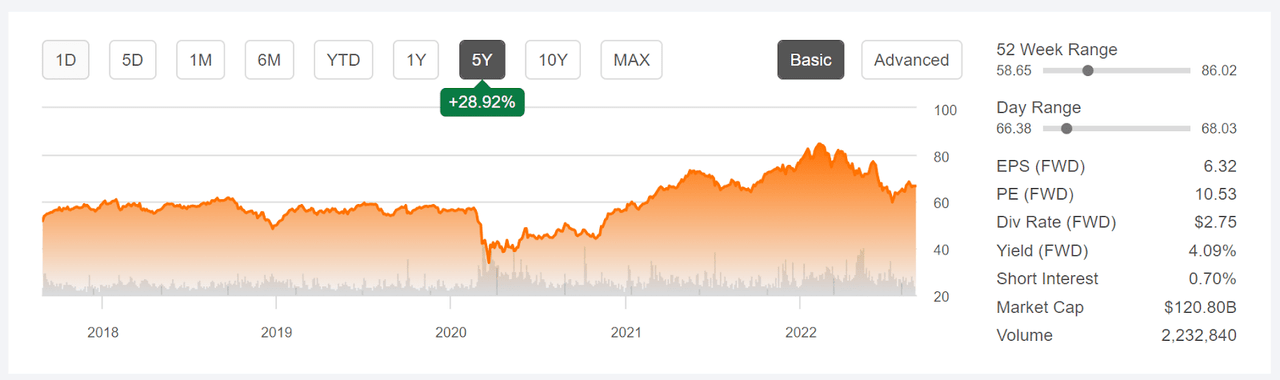
Above is 5-Year price history and basic statistics for TD
An investment in TD was basically dead money in the 2018-2019 period. The shares started 2018 at about $59 and ended 2019 at about $56. After taking a bit early in 2020 due to COVID, the shares marched steadily upwards, reaching a 12-month high of $84.58 on February 10, 2022. Since then, the shares have declined about 21% to reach the current level, $66.6.
The FY Q3 results mark the 9th consecutive quarter that earnings have beaten expectations, although the rate of earnings growth has slowed dramatically over the past year. The consensus outlook for EPS growth over the next 3 to 5 years is 7.04% per year.
ETrade
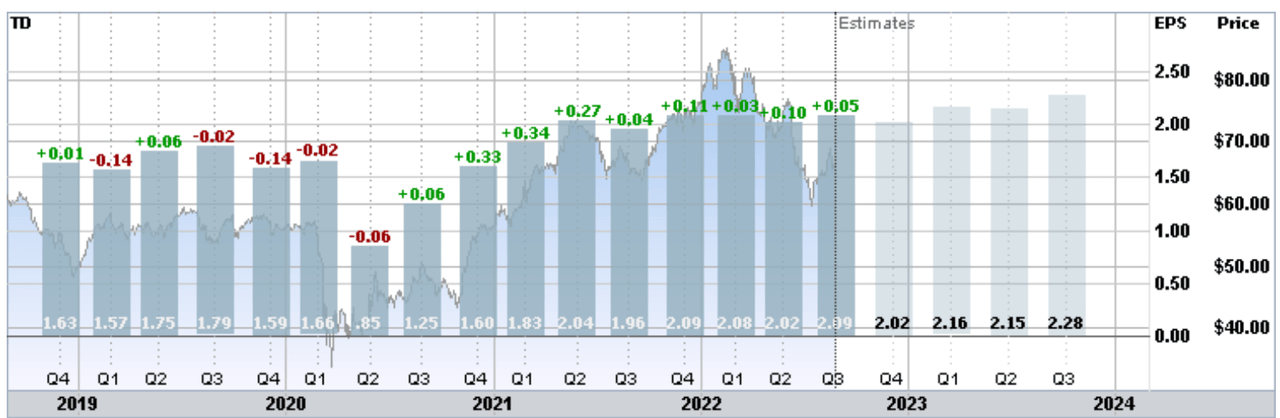
Historical (4 years) and estimated future quarterly EPS for TD given above. Green (red) values are amounts by which EPS beat (missed) expectations
TD is building an attractive dividend growth record. The trailing 3-, 5-, and 10-year annualized dividend growth rates are 8.3%, 9.3%, and 7.1% per year, respectively. With the 4.1% forward dividend yield, the Gordon Growth Model suggests that expected total returns for TD may be in the range of 12% per year. This estimate is predicated on future dividend growth being in line with historical values.
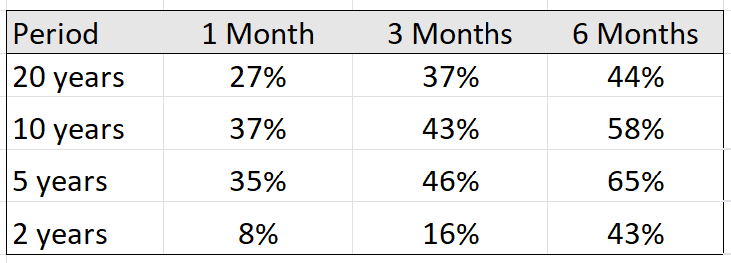
One of the standard questions with bank stocks is how they will respond to changes in interest rates. A straightforward way to test this sensitivity is to look at the correlation between the stock return and changes in Treasury bond yield (here is a study from the Chicago Fed that applies this approach to insurance companies). A positive correlation indicates that rising rates tend to be good for a company, and vice versa. I have calculated the rolling correlations between total return on TD and the percentage change in 10-year Treasury yield for the last 2-, 5-, and 10-, and 20-year periods. The correlation between TD’s 3-month return and the 3-month change in 10-year Treasury yields, using the last 5 years of data, is 46%, for example.
Geoff Considine
Correlation between total return on TD and percentage change in 10-year Treasury yield for rolling 1-, 3-, and 6-month periods over the last 2, 5, 10, and 20 years given above.
There is a consistent positive correlation between TD’s total returns and percentage changes in the 10-year Treasury yield, suggesting that rising rates tend to be favorable for returns. This pattern is fairly stable over the last 20 years, although the strength of the correlation is higher for longer 3- and 6-month periods than for 1-month periods. This is probably indicating that the share price response to changes in bond yields is not immediate, which is not surprising.
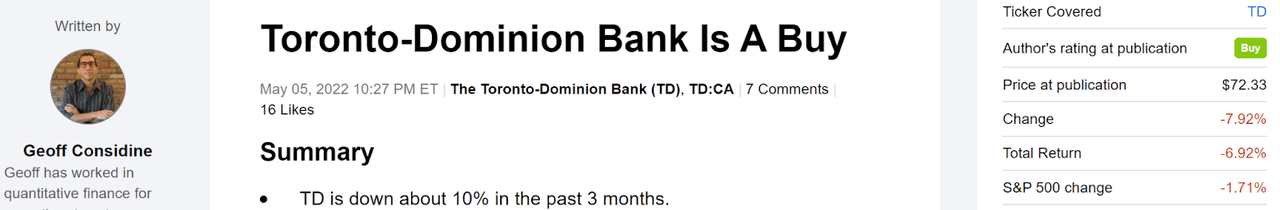
I last wrote about TD on May 5, 2022, almost 4 months ago, and I assigned a buy / bullish rating. The fundamentals looked solid, and the valuation was reasonable. The Wall Street consensus rating was neutral, albeit with a consensus 12-month price target that implied a total return of about 20%. The analysts’ overarching concern was that rising rates, while improving TD’s net interest margin, would also tend to correspond to slower economic growth and higher credit risk. Along with looking at the fundamentals and the Wall Street consensus outlook, I also consider the outlook implied by the prices of call and put options on a stock, the market-implied outlook. At the start of May, the market-implied outlook was bullish to early 2023, with moderate volatility.
Seeking Alpha
Previous analysis of TD and subsequent performance vs. the S&P 500 above.
For readers who are unfamiliar with the market-implied outlook, a brief explanation is needed. The price of an option on a stock is largely determined by the market’s consensus estimate of the probability that the stock price will rise above (call option) or fall below (put option) a specific level (the option strike price) between now and when the option expires. By analyzing the prices of call and put options at a range of strike prices, all with the same expiration date, it is possible to calculate a probabilistic price forecast that reconciles the options prices. This is the market-implied outlook. For a deeper explanation and background, I recommend this monograph published by the CFA Institute.
Since my last analysis, TD has reported two solid quarters of earnings, but the share price has lagged. In light of the just-reported results for FY Q3, along with the Fed Chairman’s recent comments suggesting further rate increases, I have calculated an updated market-implied outlook for TD to the start of 2023 and I have compared this with the current Wall Street consensus outlook in revisiting my rating.
Wall Street Consensus Outlook for Toronto-Dominion Bank
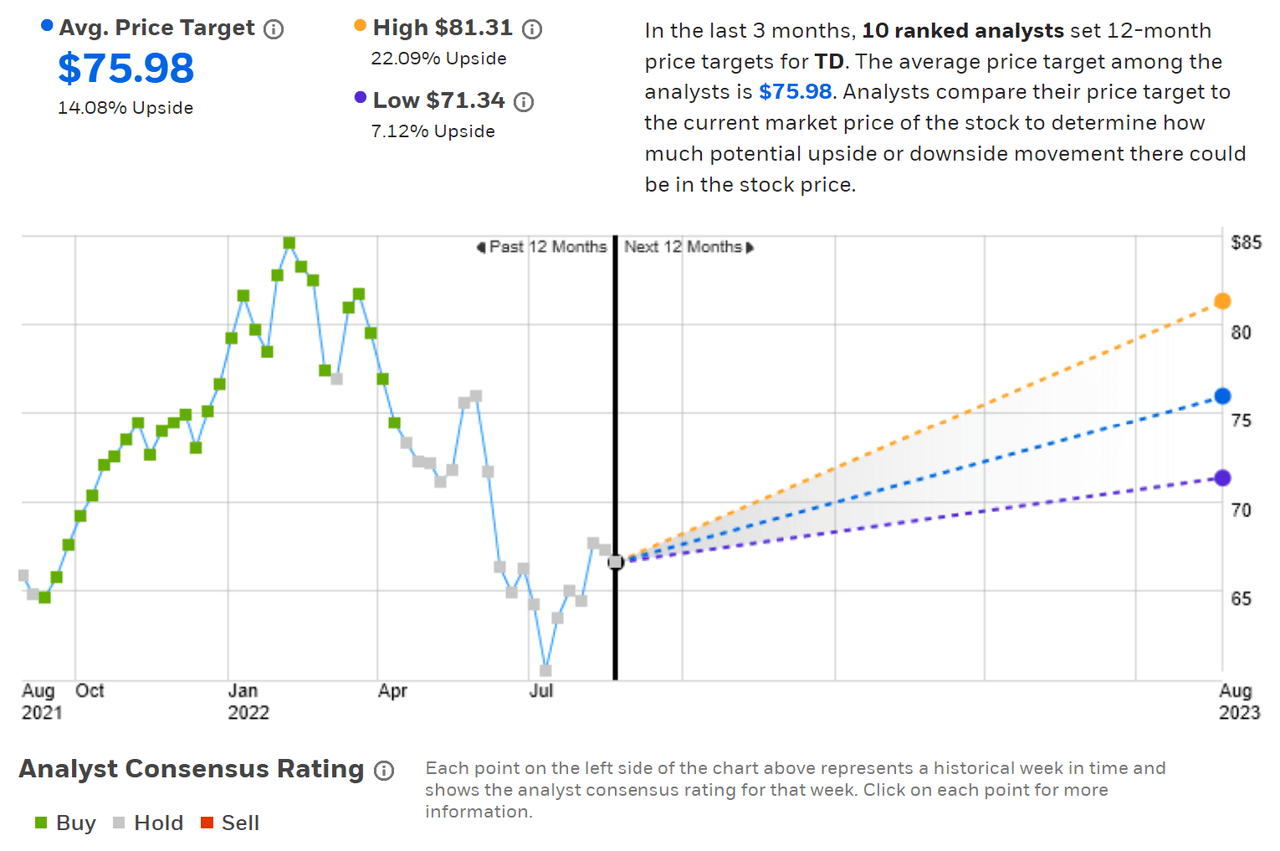
ETrade calculates the Wall Street consensus outlook by aggregating the views of 10 ranked analysts who have published ratings and price targets in the past 3 months. The consensus rating is neutral, as it has been since mid-April. The consensus 12-month price target is 14.1% above current share price, implying an expected return of 18.2% over the next year. The consensus 12-month price target has dropped over the past 4 months, from $84.04 in early May to $75.98 today. The spread in the individual price targets is fairly low, with even the lowest of the 10 ranked analysts predicting 7.1% in price appreciation (11.2% total return).
ETrade
Wall Street analyst consensus rating and 12-month price target for TD above
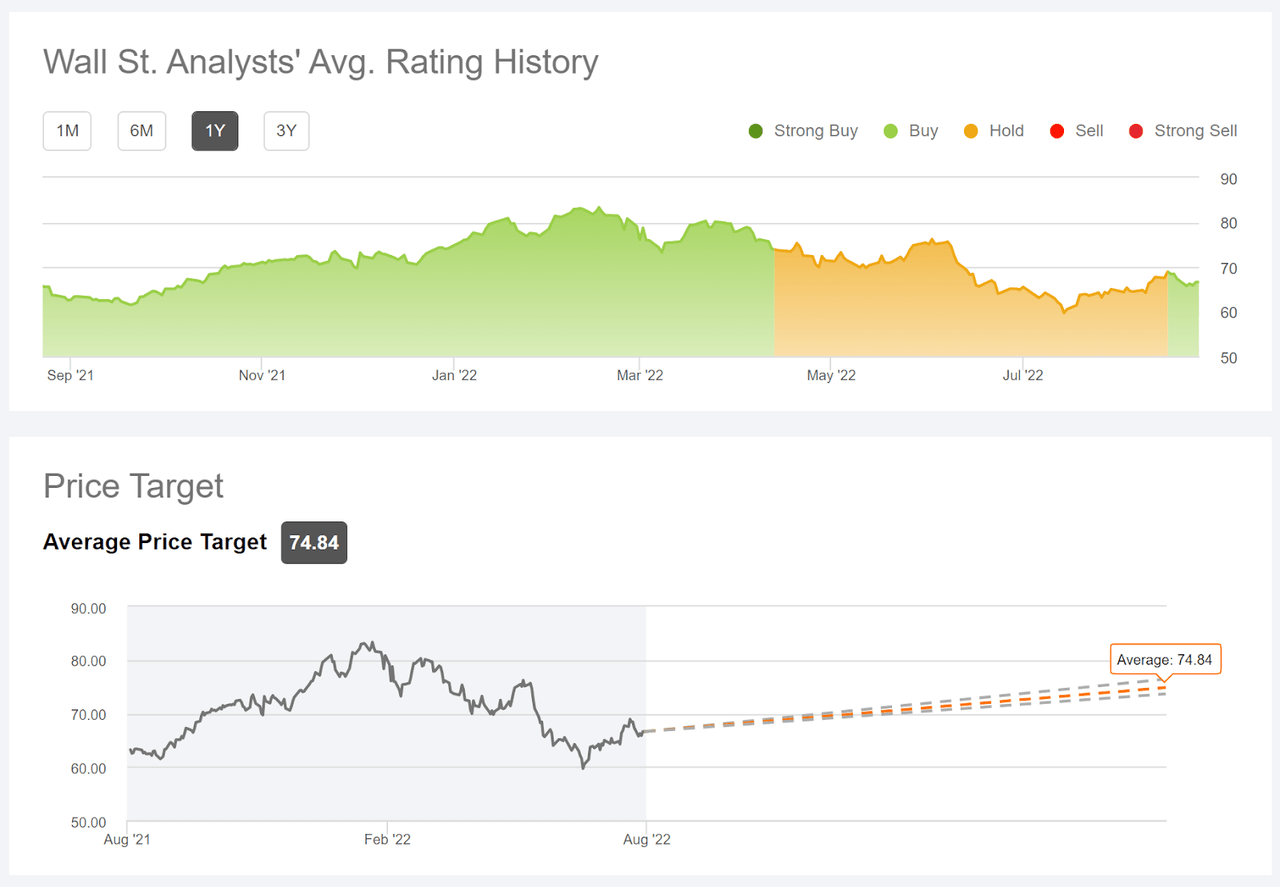
Seeking Alpha’s version of the Wall Street consensus outlook uses price targets and ratings from 16 analysts who have published their views over the past 90 days. The consensus rating has recently shifted from a hold to a buy, and the consensus 12-month price target is 12.4% above the current share price, for an expected total return of 16.5% over the next year.
Seeking Alpha
Wall Street analyst consensus rating and 12-month price target for TD above.
While ETrade’s version of the consensus outlook remains neutral, the recent shift to a buy rating in Seeking Alpha’s Wall Street consensus, along with consensus 12-month price targets that imply a total return of 16.5% to 18.2% suggests a generally favorable outlook for TD. A 12-month total return in this range would be attractive, given TD’s moderate-to-low volatility and beta. According to PortfolioVisualizer.com, the trailing 5-year beta (with respect to the S&P 500) is 0.95 and the 5-year annualized volatility is 22.5%. For context, PortfolioVisualizer.com calculates annualized volatility of 30% for Bank of America (BAC) over the same period.
Market-Implied Outlook for TD
I have calculated the market-implied outlook for TD for the 4.8-month period from now until January 20, 2023, using the prices of call and put options that expire on this date. I chose this specific expiration date to provide a view into early 2023 and because the options expiring in January are far more actively traded than for any later expiration dates.
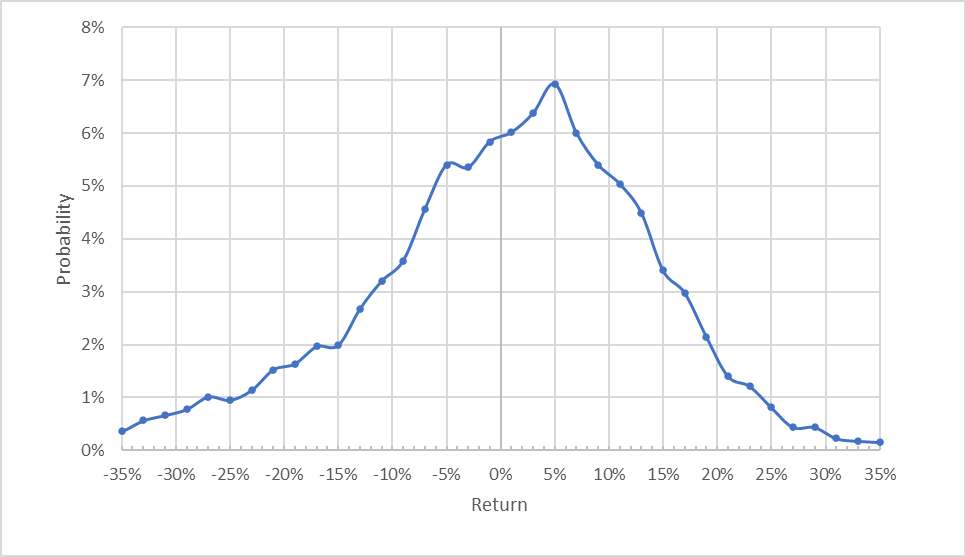
The standard presentation of the market-implied outlook is a probability distribution of price return, with probability on the vertical axis and return on the horizontal.
Geoff Considine
Market-implied price return probabilities for TD for the 4.8-month period from now until January 20, 2023 above.
The market-implied outlook to January 20, 2023 is negatively skewed, with the peak in probability tilted to favor positive returns. The maximum probability corresponds to a price return of 5% over this period. This distribution is negatively skewed (fatter negative tail). A study (ultimately published in the Journal of Finance) found that stocks with negative skewness in the option-implied probability distribution tend to outperform. The expected volatility calculated from this distribution is 25.3% (annualized).
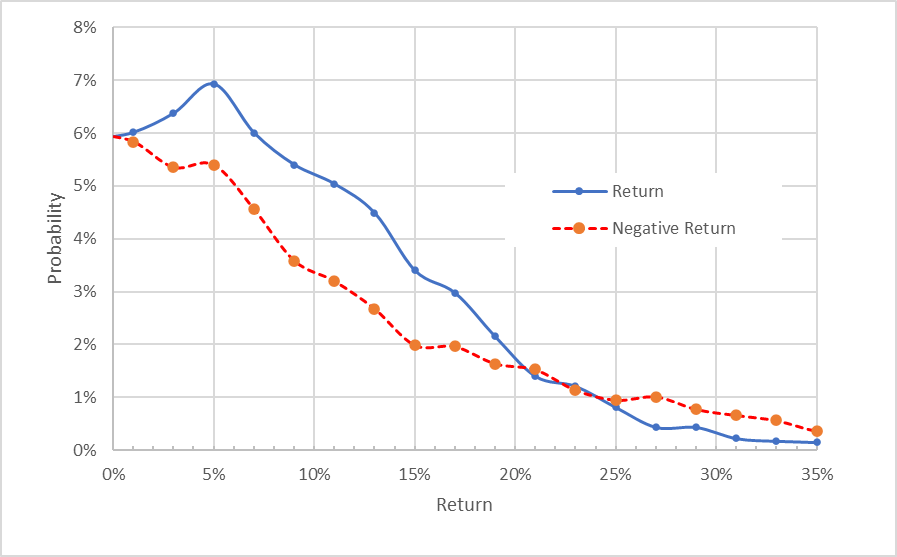
To make it easier to compare the relative probabilities of positive and negative returns, I rotate the negative return side of the distribution about the vertical axis (see chart below).
Geoff Considine
Market-implied price return probabilities for TD for the 4.8-month period from now until January 20, 2023. The negative return side of the distribution has been rotated about the vertical axis above.
This view shows that the probabilities of positive returns are substantially higher than for negative returns of the same magnitude, across a wide range of the highest-probability outcomes (the solid blue line is well above the dashed red line over the left ½ of the chart above). This is a bullish outlook for TD to early 2023.
Theory indicates that the market-implied outlook is expected to have a negative bias because investors, in aggregate, are risk-averse and thus tend to pay more than fair value for downside protection. There is no way to measure the magnitude of this bias, or whether it is even present, however. This potential bias reinforces the bullish interpretation of the market-implied outlook.
In my post from early May, I also generated the market-implied outlook using the January 2023 options. The current outlook using these options is more bullish than the results in May.
Summary
While TD has declined in recent months, the recent quarters’ results have been quite strong. The Wall Street consensus outlook is generally favorable, although ETrade’s calculation of the consensus rating is a hold. The consensus 12-month price target implies a total return of 16.5% to 18.2%. As a rule of thumb for a buy rating, I look for an expected return that is at least ½ the expected volatility (25.3% from the market-implied outlook). Even if we somewhat discount the Wall Street consensus price target, TD can exceed this threshold value. TD’s total returns tend to be positively correlated to 10-year Treasury yields, which is a favorable indicator given The Fed’s current position. The market-implied outlook for TD continues to be bullish. Concerns that economic growth may falter, along with rising default rates on loans, are certainly reasonable, but the prevailing evidence suggests that TD is quite well-situated. Management appears to be executing well, with an attractive growth plan. I am maintaining my bullish / buy rating on TD.
Be the first to comment