

US STOCKS OUTLOOK:
- S&P 500 soars and ends a four-day losing streak amid positive market sentiment
- The Nasdaq 100 outperforms its peers and gains 3.58%, exiting bear market territory confirmed earlier this week
- Despite improving sentiment, caution is warranted as geopolitical headwinds have not disappeared
Most Read: Nasdaq 100 Outlook – Tech Holds Key Support as US CPI Comes Into Focus
After several days of persistent weakness, U.S. stocks staged a fierce rally on Wednesday, supported by broad-based risk-on sentiment in the face of cooling geopolitical tensions in Eastern Europe. During the session, different media outlets reported that Ukraine no longer aspires to join NATO, is prepared for certain compromises, and stand ready to reach a diplomatic solution to end the ongoing war initiated by Russia.
The possibility of a military détente between Moscow and Kyiv eased concerns that the crisis would further escalate and derail the global recovery by reinforcing inflationary pressures via the commodity market price shock.
Against this backdrop, oil took a sudden leg downward, a move that was later accelerated by news that the United Arab Emirates and Iraq are willing to boost crude production to stabilize the increasingly tight energy market. This sharp correction, which briefly sent WTI and Brent down more than 15%, was welcomed by investors/traders, helping to assuage fears of stagflation and luring dip buyers.
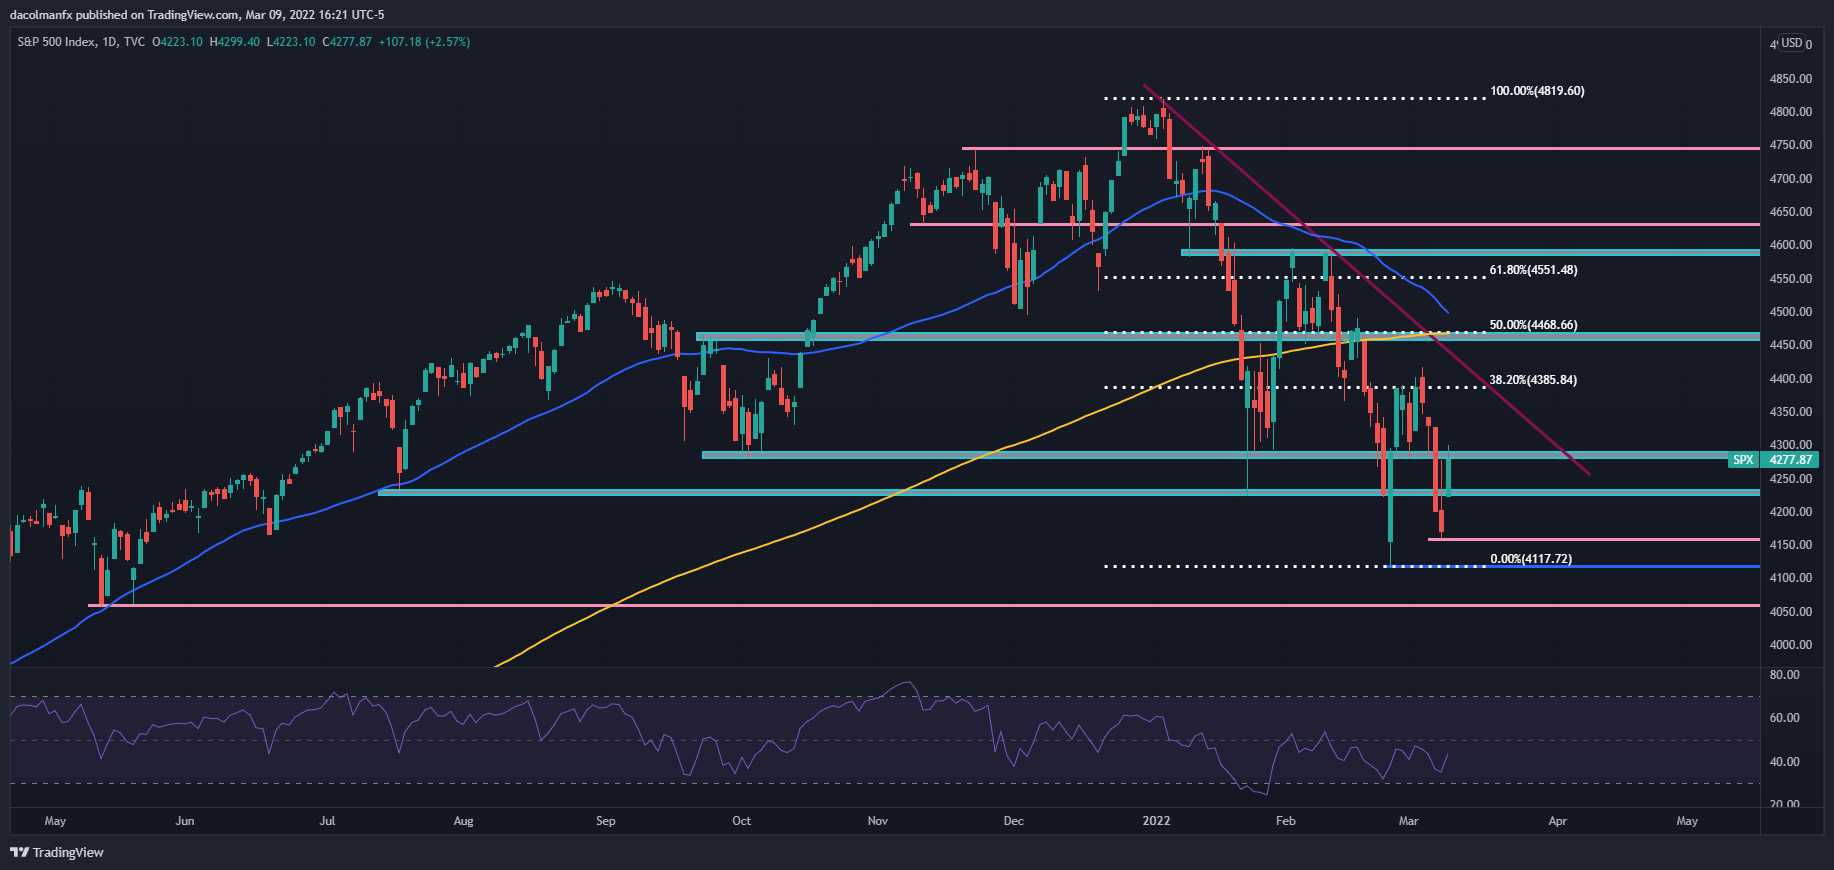
When it was all said and done, the S&P 500 jumped 2.57% to 4,277, ending a four-day losing streak. The Dow Jones also put in a good performance, climbing 2% to 33,285 on hopes that economic activity will stabilize if a peaceful solution to the Ukraine crisis is achieved. Last but not least, the Nasdaq 100 outpaced its peers and soared 3.58% to 13,742 at the closing bell, scoring its biggest one-day gain in a year and exiting bear market territory confirmed earlier this week.
While the rebound in risk appetite is encouraging, it is important to recognize that the worst is not yet over on the geopolitical front, especially as Moscow has shown no willingness to reach a truce in recent talks.
As things stand, President Putin is unlikely to abandon his Ukrainian misadventure; on the contrary, he may even double down to claim some kind of victory and save face at home after a terribly executed military operation. On that note, we should not be surprised if the conflict turns more violent and Wall Street sentiment sours again in the coming days.
S&P 500 TECHNICAL ANALYSIS
After Wednesday’s powerful rally, the S&P 500 is trading near technical resistance in the 4,290 area. If the index manages to clear this hurdle in the following sessions, bulls could launch an assault on 4,385, the 38.2% Fibonacci retracement of the 2022 decline. On the other hand, in the event of a bearish reversal, support lies at 4,157 and then 4,115, this year’s low.
S&P 500 (SPX) Chart by TradingView
DOW JONES TECHNICAL ANALYSIS
The technical picture remains bearish for the Dow Jones despite solid gains logged on Wednesday. For sentiment to improve further, the index must build on the rebound and push above resistance in the 34,076 area. If this scenario plays out, we could see a move towards 34,630 in the short term.
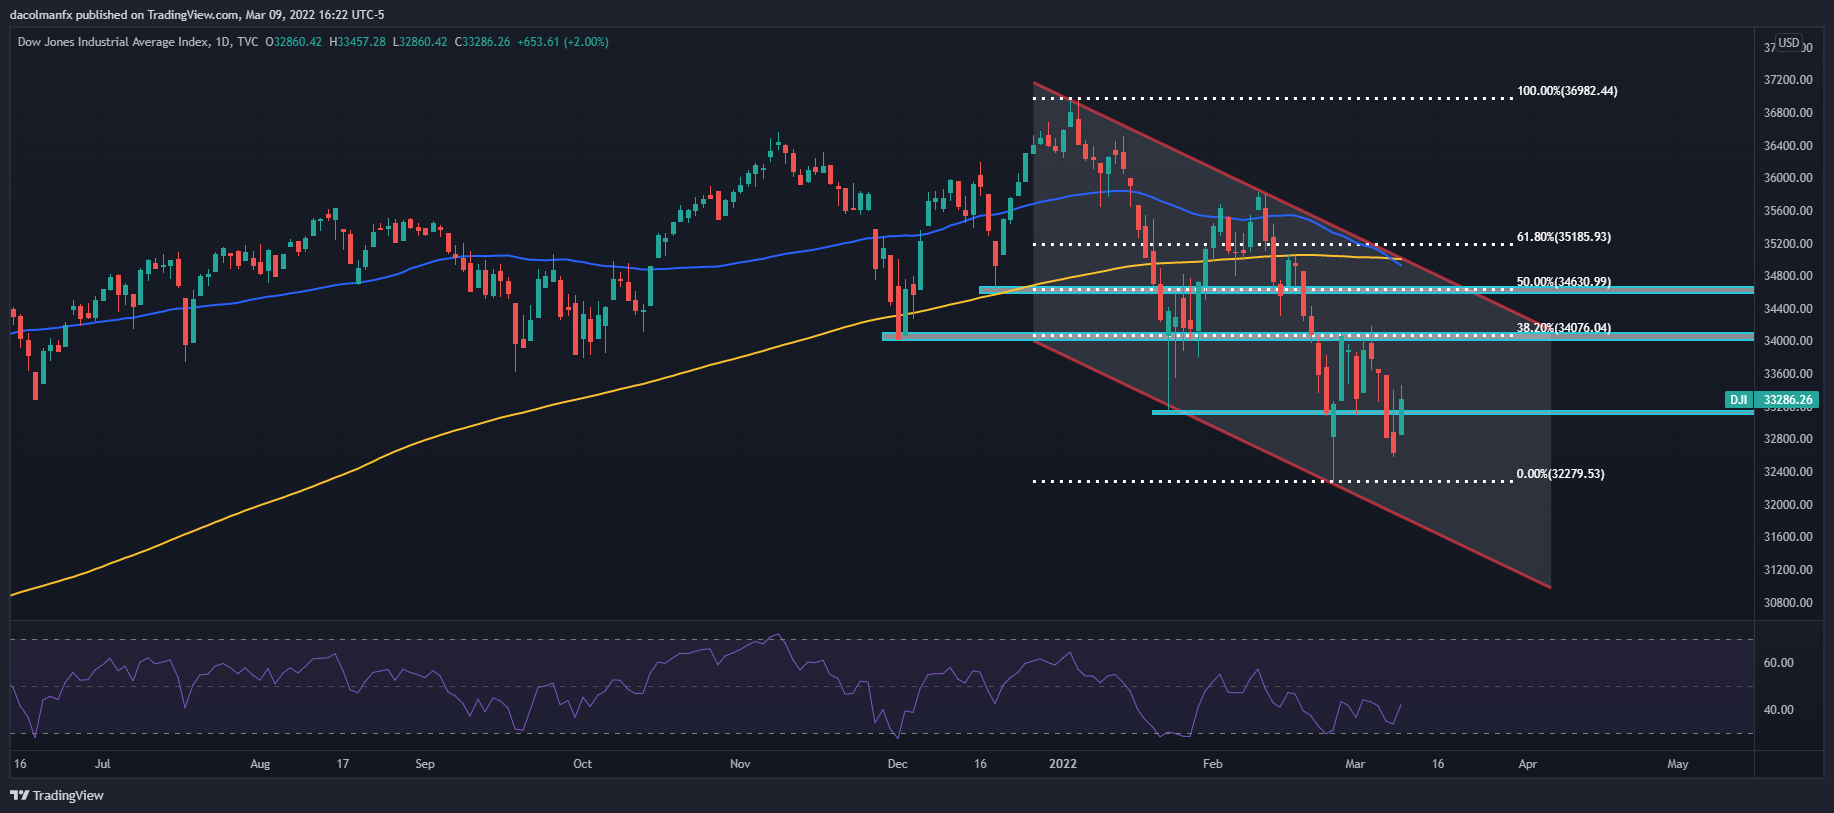
Dow Jones Chart prepared in TradingView
NASDAQ 100 TECHNICAL ANALYSIS
The Nasdaq 100 has underperformed in 2022 and was considerably oversold, so it is no surprise that it outshined its peers on a bullish day on Wall Street. In any case, to be confident that this is not a dead–cat bounce, a clear move above 14,060 is needed. If this barrier is taken out (trendline resistance), the index could charge towards cluster resistance in the 14,375/14,453 band. On the other hand, if sellers resurface and spark a decline, the 2022 low would become the immediate downside target.
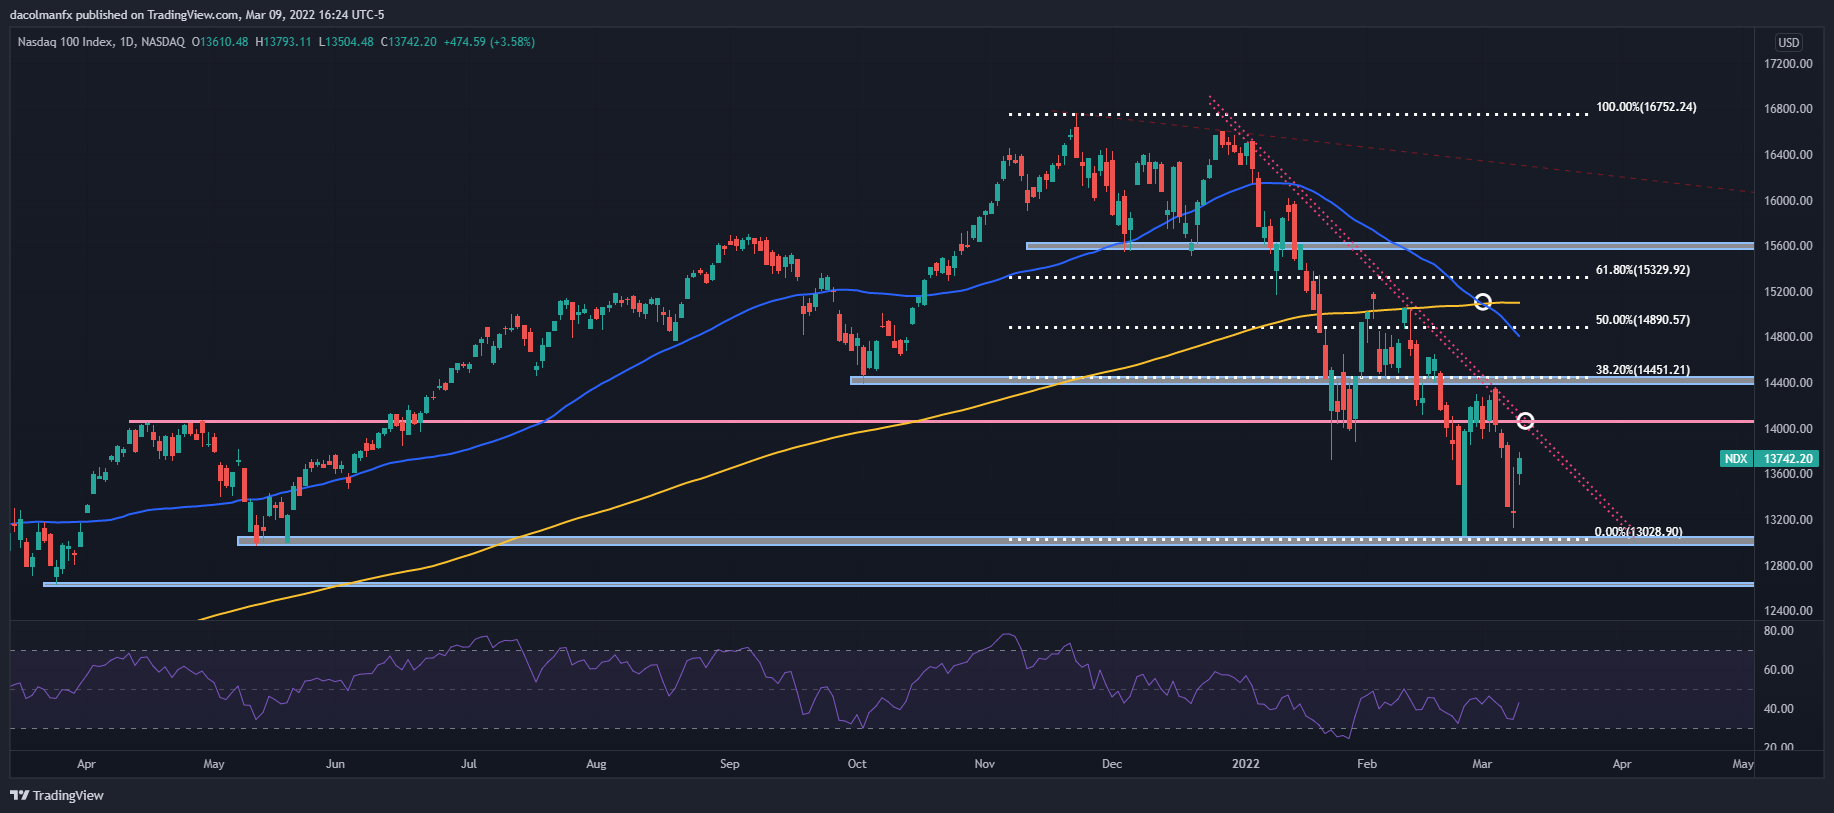
Nasdaq 100 (NDX) chart prepared in TradingView
EDUCATION TOOLS FOR TRADERS
- Are you just getting started? Download the beginners’ guide for FX traders
- Would you like to know more about your trading personality? Take the DailyFX quiz and find out
- IG’s client positioning data provides valuable information on market sentiment. Get your free guide on how to use this powerful trading indicator here.
—Written by Diego Colman, Contributor
Be the first to comment