

buzbuzzer/E+ via Getty Images
Whitestone’s Buy Thesis
Whitestone (NYSE:WSR) owns a particularly well-located portfolio of shopping centers and stands to benefit significantly from occupancy growth. Retail has endured a mostly headwind environment for the last few years, but the environment is improving and turning favorable. As negotiating power shifts from tenant to landlord, I anticipate substantial rental rate growth on top of about 300 basis points of occupancy growth.
The combined effect is significant growth in funds from operations per share (FFO/share) which is not priced in to WSR given the low multiple and discount to NAV at which it trades.
Specifically, there are three forces that combine to propel net operating income growth (NOI growth).
- Low supply in specific submarkets
- Demand growth in same submarkets
- Critical occupancy threshold
Submarkets well positioned
While there are many high quality shopping center REITs, Whitestone stands out above the rest because of its concentration in key submarkets. It derives nearly all of its revenues from five MSAs:
- Austin
- Dallas
- San Antonio
- Houston
- Phoenix
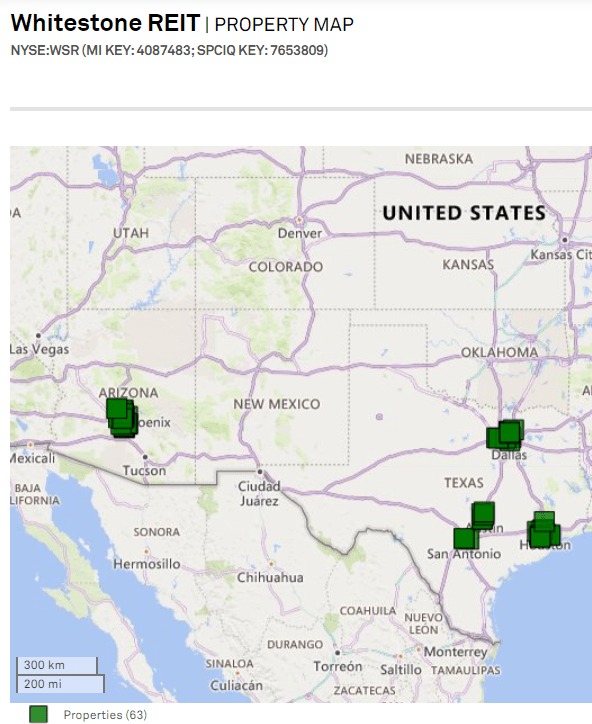
SNL Financial
All five of these markets have excellent supply and demand dynamics with net absorption substantially outweighing construction.
For clarity, net absorption is the incremental change in demand, so it is new demand net of any demand churn. Therefore, any positive read on net absorption means overall demand is increasing. If net absorption is increasing faster than new construction, occupancy will increase.
In Austin, vacancy is expected to drop to 3.5% as net absorption of about 1.2 million square feet substantially outweighs construction of about 0.6 million square feet.
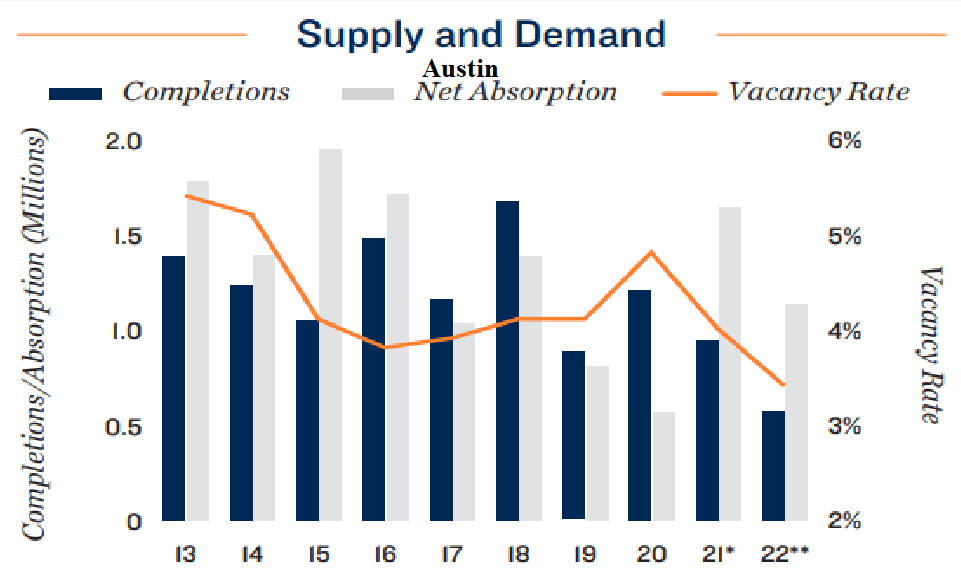
Marcus and Millichap
Austin is a remarkable growth market as evinced by positive net absorption in 2020. Even in the depths of the pandemic, retailers increased their footprints in Austin.
Houston is more of a mixed property market generally. It has strong growth drivers due to favorable taxation, along with population and job inflows, but it also has really loose zoning which has in many cases led to oversupply. Retail, however, has not experienced the supply growth that other sectors have. Starting in circa 2015 ecommerce began to be viewed as a significant headwind for brick and mortar retail which greatly reduced the number of new developments.
Development starts were further reduced by the uncertainty caused by the pandemic leading to minimal construction at about four million square feet slated for 2022.
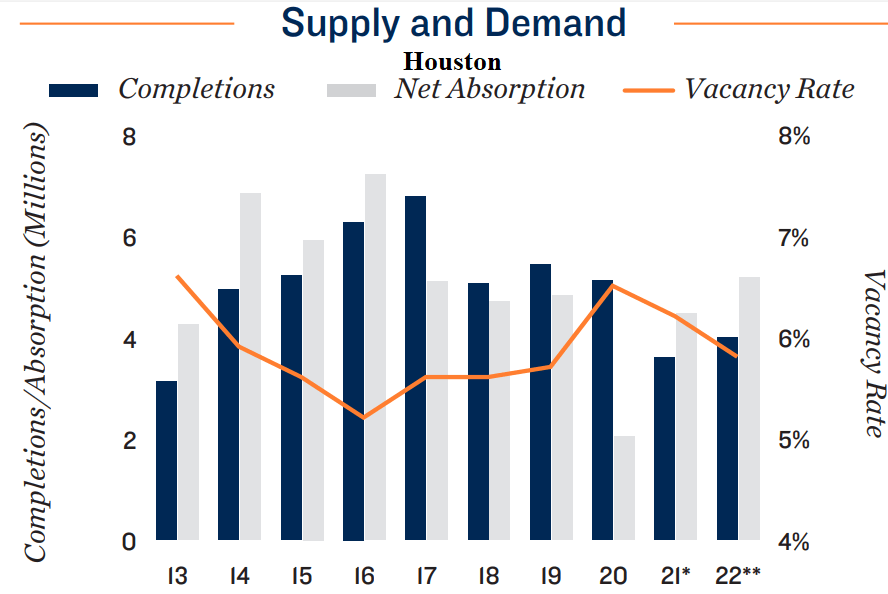
Marcus and Millichap
Demand growth is anticipated to outpace this development level causing a nice rise in occupancy.
Dallas has similar trends with net absorption outpacing construction by about two million square feet.
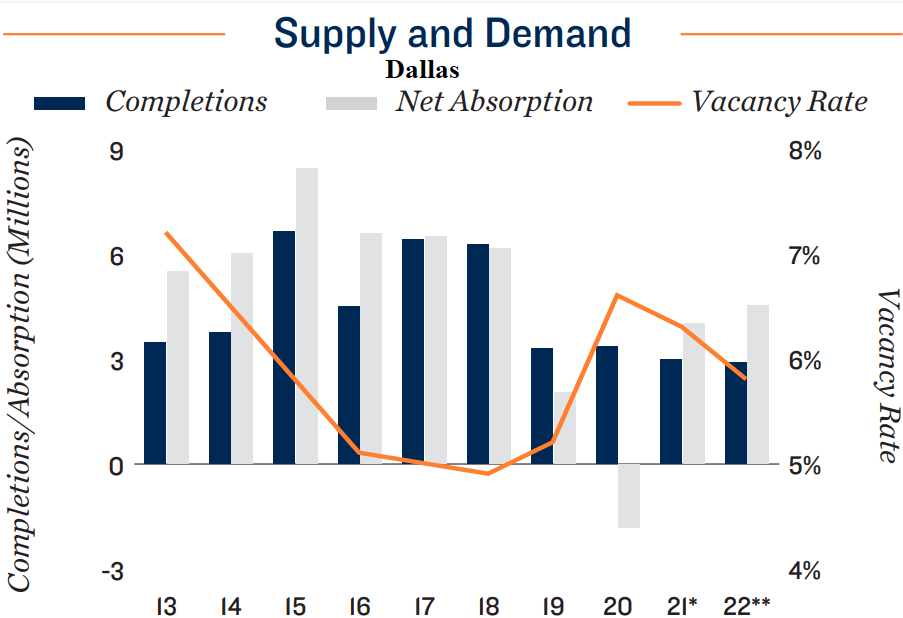
Marcus and Millichap
San Antonio only has a slight advantage of demand over supply, but it does have quite low starting vacancy at 5%.
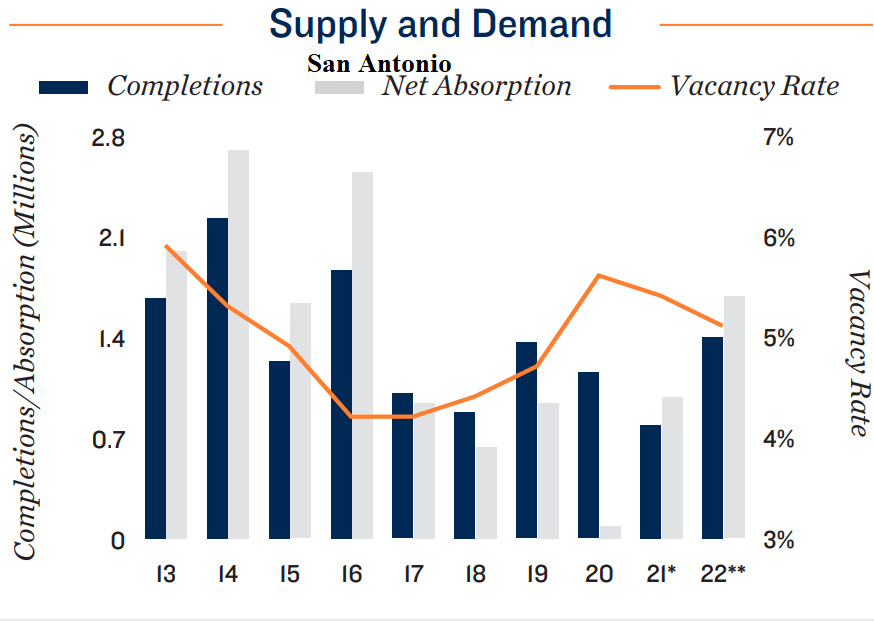
Marcus and Millichap
Among WSR’s markets, San Antonio is the one I am least excited about, but it still looks solid.
Phoenix, on the other hand, is one of the best real estate markets in America. It has achieved a critical mass of worker talent and employment opportunities that it can simultaneously attract both employers and employees. It is an early stage Silicon Valley just as it hits the upward inflection of the S curve.
To top it all off it has great weather, low cost of living and favorable taxation.
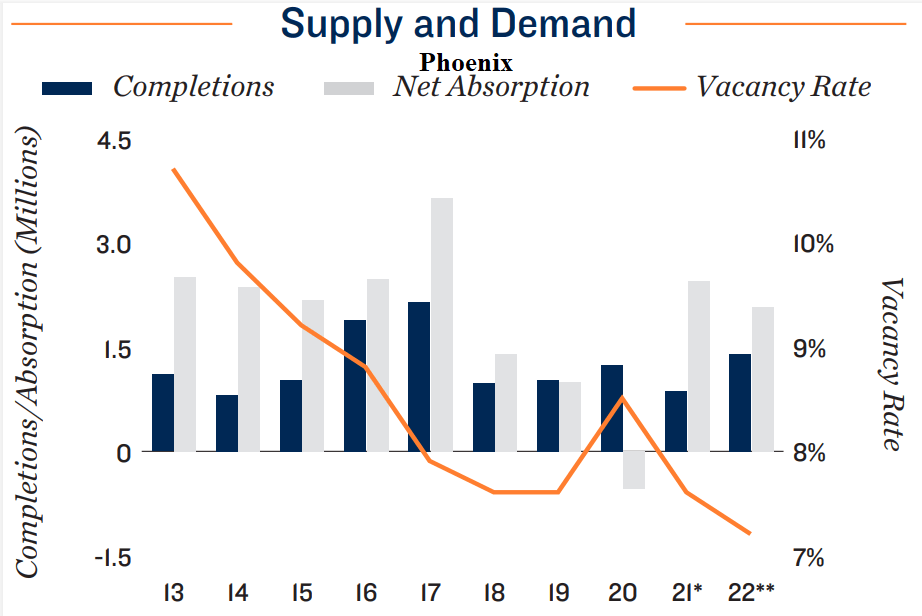
Marcus and Millichap
Vacancy rates in Phoenix have dropped from 11% to an anticipated 7% in 2022.
Overall, WSR’s supply and demand dynamics look highly favorable. This is of course beneficial to same store NOI growth, but there is reason to believe it will transition from linear growth to more explosive growth as it crosses a critical occupancy threshold.
Linear Growth Is Explosive
With exception to the 2020 pandemic, Whitestone has consistently grown its same store NOI.
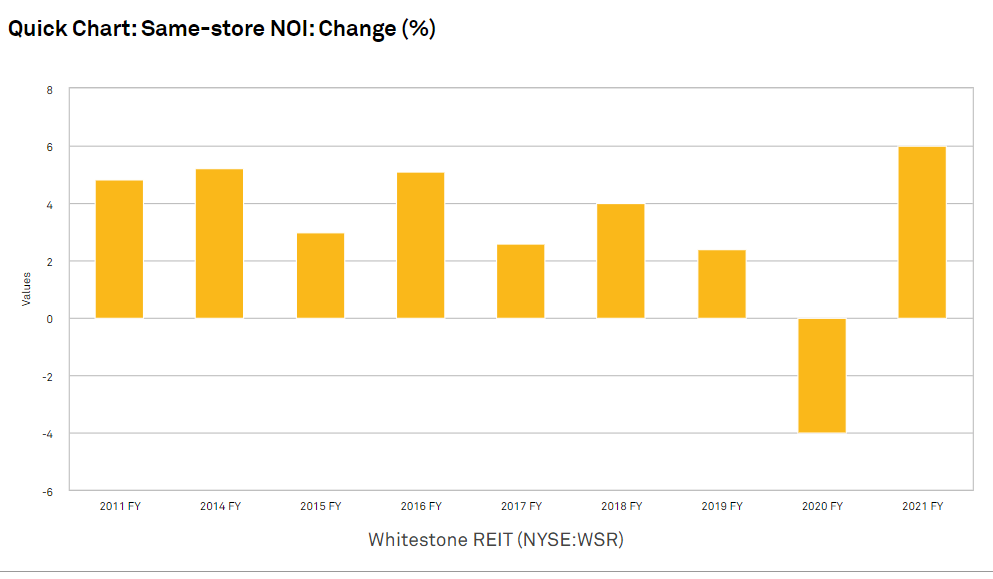
SNL Financial
The linear 2%-4% pace was a result of slight occupancy increases in combination with modest rent rollups.
Whitestone went from 86% occupancy to 91% at the close of 2021.
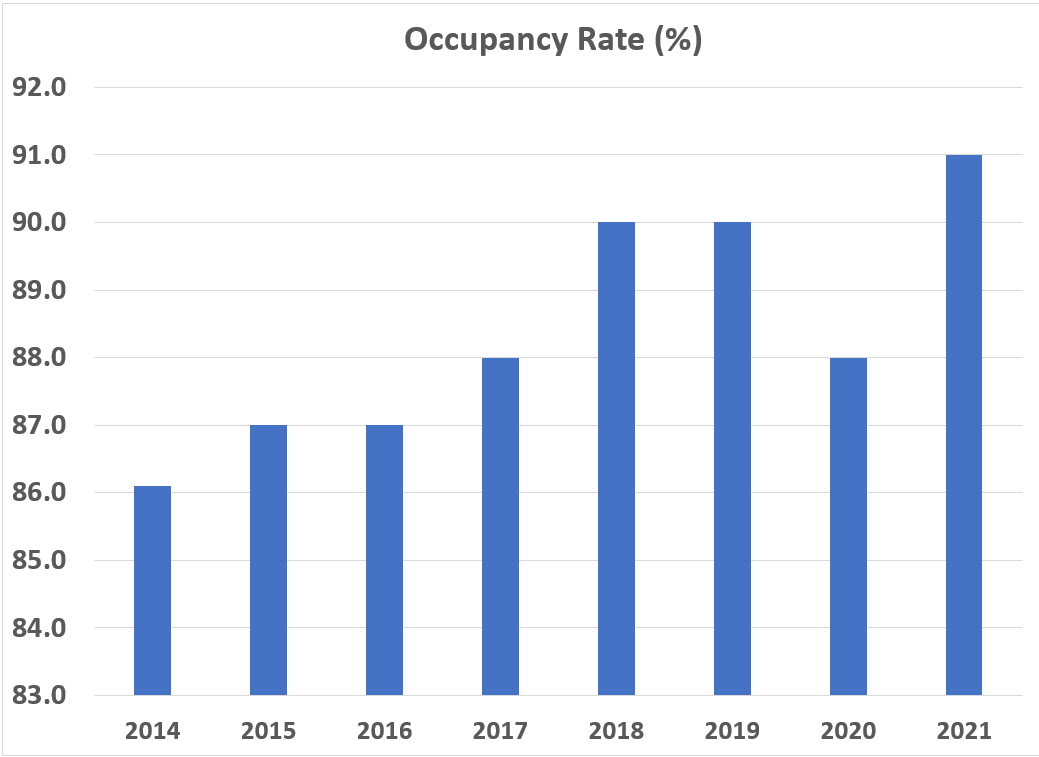
Charted by author using company filings
I posit that as WSR gets closer to full occupancy, the negotiating power will swing firmly in their favor allowing substantial rent growth. This notion is predicated on a few key points.
- Historical observation of real estate as it crosses a critical occupancy threshold
- Full occupancy is about 96%, not 100%
- WSR has many properties on the cusp of the critical occupancy threshold
The Critical Occupancy Threshold
In each real estate sector, negotiating power swings between favoring landlord and tenant. Since it takes years to build commercial real estate, the amount of supply at a given time is a constant and as demand approaches that level conditions of scarcity begin to take hold. Each remaining square foot of real estate becomes increasingly valuable as tenants are faced with the realization that if they don’t pay up they will be left without.
This is most obvious in hospitality due to the condensed time cycle of fluctuations. If you rent a room at the last minute when occupancy is at 50%, the hotel knows that if you don’t rent that room it will go unfilled so you can get maximal discount. In contrast trying to last minute the same room on a surge night will result in a substantially higher price as the hotel knows it has many other guests also wanting that room.
For hotels these dynamics happen on a night by night basis, but for other forms of real estate the shift of negotiating power occurs over years.
Apartments crossed a critical occupancy threshold heading into 2021 and the scarcity conditions allowed the well located apartments to raise rents by 15%. Those in less well located areas such as the coastal apartment REITs did not cross the critical occupancy threshold due to weaker demand and did not get a similar rent bump.
Demand for industrial logistics facilities has grown faster than supply could keep up resulting in a similar landlord favoring dynamic. In much of the country warehouse rents are up 20% and in supply constrained areas rents are up as much as 40%.
This critical occupancy threshold also works in the other direction. If occupancy declines below a critical level rents drop precipitously. This can be seen in office where despite work from home causing occupancy to already be low in the 80s, developers continued building office. As occupancy dipped further it became clear to landlords that they were going to have to compete on price to get tenancy. Rents have fallen in most MSAs and more than 20% in some.
The point of all this is that when crossing the critical threshold, NOI is no longer a linear function with occupancy. So while WSR gaining 100 basis points of occupancy has historically translated into 1% extra revenue, the next few percentage points are likely to be substantially outsized in their impact on NOI.
Critical occupancy threshold is roughly 94-96%
In multi-tenant real estate the rule of thumb is:
“if you have 100% occupancy, rents are too low”
In the same way that there is frictional unemployment in the economy such that the full employment level is 3%-5% unemployment, the full occupancy level for multi-tenant real estate is in the mid 90s.
There will always be timing issues as new tenants replace old tenants and a bit of downtime while searching for just the right tenant. As such, 100% occupancy is unattainable at a portfolio level unless the landlord is just giving space away for well below market.
Properties on the cusp of critical occupancy
While WSR is 91% occupied at a company level, individual property occupancies have significantly more variance. Whitestone has quite a few properties on the cusp of reaching square footage scarcity. Below is a list of WSR’s properties and their individual occupancy levels.
|
Property Name |
City |
Occupancy Rate (%) |
||
|
Gilbert Tuscany Village Hard Corner |
Gilbert |
100.0 |
||
|
South Richey |
Houston |
100.0 |
||
|
Lion Square |
Houston |
100.0 |
||
|
Pinnacle Phase II |
Scottsdale |
100.0 |
||
|
Anthem Marketplace Phase II |
Anthem |
100.0 |
||
|
Heritage |
Fort Worth |
100.0 |
||
|
City View Village |
San Antonio |
100.0 |
||
|
Parkside Village North |
Austin |
100.0 |
||
|
Parkside Village South |
Austin |
100.0 |
||
|
Boulevard Place |
Houston |
100.0 |
||
|
Shops at Starwood |
Frisco |
99.0 |
||
|
The Citadel |
Scottsdale |
99.0 |
||
|
The Marketplace at Central |
Phoenix |
99.0 |
||
|
Pinnacle of Scottsdale |
Scottsdale |
99.0 |
||
|
Davenport Village |
Austin |
99.0 |
||
|
Strand |
San Antonio |
98.0 |
||
|
Windsor Park |
San Antonio |
97.0 |
||
|
Sunset at Pinnacle Peak |
Scottsdale |
97.0 |
||
|
Headquarters Village |
Plano |
97.0 |
||
|
Quinlan Crossing |
Austin |
97.0 |
||
|
Market Street at DC Ranch |
Scottsdale |
96.0 |
||
|
SugarPark Plaza |
Houston |
96.0 |
||
|
Town Park |
Houston |
96.0 |
||
|
Fulton Ranch Towne Center |
Chandler |
96.0 |
||
|
Keller Place |
Keller |
96.0 |
||
|
Fountain Hills |
Fountain Hills |
95.0 |
||
|
Eldorado Plaza |
McKinney |
95.0 |
||
|
Shaver |
Pasadena |
94.0 |
||
|
Sunridge |
Houston |
93.0 |
||
|
The Shops at Williams Trace |
Sugar Land |
93.0 |
||
|
Providence Plaza |
Houston |
92.0 |
||
|
Gilbert Tuscany Village |
Gilbert |
91.0 |
||
|
Bissonnet Beltway |
Houston |
90.0 |
||
|
Spoerlein Commons |
Buffalo Grove |
90.0 |
||
|
Starwood Phase II |
Frisco |
90.0 |
||
|
Paradise Plaza |
Phoenix |
90.0 |
||
|
Fountain Square |
Phoenix |
90.0 |
||
|
Williams Trace Plaza |
Sugar Land |
90.0 |
||
|
Seville |
Scottsdale |
90.0 |
||
|
La Mirada |
Scottsdale |
89.0 |
||
|
Anderson Arbor |
Austin |
89.0 |
||
|
Holly Knight |
Houston |
88.0 |
||
|
Westgate Service Center |
Houston |
88.0 |
||
|
Kempwood Plaza |
Houston |
88.0 |
||
|
Desert Canyon |
Scottsdale |
88.0 |
||
|
Shops at Pecos Ranch |
Chandler |
88.0 |
||
|
Anthem Marketplace |
Anthem |
88.0 |
||
|
Mercado at Scottsdale Ranch |
Scottsdale |
86.0 |
||
|
Las Colinas |
Irving |
85.0 |
||
|
Corporate Park Woodland II |
Spring |
83.0 |
||
|
Dana Park |
Mesa |
82.0 |
||
|
Lakeside Market |
Plano |
82.0 |
||
|
Ahwatukee Plaza |
Phoenix |
81.0 |
||
|
The Promenade at Fulton Ranch |
Chandler |
80.0 |
||
|
Terravita Marketplace |
Scottsdale |
76.0 |
||
|
Corporate Park NW |
Houston |
75.0 |
||
|
Westchase |
Houston |
73.0 |
||
|
Uptown Tower |
Dallas |
67.0 |
||
|
Woodlake Plaza |
Houston |
64.0 |
||
|
Pima Norte |
Carefree |
64.0 |
||
|
Holly Hall Industrial Park |
Houston |
57.0 |
||
|
9101 LBJ Freeway |
Dallas |
50.0 |
||
|
Interstate 10 Warehouse |
Houston |
6.0 |
Source: SNL Financial
With these cities rapidly gaining jobs and population, retailers want these locations. As Whitestone went from low 86% occupancy to 91% the fill-up was on relatively even negotiating power resulting in only slight rental rate increases.
The next few hundred basis points will be on less even terms. The tenants want space and given the extent to which net absorption is outpacing supply, Whitestone will be able to charge a premium. Whitestone’s properties are particularly well located even within their strong submarkets with average household income in the 3-mile catchment radius of $104,000.
I think there is real potential for double digit same store NOI growth.
WSR’s growth is not priced in
With inflation running hot and real estate undersupplied across a wide range of property types, double digit same store NOI growth is not rare among REITs. The aspect that makes WSR opportunistic is its market price is not implying any growth whatsoever.
At today’s price it is trading at just 12.5X forward FFO which is usually a multiple applied to troubled companies or those in areas of secular decline. A double digit same store NOI company would typically trade well over 20X. In Whitestone’s case perhaps 15X-17X would be fair given the higher than average leverage.
This implies a fair value of $15.75-$17.85 or about 30% upside at the midpoint.
Such a price is backed up by property value as Whitestone has an NAV of $17.95.
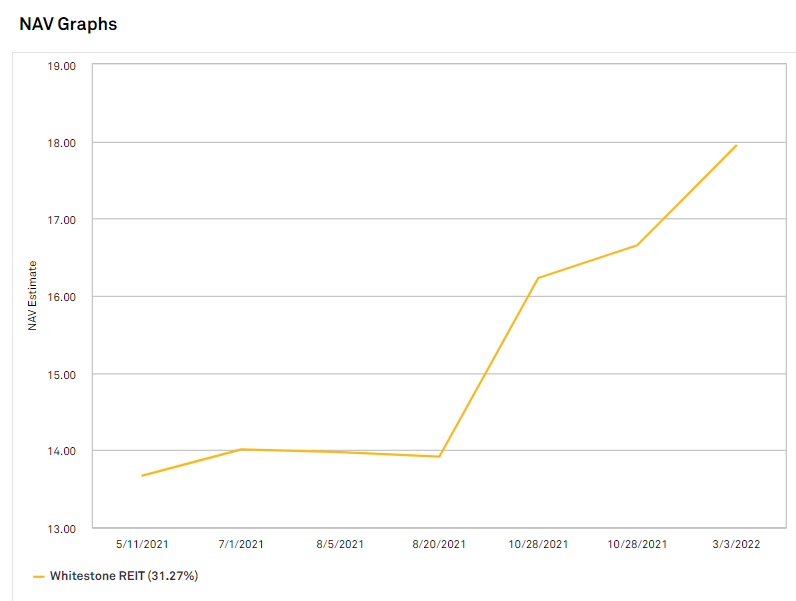
SNL Financial
I actually think NAV is higher than that as the consensus estimate is working with a 6.2% cap rate and real estate similar to WSR’s has been transacting in the low 5s.
Risks to investment in Whitestone
WSR has a history of dilutive share issuance. In the past its NOI growth has not translated to FFO/share growth as well as it should have because it repeatedly issued equity at a discount to NAV and low FFO multiples. I believe this historical behavior is largely the reason that WSR trades at such a low price today.
Thus, one of the bigger risks is that it will continue such behavior. While I think this is a legitimate concern, I think they have largely turned the corner.
Since the firing of James Mastandrea (the former CEO), WSR has taken numerous steps to improve shareholder governance with the removal of the poison pill and improved outreach to investors. There has also been a noticeable cessation in share issuance.
If they have in fact become a shareholder friendly company, WSR is deeply undervalued.
Be the first to comment