

yoh4nn/iStock via Getty Images
In almost every part of the world, one thing that pretty much every person has in common is that they use some form of footwear. The footwear industry is large, with the global market for footwear totaling $222.6 billion and forecasted to climb to $269.9 billion by 2025. This leaves room for a number of players, some large but many small. An example of one of the smaller players in this space that warrants investor attention is Weyco Group (NASDAQ:WEYS). With a few key brands under its belt and a business model that prioritizes wholesale activities, the enterprise is a unique player in the market. It’s also, based on 2021 results, trading at levels that should be considered generally attractive for investors. And if financial performance achieved so far this year is any indication, the firm could offer investors some rather strong upside moving forward.
A sole focus on footwear
The management team at Weyco takes pride in focusing only on designing and distributing quality and innovative footwear. For the most part, the company focuses on men for its target market. But it also sells its footwear to women and children. Brand names under its belt include Florsheim, Nunn Bush, Stacy Adams, BOGS, Rafters, and Forsake. In terms of market fit, the company largely focuses on mid-priced leather dress shoes and casual footwear that are composed of leather or man-made materials. However, the company also does produce some outdoor boots, shoes, and sandals.
Based on the data provided, Weyco focuses on sourcing its shoes from third-party suppliers, many of them located in China, India, Cambodia, Vietnam, and the Dominican Republic. It then has most of these shoes shipped to the North American market where it sells them through two key segments. The first of these is referred to as the Wholesale segment. This segment is the largest of the two, accounting for 76.7% of the company’s revenue in 2021. According to management, this particular segment, the company sells its products directly to retailers throughout the US and Canada. It also generates a small amount of licensing revenue, much of which comes from its own branded apparel, accessories, and specialty footwear in both the North American and overseas markets. This particular segment is also responsible for 74.5% of the company’s positive operating profits.
The next segment is referred to as Retail. During the company’s 2021 fiscal year, this unit was responsible for 11.9% of the company’s revenue and for roughly 25.5% of its positive segment profits. As of the end of the company’s 2021 fiscal year, this segment’s operations consisted of the company’s e-commerce businesses, as well as four brick-and-mortar retail stores in the US. The final 11.5% of revenue the company generates comes from its ‘Other’ operations. These activities center around the company’s wholesale and retail operations throughout Australia, South Africa, Asia, and Europe. Unfortunately, this unit was responsible for a modest operating loss last year.
Author – SEC EDGAR Data
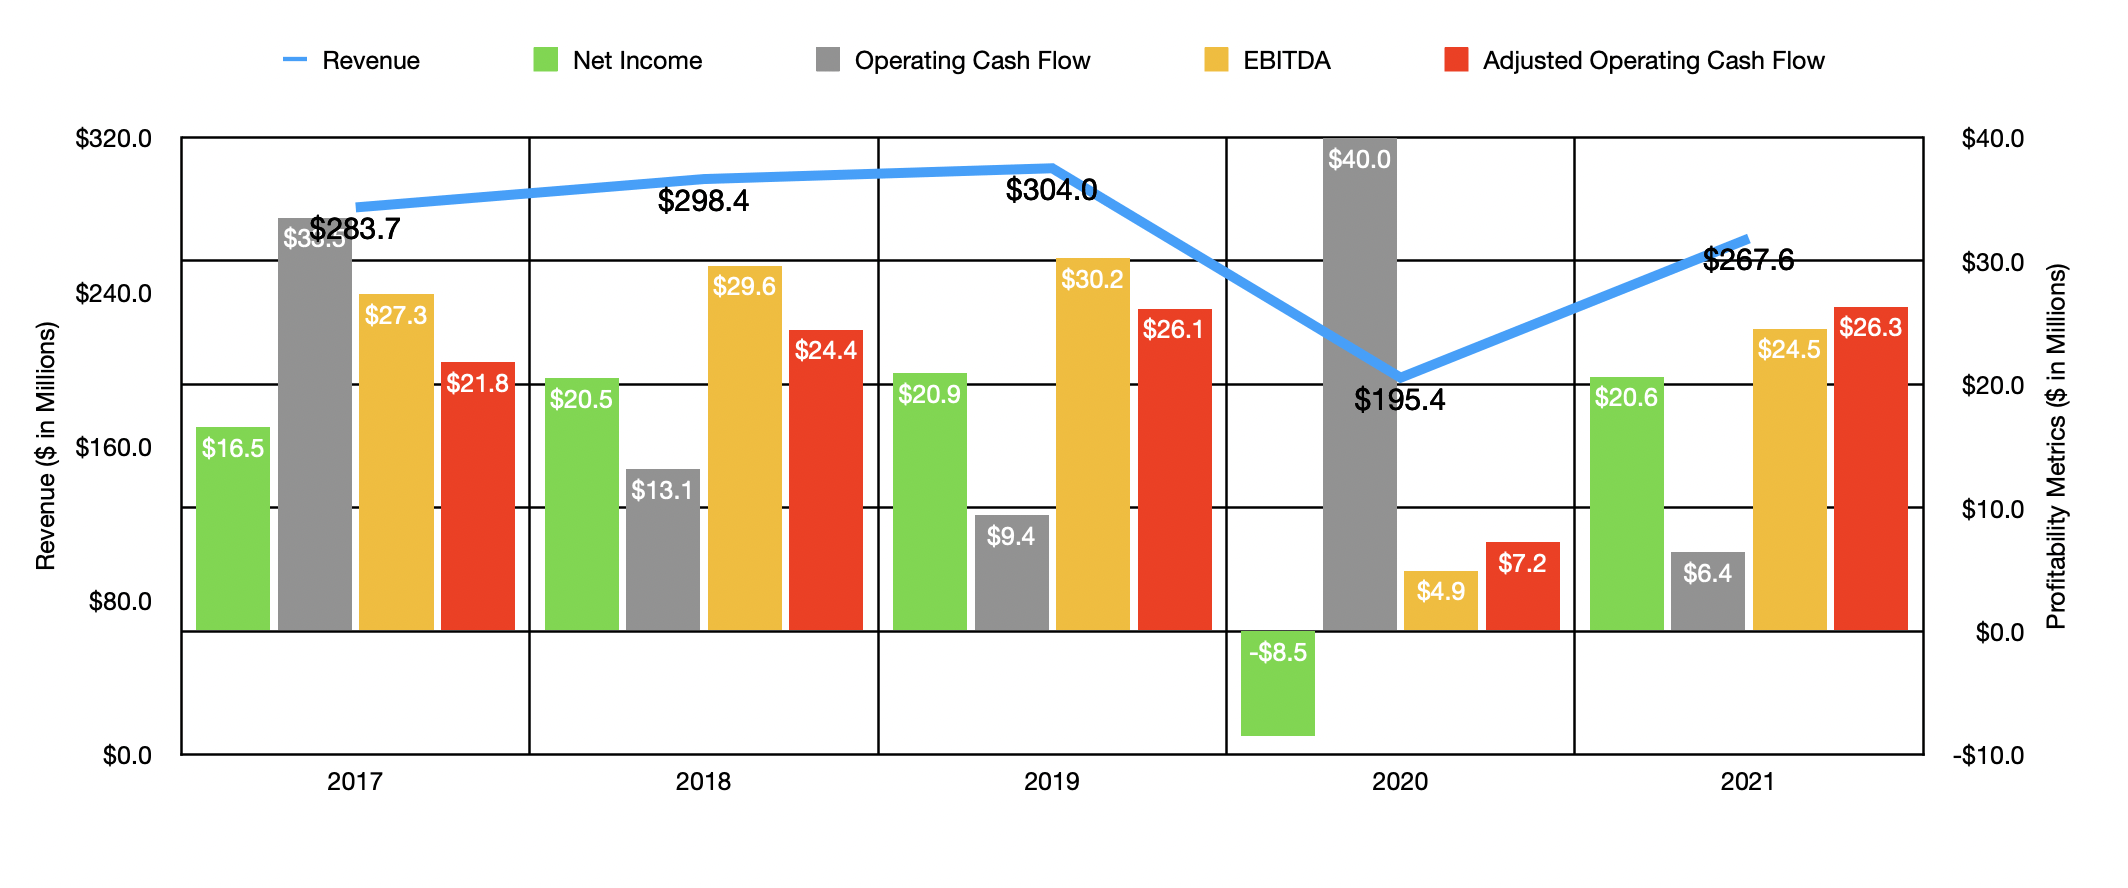
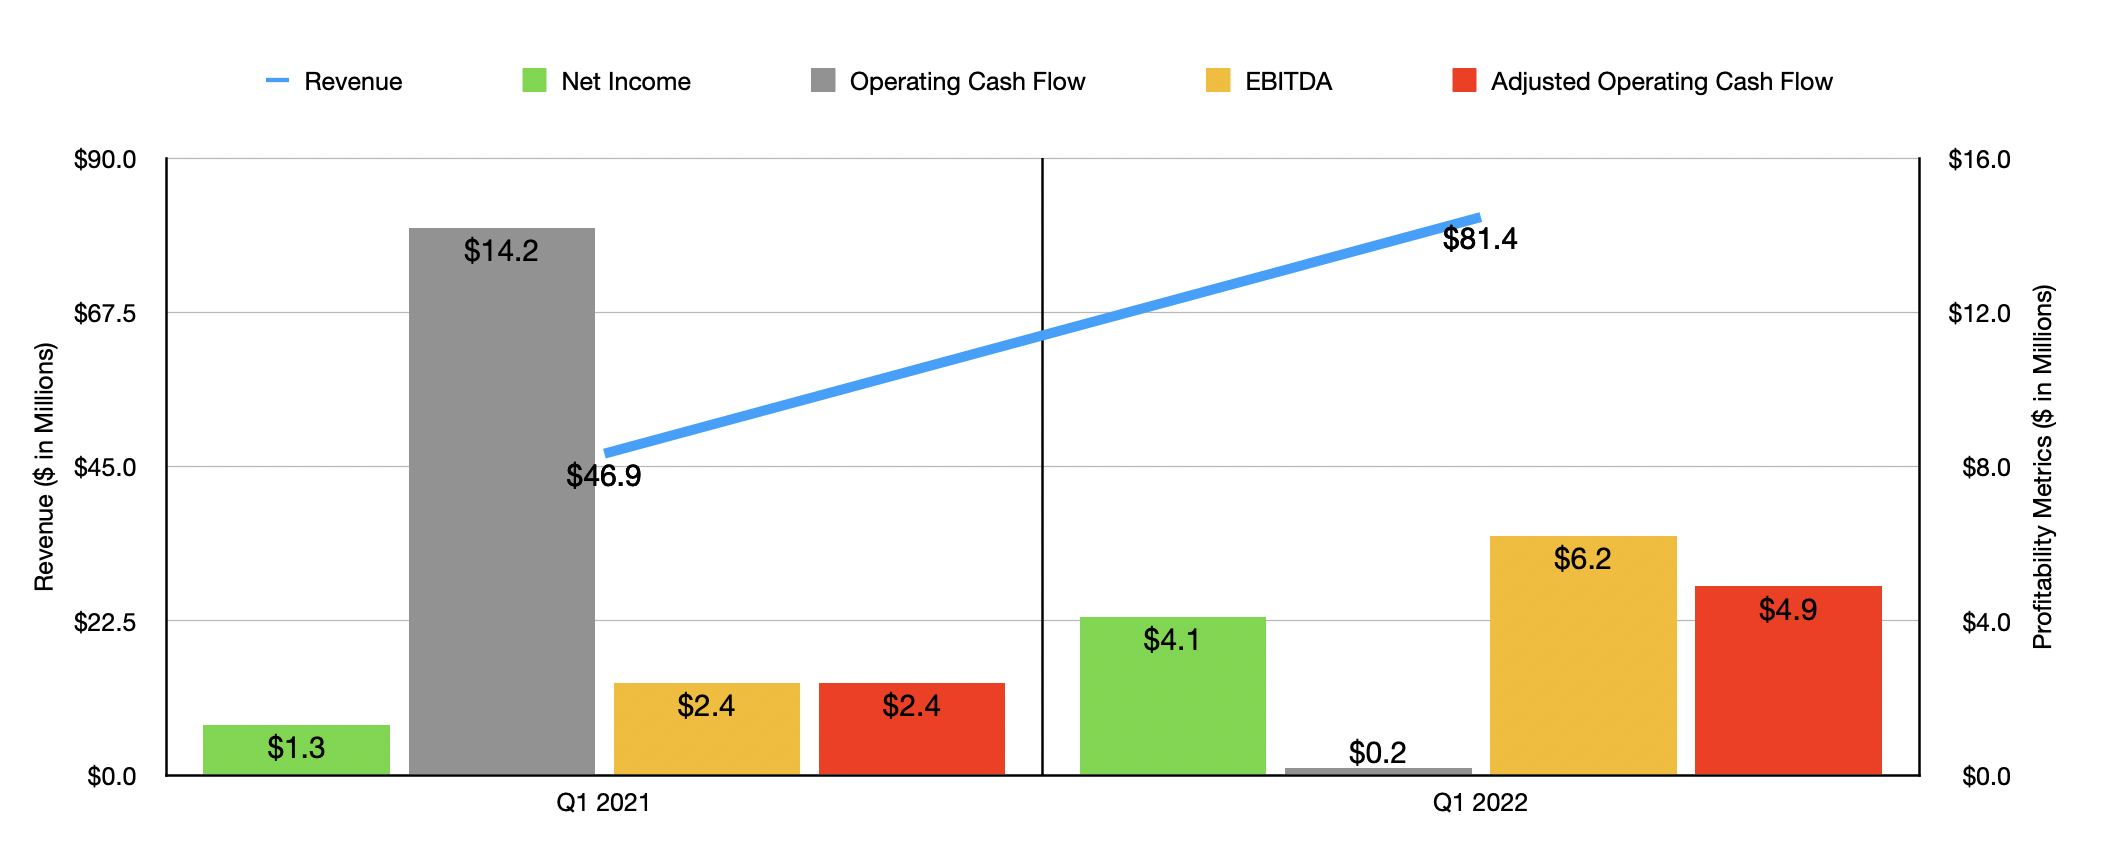
In the years leading up to the COVID-19 pandemic, management had been successful in steadily growing the company’s top line. Revenue increased from $283.7 million in 2017 to $304 million in 2019. In 2020, the COVID-19 pandemic pushed revenue down to $195.4 million. The good news is that this pain was short-lived. I say this because, in 2021, revenue came in at $267.6 million. When talking about the current fiscal year, growth has been particularly impressive. According to management, revenue in the latest quarter, the first quarter of the company’s 2022 fiscal year, came in at $81.4 million. That represents an increase of 73.6% over the same quarter one year earlier. Growth in the latest quarter came largely as a result of a surge in revenue associated with the Wholesale segment. Sales under this category skyrocketed by 101% year over year, with a significant chunk of this improvement coming from its BOGS product line. These shoes are largely outdoor in nature, but the company has also seen strong performance in men’s dress shoes as people return to a more normal way of life and as men and other consumers restock their shoe inventories.
Author – SEC EDGAR Data
On the bottom line, the company has seen a similar trend. Net income rose modestly from 2017 through 2019, climbing from $16.5 million to $20.9 million. In 2020, the firm generated a net loss of $8.5 million. But that loss turned into a profit of $20.6 million in 2021. Other profitability metrics have been a bit more volatile. Operating cash flow has been all over the map. But the picture does look far more consistent when you adjust for changes in working capital. In fact, the trend there looks very similar to the trend when looking at EBITDA. And just as we have seen some improvement for the 2021 fiscal year, improvement in profitability continued into the 2022 fiscal year. During the first quarter, the company generated a net profit of $4.1 million. This compares favorably to the $1.3 million profit achieved one year earlier. Operating cash flow did worsen, declining from $14.2 million to just $0.2 million. But if we adjust for changes in working capital, it more than doubled from $2.4 million to $4.9 million. Meanwhile, EBITDA jumped from $2.4 million to $6.2 million over the same time frame.
Author – SEC EDGAR Data
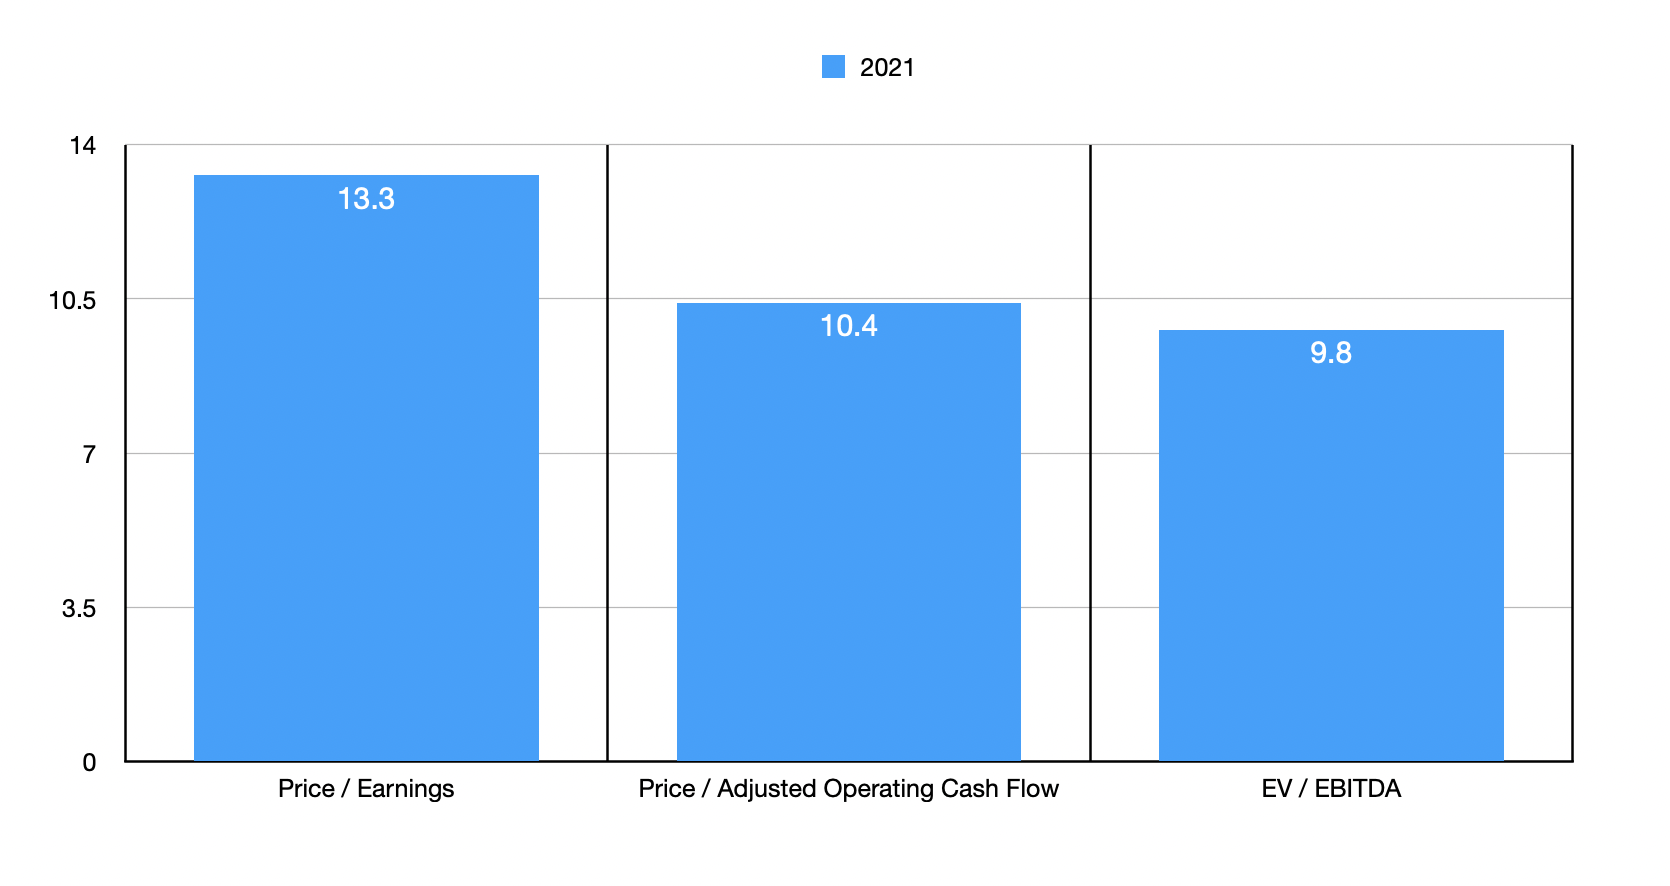
We don’t really know what the 2022 fiscal year has in store for the business. Management has not provided any real guidance for the year and I believe that for a firm this small it would not be a wise idea to project out financial performance. But that’s okay because shares look attractive even if financial performance were to stay at the 2021 levels. For instance, using our 2021 results, the company is trading at a price-to-earnings multiple of 13.3. The price to adjusted operating cash flow multiple is 10.4, while the EV to EBITDA multiple is 9.8. To put this in perspective, I decided to compare the company to five other shoe firms. On a price-to-earnings basis, these companies ranged from a low of 4.5 to a high of 44.9. And using the EV to EBITDA approach, the range was from 7.8 to 22.8. In both cases, three of the five companies were cheaper than Weyco. Meanwhile, using the price to operating cash flow approach, the range was from 6.7 to 64.4. In this scenario, only one of the five companies was cheaper than Weyco.
| Company | Price / Earnings | Price / Operating Cash Flow | EV / EBITDA |
| Weyco | 13.3 | 10.4 | 9.8 |
| Crocs (CROX) | 4.5 | 6.7 | 8.4 |
| Skechers U.S.A. (SKX) | 7.7 | 64.4 | 7.8 |
| Deckers Outdoor (DECK) | 16.1 | 42.4 | 10.4 |
| Wolverine World Wide (WWW) | 44.9 | 22.0 | 22.8 |
| Steven Madden (SHOO) | 11.0 | 20.0 | 7.8 |
Takeaway
Although small companies are often overlooked and can be more volatile and, by definition, riskier than larger firms, they can also present some of the most attractive opportunities. I wouldn’t call Weyco an incredibly compelling play by any means. But for investors who want an interesting business capable of steady growth and that is trading at levels that are fundamentally appealing, I would definitely say that it makes for a solid ‘buy’ prospect at this time.
Be the first to comment