

Justin Sullivan/Getty Images News
Conventional wisdom has told us that a rising rate environment is good for banks, yet the financial industry has declined with the markets. Bank profitability is reliant on the spread between what they earn by investing deposits and the costs of paying interest on those deposits. The Fed has been aggressive in 2022 and is projected to increase rates by another 0.75% in July. This should widen the spread even further between interest rates on loans and mortgages vs. what individuals receive from depositing their capital into savings accounts and certificates of deposit. Theoretically, the foreseeable future should be bullish for banks as rising rates will work in their favor.
On Thursday, the Federal Reserve announced that all 34 banks included in their stress test would weather a severe recession. This means that each bank included in this group would have enough capital to allow them to continue lending to households and businesses during a severe recession. With the latest stress test out of the way, I decided to look at the big banks again to find if there were any valuations that looked mispriced. I wrote an article about Citigroup (C) in May, indicating that C looked undervalued, and after looking at the group again, shares of Wells Fargo (NYSE:WFC) look as if they are mispriced as well. WFC has fallen -32.40% from its 52-week highs and has declined by -19.65% in 2022. What’s interesting to me is that WFC has held up better than most of its counterparts YTD, and the amount its declined looks to have created an opportunity going forward.
Seeking Alpha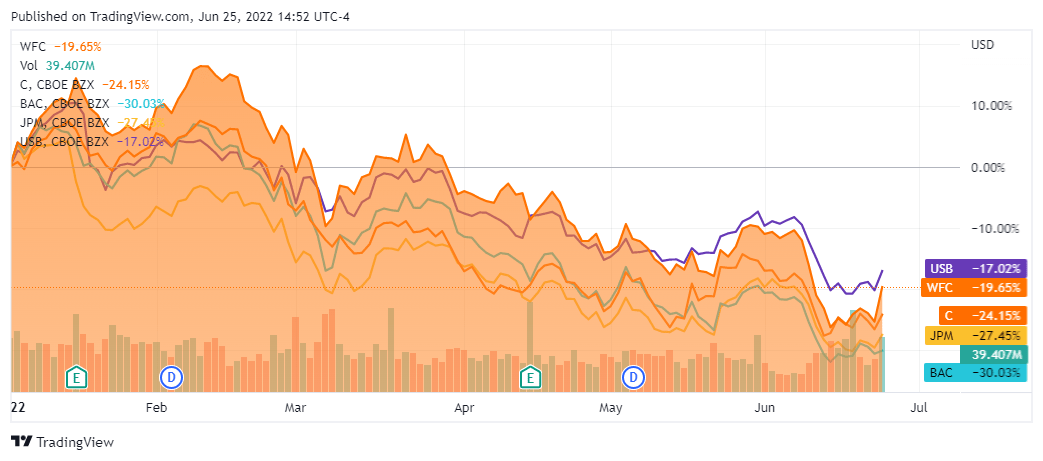
How I Will Evaluate Wells Fargo And Which Banks I Will Compare Them Against
I will compare WFC to the following banking institutions:
- The Bank of Nova Scotia (BNS)
- U.S. Bancorp (USB)
- Bank of America (BAC)
- JPMorgan Chase (JPM)
- Citigroup (C)
- Royal Bank of Canada (RY)
- The Toronto Dominion Bank (TD)
Due to their operations, financial institutions need to be looked at differently from how I would evaluate the big tech sector or midstream operators due to their operations. Here are the different metrics I will utilize and why I elected to use them:
- Price to Earnings P/E
- A company’s P/E ratio is important in comparing with similar firms in the same industry.
- Price to Book P/B
- P/B ratios are commonly used to compare banks, because most assets and liabilities of banks are constantly valued at market values.
- Loan Deposit Ratio LDR
- indicates the banks liquidity.
- Equity to Market Cap
- Valuation the market has placed on the company’s equity
- Tangible book value to market cap
- tangible book value excludes the value of intangible assets such as goodwill. Intangible assets such as goodwill are not as easy to liquidate as tangible assets, and even though they have value, I believe finding the tangible book value is a more realistic measure of a company’s value. I wanted to see how the tangible book value compared to each company’s market cap
- Dividend Yield and Payout Ratios
- Amount of earnings each company pays per share through its dividend and how much of its earnings are paid
- % difference between tangible book value and share price
- Indicates if the market is discounting a company’s shares or placing a premium on them
- % difference between market cap and equity
- Indicates if the market is placing a positive multiple on a company’s equity of discounting it
Looking At WFC Compared To Its Peers And Seeing Where The Value Is
Steven Fiorillo, Seeking Alpha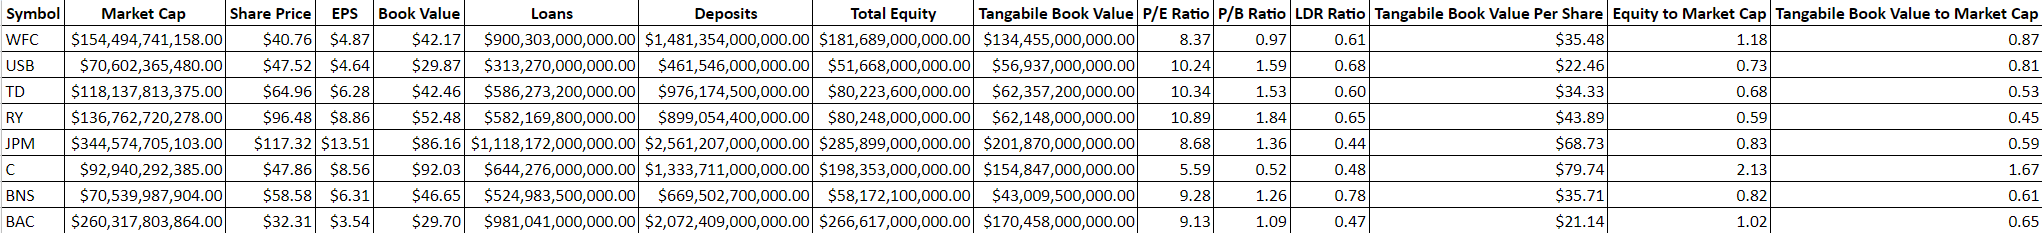
WFC is trading at the 2nd lowest P/E ratio, with C still trading at the lowest P/E. Many investors start by looking at the P/E, but it’s just one component in the overall story. A company with a high earnings growth rate should typically command a higher P/E ratio because the EPS is increasing faster than the EPS of a slow-growth company. WFC is a well-established company, so I am expecting a much lower P/E than what I would expect from a tech company.
Steven Fiorillo, Seeking Alpha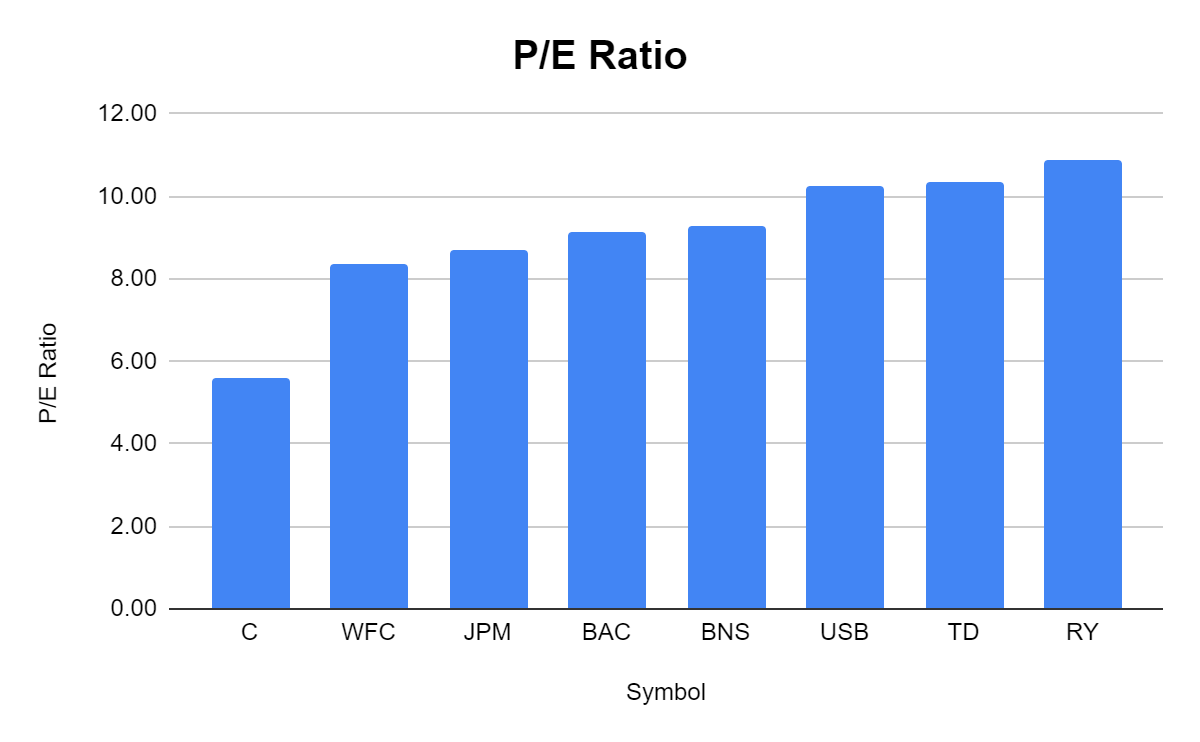
Next is the P/B ratio. The book value of a company is the net value of all its assets after deducting liabilities. This indicates how much capital an individual needs to invest in a company’s net assets. Since a bank’s assets and liabilities are marked to the market, its book value should theoretically resemble the share price or market value. WFC has the 2nd lowest P/B out of the group and remains under a P/B of 1, indicating it is undervalued. The range after WFC is 1.09 – 1.84, which indicates the market is placing a much larger valuation on other banks than WFC.
Steven Fiorillo, Seeking Alpha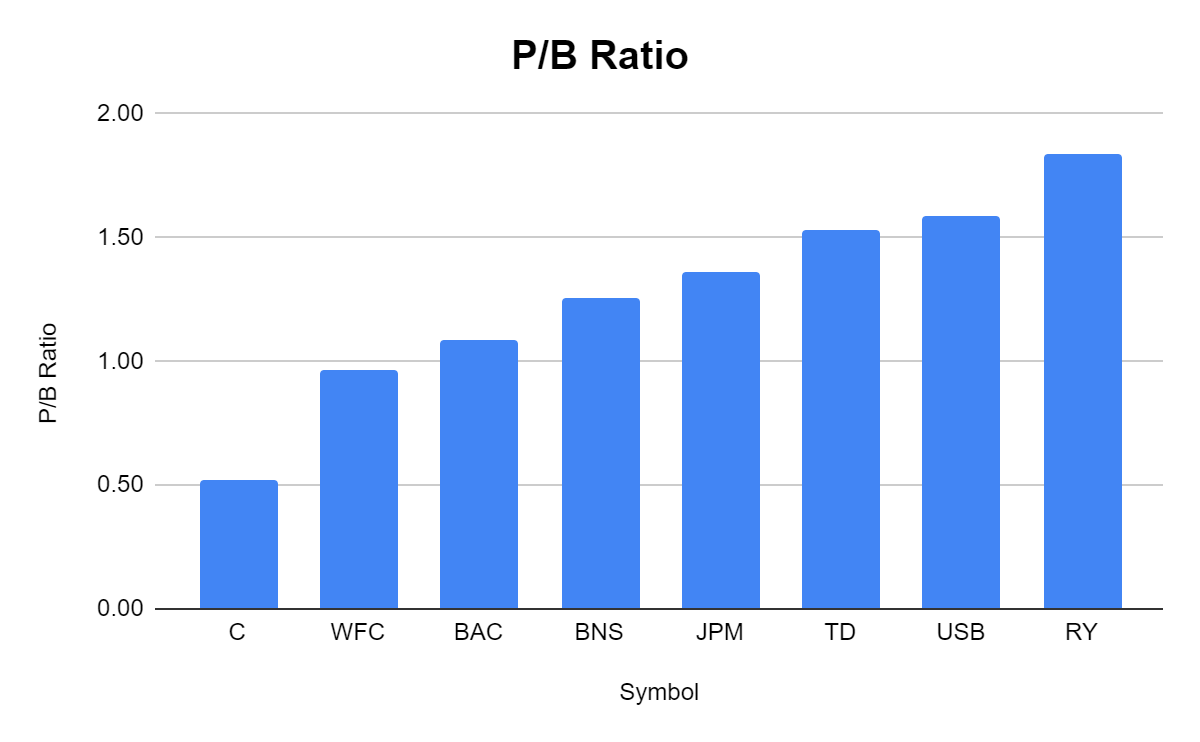
The LDR ratio is critical in assessing a bank’s liquidity. If this metric is too high, the bank may be susceptible to a bank run due to rapid changes in its deposits, meaning it may not have enough funds to cover its requirements. If the ratio is too low, it can indicate that a bank is not meeting its earning potential. The range of the group is 0.44 – 0.78, and WFC falls just above the midpoint at 0.61. This metric would indicate that WFC is at least fairly valued and could be looked at as undervalued compared to RY, USB, and BNS.
Steven Fiorillo, Seeking Alpha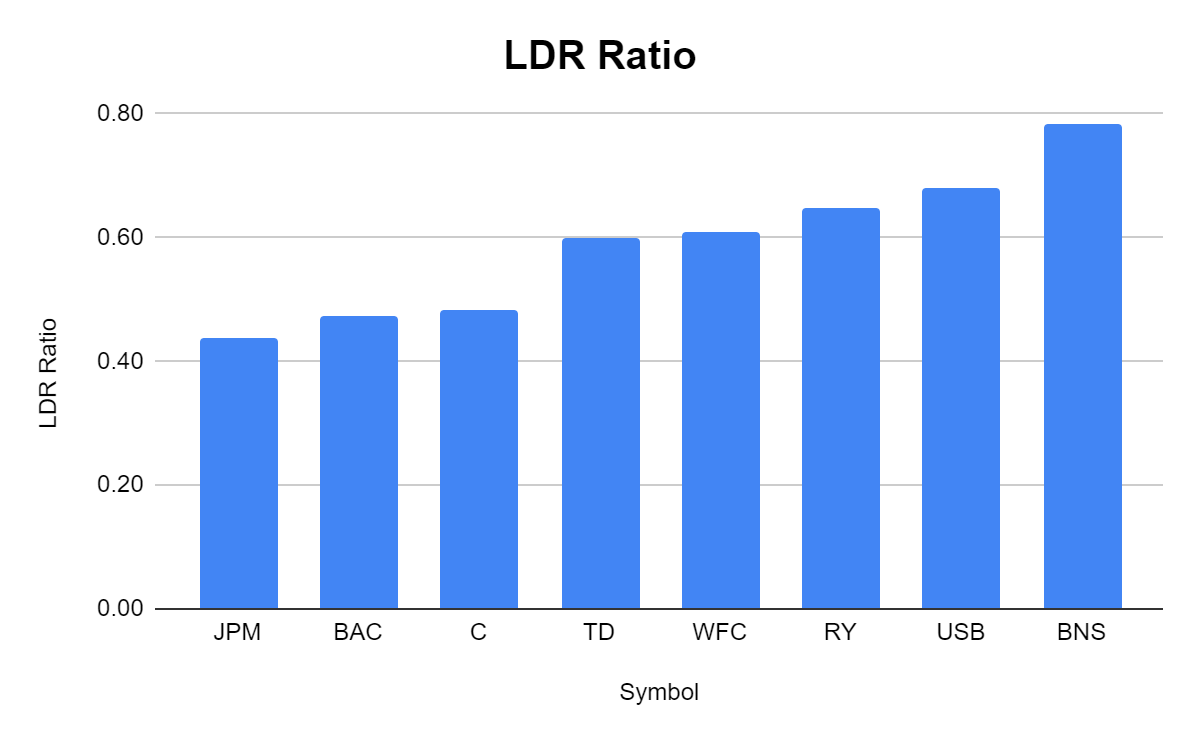
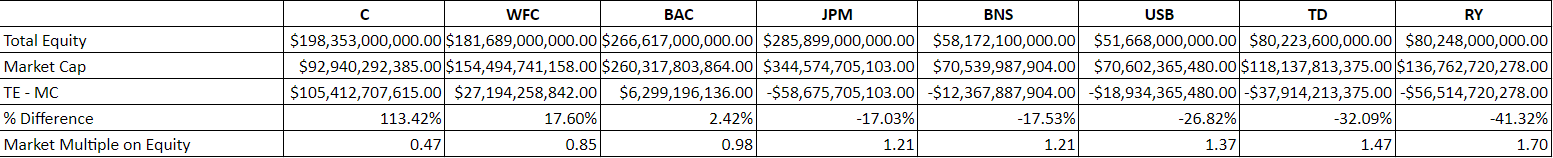
Here is where it gets very interesting from a valuation standpoint. WFC has a 1.18x equity to market cap ratio, meaning that the market is discounting WFC’s total equity on its balance sheet. WFC is trading at less than a 1:1 valuation on its equity, where you see most companies be given some type of premium in the marketplace. The average equity to market cap of the group is actually 1x, indicating that WFC is undervalued.
Steven Fiorillo, Seeking Alpha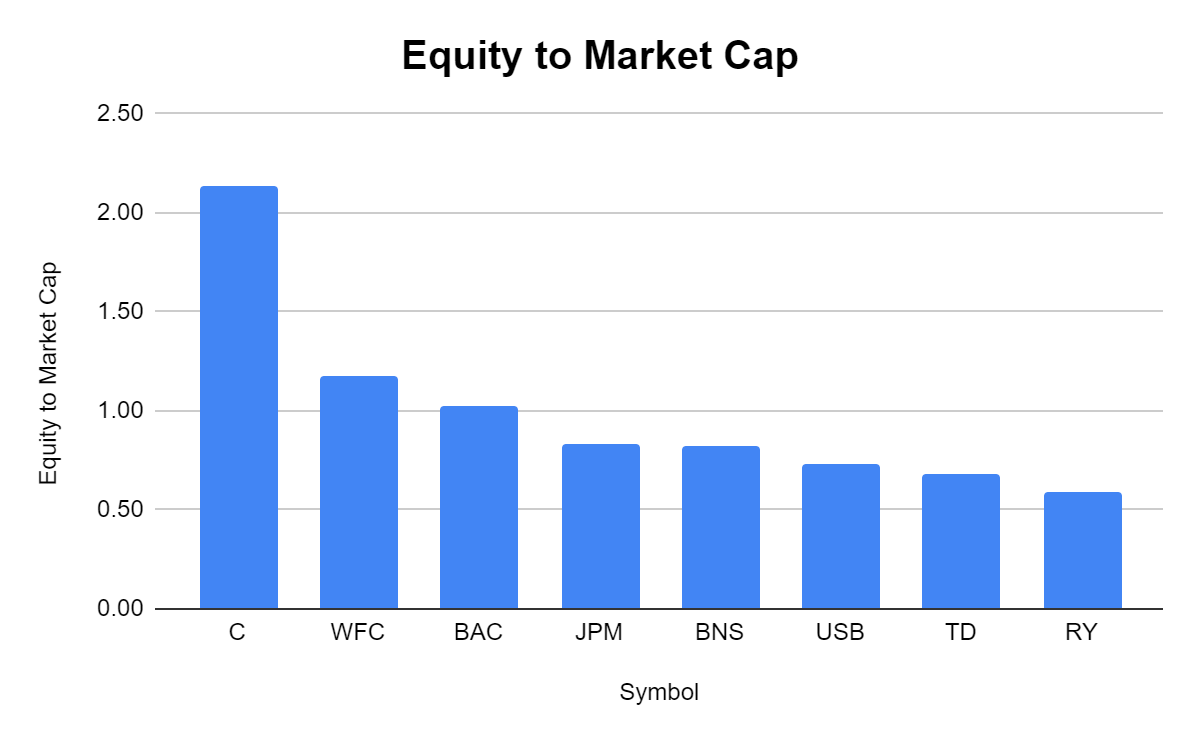
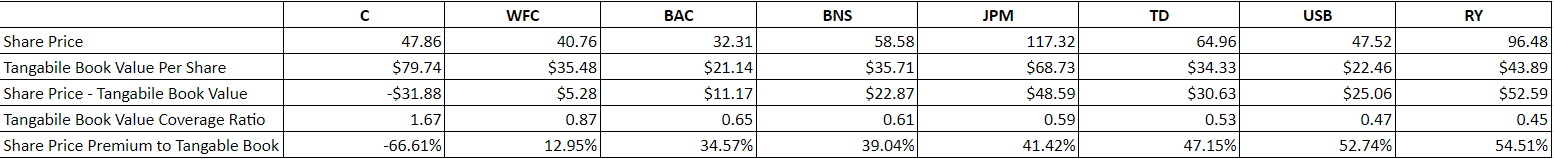
The last valuation metric I will look at is the tangible book value to market cap. Tangible book value is more focused than book value because it strips out items under a company’s assets, such as goodwill and intangible assets. These items can’t be sold at auction if a company is forced into liquidation. I think of the tangible book value as the hard assets that can be sold for cash. The tangible book value will be lower than the book value because not every asset can be easily liquidated.
The average tangible book value to market cap is 0.77x, and WFC has a ratio of 0.87x, indicating its undervalued. When C is stripped away since it’s off the charts compared to the peer group, the group’s average declines to 0.64x, making WFC look even more undervalued as a much larger valuation is placed on every other bank than WFC.
Steven Fiorillo, Seeking Alpha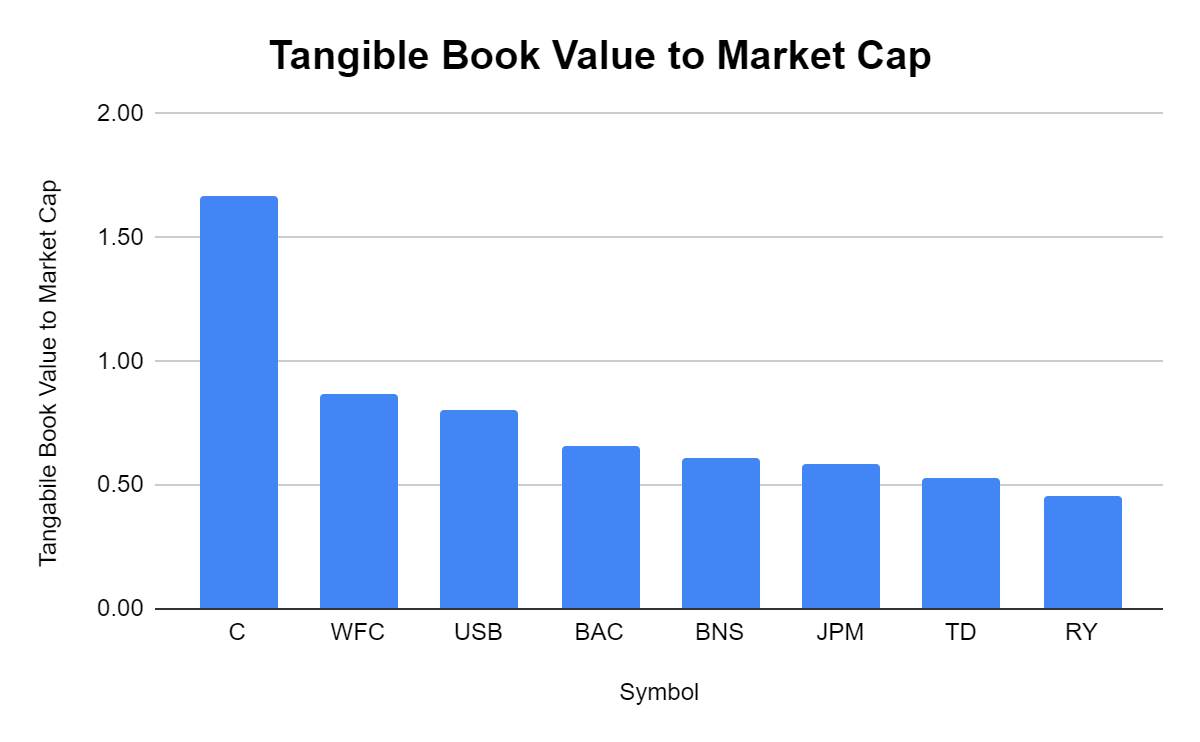
Uncovering How Much Value Could Be Left On The Table From WFC’s Current Valuation
WFC has a tangible book value per share of $35.48 and a current share price of $40.76. This places their shares at $5.28 or 12.95% over their tangible book value. WFC’s tangible book coverage ratio compared to its share price is 87%. C is wildly outside of the peer group range, so I will exclude C for a moment. Looking at the group ex-C, WFC trades at a 12.95% premium to tangible book value per share while the range expands to 54.51% for RY. BAC is the next in line, and its share price premium to tangible book value is 34.57%, a considerable jump from the 12.95% premium the market is placing on WFC.
Steven Fiorillo, Seeking Alpha Steven Fiorillo, Seeking Alpha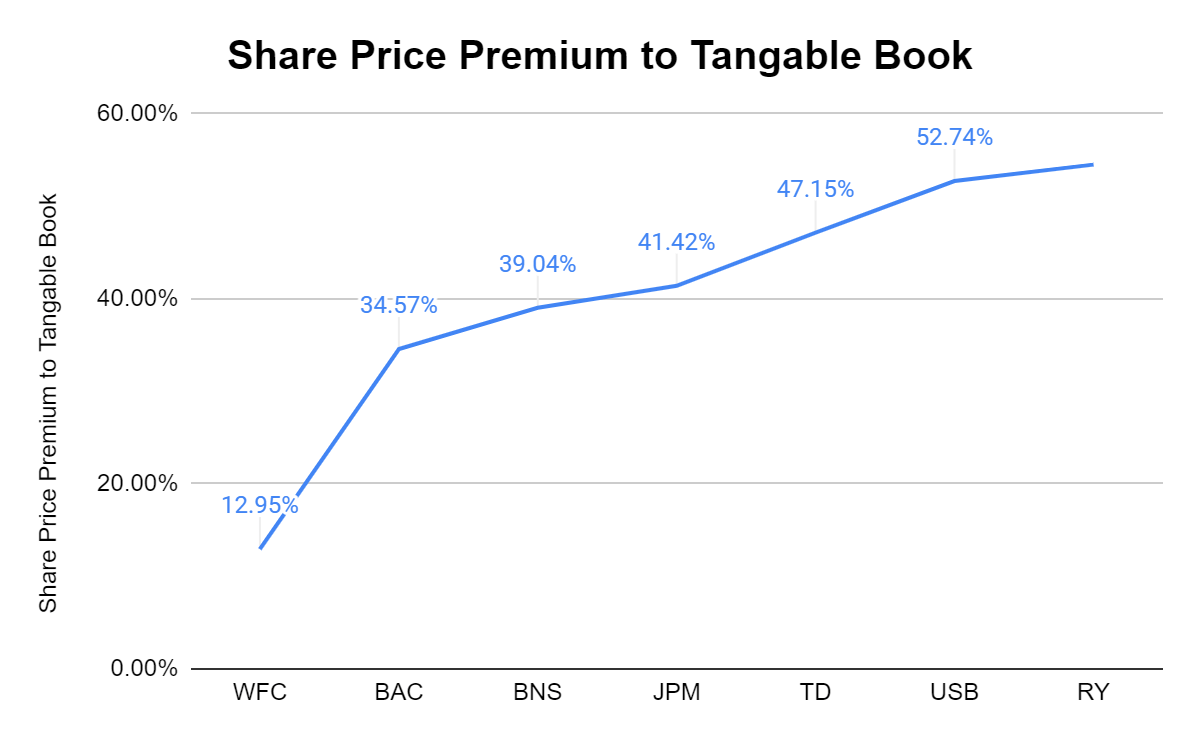
The market is providing a slight premium on WFC’s tangible book value but is discounting WFC’s equity. WFC’s equity is trading at $0.85 on the dollar. Excluding C, WFC and BAC are the only two trading under a 1:1 ratio of equity to market cap. The market has placed a 1.7x multiple on RY, a 1.47x multiple on TD, and a 1.37x multiple on USB. The market seems to be placing a deep discount on WFC’s equity compared to other financial institutions.
Steven Fiorillo, Seeking Alpha Steven Fiorillo, Seeking Alpha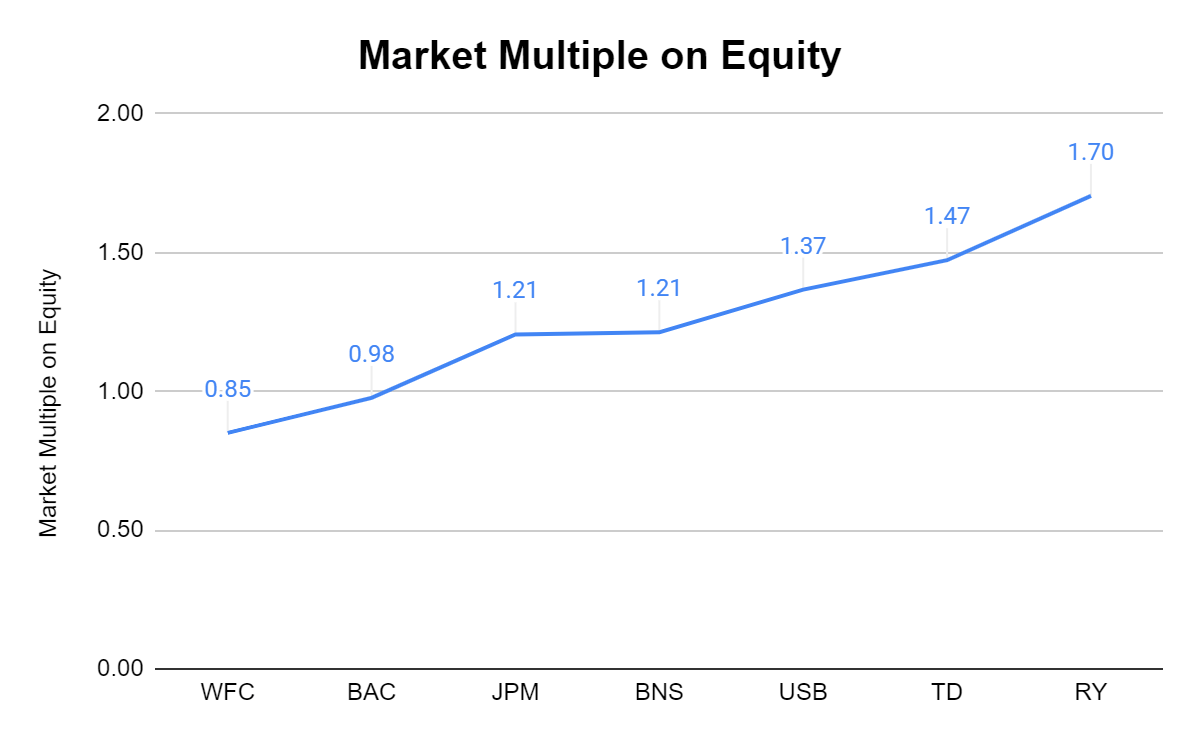
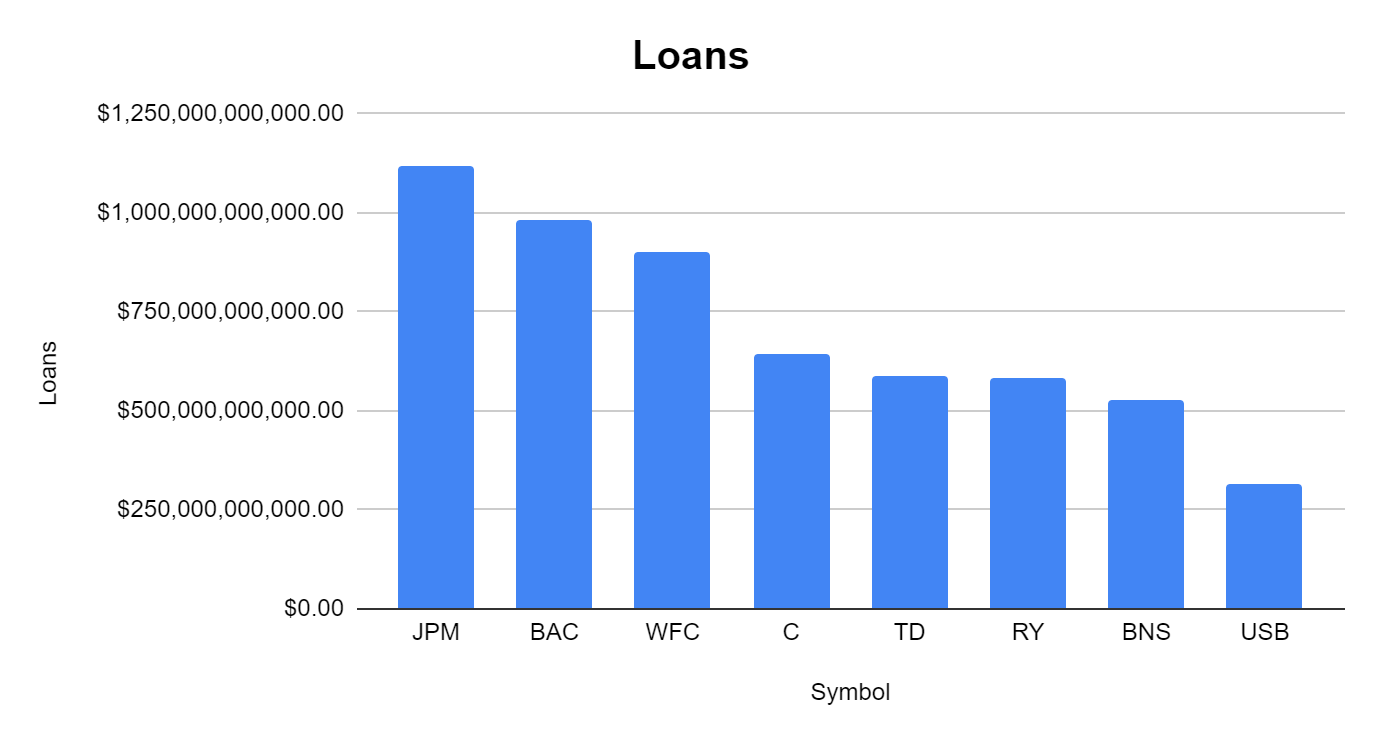
When C is excluded, WFC looks to be the cheapest valuation in the peer group. I wanted to go back to the LDR ratio components and make a specific comparison. When I looked at the LDR Ratio WFC seemed to be fairly valued presently. The two components of the LDR ratio are loans and deposits. WFC has the 3rd largest number of deposits at $1.48 trillion and has made the 3rd largest amount of loans at $900.3 billion.
The market has placed a 1.37x multiple on USB’s equity, and its current share price is 52.74% over its tangible book value, yet USB has $461.55 billion in deposits and $313.27 billion in loans. RY is the richest valued bank in the group with a 1.7x ratio on its equity and trades at a 54.51% premium to its tangible book value, yet it has $899.05 billion in deposits and $582.17 billion in loans.
The valuations which are placed on companies in the same sector doesn’t always make sense and often create opportunities, just like with WFC today. Theoretically, in a rising rate environment, a bank with more loans should make more money, and when there is a wide enough spread between deposits and loans, there will be further opportunities to originate new loans at higher rates. It doesn’t make sense that WFC has the 3rd largest level of deposits and loans while being the 2nd most undervalued in the peer group.
Steven Fiorillo, Seeking Alpha Steven Fiorillo, Seeking Alpha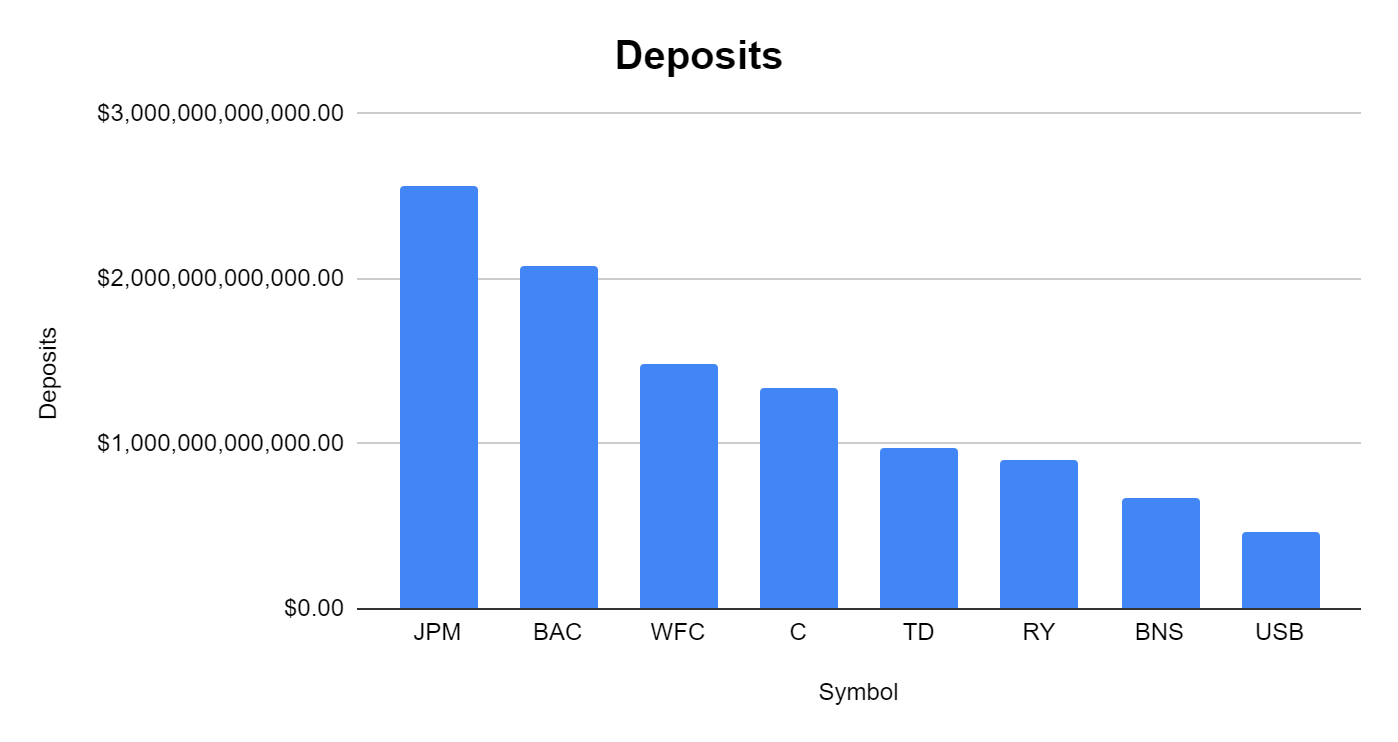
Pre-Pandemic WFC Had A Robust Growing Dividend, Can It Get Back There?
At the beginning of 2020, shares of WFC traded at $53.42 with a dividend of $2.04, creating a 3.82% yield. During the financial crisis, WFC cut its dividend from $0.34 per quarter to $0.05 per quarter. In 2011 WFC started raising its dividend as its quarterly dividend increased from $0.05 to $0.12. From 2010 to 2020, WFC provided 9 dividend increases, bringing its quarterly dividend to $0.51 or an annualized rate of $2.04. The pandemic forced WFC to cut its dividend once again, reducing it to $0.10 quarterly from $0.54. WFC has provided investors with 2 dividend increases since the reduction bringing the quarterly dividend to $0.20 and then $0.25.
Now the question remains if WFC will be able to return its dividend to its former glory the way management was able to after the financial crisis. In 2019, WFC paid out a dividend of $1.92 per share while generating $4.12 in EPS. WFC had a payout ratio in 2019 of 46.6%. In the TTM, WFC has paid out $0.75 per share while producing $4.87 in EPS which is a payout ratio of 15.4%. I believe WFC will do well in the future, and rising rates will drive additional EPS. The combination of additional EPS and a low payout ratio should allow WFC to continue modest increases and grow its dividend. I think WFC has the ability to return its dividend back to its former glory over the next several years.
Seeking Alpha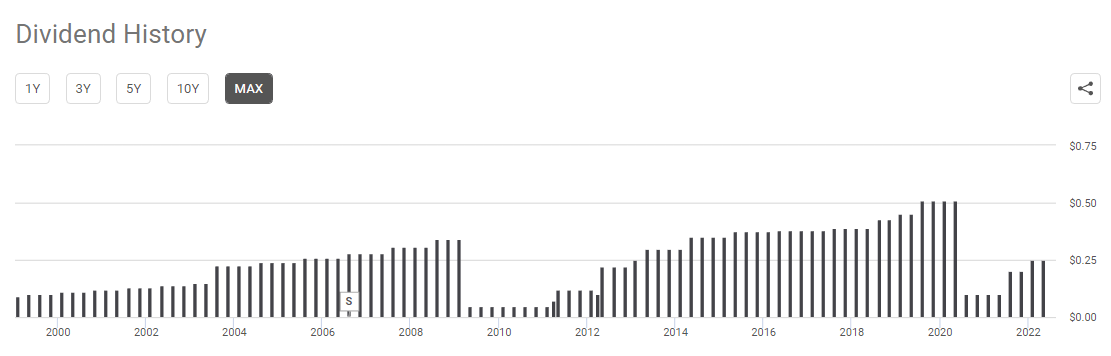
Conclusion
The banking sector has not performed well in 2022, and the Fed raising rates hasn’t seemed to help much. WFC has declined by more than -30% since its 52-week highs, which has created an interesting opportunity. From a valuation perspective, WFC seems to be undervalued, considering the market has discounted its equity and placed a lower-than-average premium on its tangible book value. Based on WFC’s deposits and current loans, rising rites should help deliver additional EPS growth in the future. WFC has started growing its dividend since the reduction in 2020. WFC has a dividend payout ratio of 15.4% over the TTM, and after the most recent stress test, I am not seeing any reason why WFC wouldn’t have the ability to grow its dividend over the next several years. I think WFC will rebound in the 2nd half of 2022, and this could be a capital appreciation play with future dividend growth mixed in.
Be the first to comment