

BTCUSD – Bullish Engulfing Pattern Above $19700
Bitcoin continues its bullish momentum this week as the price is moving upside now trading above the $20000 handle in the European Trading session.
We can see a continued consolidation in the levels of Bitcoin after every decline and the prices are now gaining a bullish traction ahead of the US Trading session.
The long-term investors are coming back into the markets as the demands for Bitcoin are increasing due to the increase in global inflation rates.
We can clearly see a Bullish Engulfing Pattern Above the $19700 handle which is a Bullish reversal pattern because it signifies the end of a Downtrend and a shift towards an Uptrend.
Both the STOCH and STOCHRSI are indicating Overbought levels which means that in the immediate short term a decline in the prices is expected.
Relative Strength Index is at 49 indicating a NEUTRAL demand for the Bitcoin at the current market levels.
Bitcoin is now moving Below its 100 hourly Simple Moving average and its 200 hourly Simple Moving averages.
All of the Major Technical Indicators are giving a STRONG BUY Signal, which means that in the immediate short term we are expecting targets of 21500 and 23000.
Average True Range is indicating LESS Market Volatility with a Bullish Momentum.
· Bitcoin continues Bullish Momentum Above $19700.
· Williams Percent Range is Indicating OVERBOUGHT Levels.
· The price is now trading just Above its Pivot Levels of $20834.
· All of the Moving Averages are giving a BUY market signal.
Bitcoin Continues Bullish Momentum Above $19700
The prices of Bitcoin have entered into a consolidation channel above the $20000 handle and the continuation of the bullish momentum above the $20500 levels.
The global sentiments have improved and now the prices are forming an Ascending Triangulation pattern and a short-term rally above $22000 is expected.
We can see a close co-relation between the movement of prices in Bitcoin and Nasdaq 100 index.
The immediate short-term outlook for Bitcoin is Bullish, Medium-term outlook has turned as Neutral, and the long-term outlook remains Neutral under present market conditions.
Bitcoin is now facing resistance below $22000 as it failed to clear it on 26th June after touching a high of $21865.
The price of BTCUSD is now facing its Classic resistance levels of 20936 and Fibonacci resistance levels of 20998 after which the path towards 22000 will get cleared.
In the last 24hrs BTCUSD has decreased by 2.35% by 502$ and has a 24hr trading volume of USD 21.622 Billion. We can see an Increase of 6.09% in the Trading volume as compared to yesterday, which appears to be Normal.
The Week Ahead
The prices of Bitcoin are moving in a Bullish momentum and the immediate targets are $21500 and $22500
The Daily RSI is printing at 34 which means that the medium range demand continues to be WEAK.
We can see that the prices of Bitcoin have stabilized above the $20000 handle and now we are looking at the important support levels of $21045 and $21599.
The prices of BTCUSD will need to remain above the important support levels of $20000 this week.
Weekly outlook is projected at $22500 with a consolidation zone of $21500.
Technical Indicators:
Average Directional Change(14days): It is at 41.40 indicating a BUY.
Ultimate Oscillator: It is at 56.99 indicating a BUY.
Rate of Price Change: It is at 0.341 indicating a BUY.
Commodity Channel Index(14days): It is at 111.24 indicating a BUY.
XRPUSD – Bullish Pennant Pattern Above 0.3239
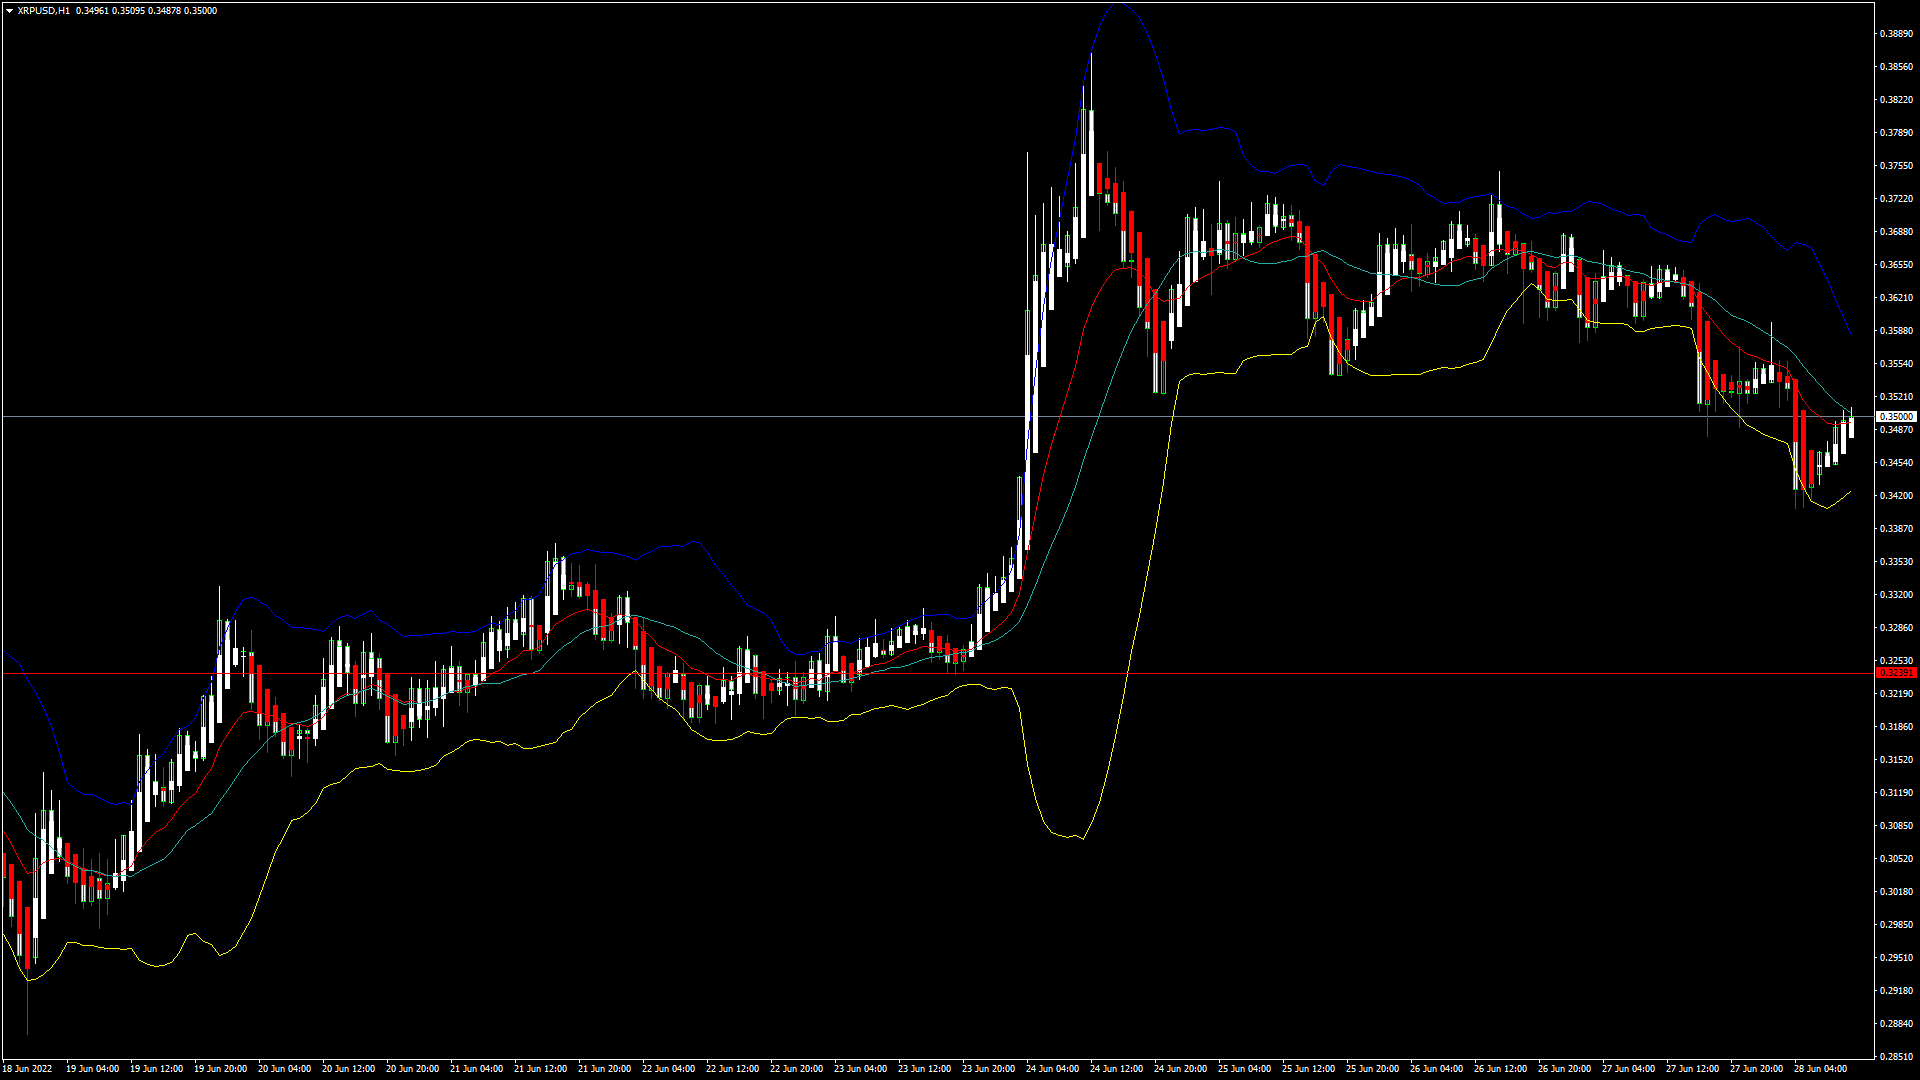
Ripple continues its bullish momentum as the prices continue to move upside now trading above the 0.3400 handle in the European Trading session today.
We can see that prices have crossed the 20-day and 50-day Moving Average in the 15 minutes timeframe indicating that the trend is upwards.
We saw that the prices of Ripple touched a high of 0.3869 on 24th June after which a short-term decline was seen.
We can clearly see a Bullish Pennant Pattern above the 0.3239 handle which is a continuation pattern and signifies an Uptrend.
The Short-term outlook for Ripple has turned as Bullish, Medium-term outlook is Neutral, and the Long-Term outlook is Neutral under present market conditions.
Relative Strength Index is at 46 which signifies a NEUTRAL demand for the Ripple at the current market prices and the continuation of the Consolidation channel this week.
Some of the Moving Averages are giving a BUY Signal at the current market levels of 0.3496
Ripple is now trading Below its Pivot levels of 0.3562 and is now facing its Classic Resistance levels of 0.3641 and Fibonacci Resistance levels of 0.3748 after which the path towards 0.4000 will get cleared.
Most of the Major Technical Indicators are giving a STRONG BUY Signal.
· Ripple Bullish Continuation seen Above the 0.3239 levels.
· The STOCHRSI is indicating OVERBOUGHT levels.
· Average True Range indicates LESS Market Volatility.
· Some of the Technical Indicators are giving a NEUTRAL market signal.
Ripple Bullish Continuation Seen Above 0.3239
We can see that the prices of Ripple have entered into a consolidation channel above the 0.3400 handle in the European Trading session today.
The prices of Ripple continue to remain under pressure today and failed to clear the daily resistance levels of 0.3600.
Ripple is now poised to recover its losses against the US Dollar and is now preparing to stage a recovery above the 0.4000 handle.
We can see that XRP touched a Low of 0.3408 in the European Trading session and an Intraday High of 0.3595 in the Asian Trading session today.
The price of XRPUSD has decreased by 3.46% with a price change of $0.01259 in the past 24hrs and has a trading volume of 0.972 Billion USD.
We can see an Increase of 0.90% in the Trading volumes of Ripple as compared to yesterday, which appears to be Normal.
This Week Ahead
The prices of XRPUSD are now moving into a Consolidation Channel above the 0.3400 handle and the next visible targets are 0.3600 and 0.3800
The investors are awaiting the outcome of the US SEC case against the Ripple Labs, with many analysts maintaining a bullish outlook on its prices and the key rulings in favor of Ripple Labs.
In the next week Ripple is expected to enter into a fresh wave of buying above the 0.3600 handle
The weekly outlook for Ripple is projected at 0.3850 with a consolidation zone of 0.3600
Technical Indicators:
Commodity Channel Index: It is at 64.55 indicating a BUY.
Average Directional Change(14days): It is at 24.92 indicating a BUY.
Rate of Price Change: It is at 9.065 indicating a BUY.
Ultimate Oscillator: It is at 53.46 indicating a BUY.
Be the first to comment