

TSLA, AMZN, FOMC, USD Talking Points
We’re now almost a month into Q2 trade and, so far, there’s been decisive moves posting in both the US Dollar and US equities. The Dollar topped on the final day of Q1 and has been heading lower ever since, and equity bulls jumped back on the bid to force another series of fresh all-time-highs in the S&P 500. We’ll hear more on the matter on Wednesday at the Federal Reserve’s April rate decision. This is not a quarterly meeting, so there will not be an update to the bank’s projections nor will we receive an updated dot plot matrix.
But that’s not all that’s on the calendar for this week, as we’re deep into earnings season and each day sees a flurry of quarterly reports from American corporates. Today sees Tesla report, and this is a big focal point for both ESG and tech. Tomorrow morning sees UPS, 3M and BP report before the bell with AMD, Microsoft, Alphabet and Visa. Wednesday’s Fed day has Boeing before the bell with Apple, Facebook and Qualcomm reporting after the close, competing with FOMC headlines. And Thursday is especially big with a number of companies reporting, highlighted by the Amazon call after market close.
Starts in:
Live now:
Apr 28
( 13:04 GMT )
Join the Mid-Week Strategy Check
Mid-Week Market Updates Featuring James Stanley, Senior Strategist
In the S&P 500, last week saw a dragonfly doji build as bulls stumbled at that fresh all-time-high. That fresh all-time-high also came with an overbought reading via RSI on the Daily chart, pointing to just how powerful this Q2 breakout has been so far. The 4200 level is proving to be problematic for bulls at this point.
S&P 500 Daily Price Chart
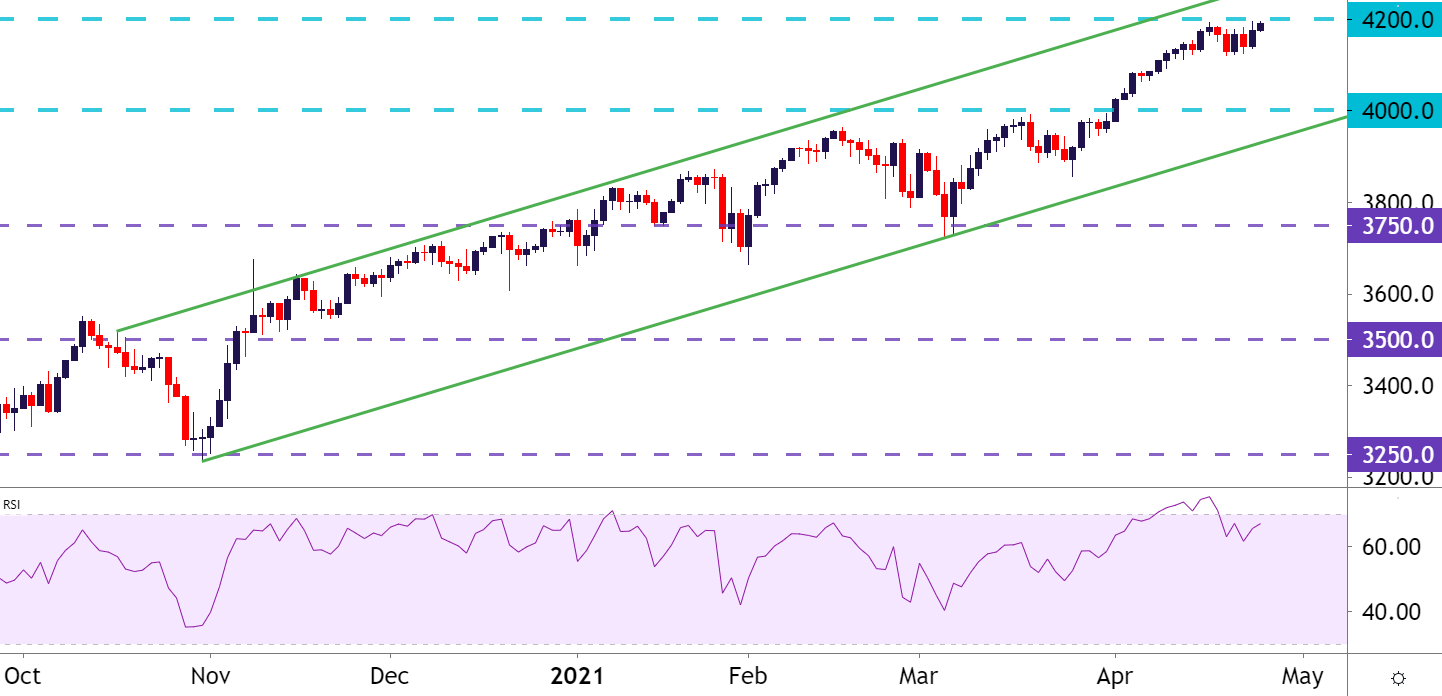
Chart prepared by James Stanley; SPX500 on Tradingview
TSLA Focus on Deliveries
Just a few weeks ago Tesla announced a record in deliveries for Q1. But, many of those deliveries were for the lower-priced Model 3 and Model Y, begging the question as to how financial performance came in on those record deliveries. Also of interest – full year delivery targets, which may be announced this afternoon.
In Tesla’s stock, the big question is whether the bullish trend is coming back. While leading equities through 2020 trade, the 2021 open saw the stock stumble, putting in a 40% retracement from the January high to the March low. More recently, however, a theme of recovery has shown with TSLA setting higher-low support at the 23.6% Fibonacci retracement of the 2020 major move. This level is also confluent with prior resistance, keeping the door open for bullish themes.
Tesla Daily Price Chart
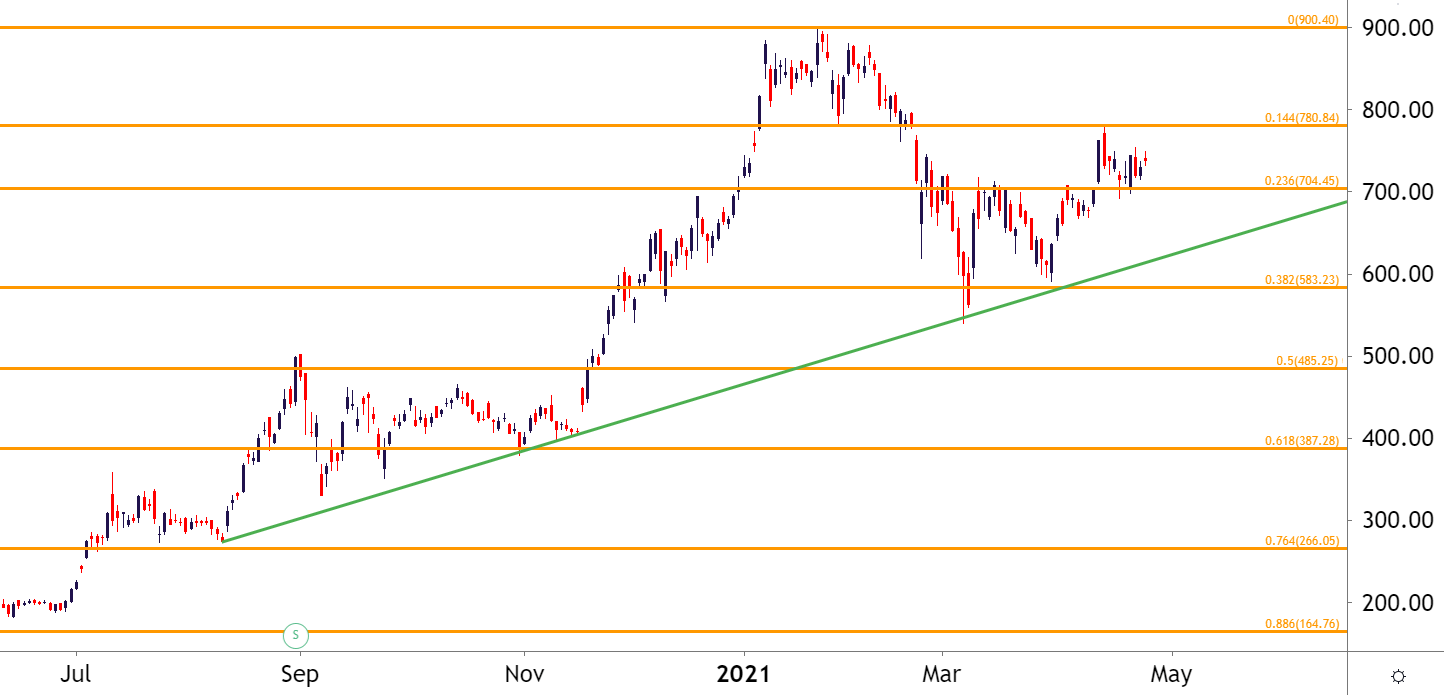
Chart prepared by James Stanley; TSLA on Tradingview
Amazon Builds a Range
Amazon headlines a busy Thursday of earnings releases. But, in the stock, the big question is whether the range is ready to give way. Similar to Tesla, Amazon was very much a leader in the equity strength theme last year. But where these two stocks differ is when they topped – Amazon topped back in early-September while Tesla topped a few months later.
In Amazon, since that top was set, prices have been downright range-bound. And prices are in an area that’s elicited a few different resistance responses over the seven months that this range had been building.
Amazon Daily Price Chart AMZN
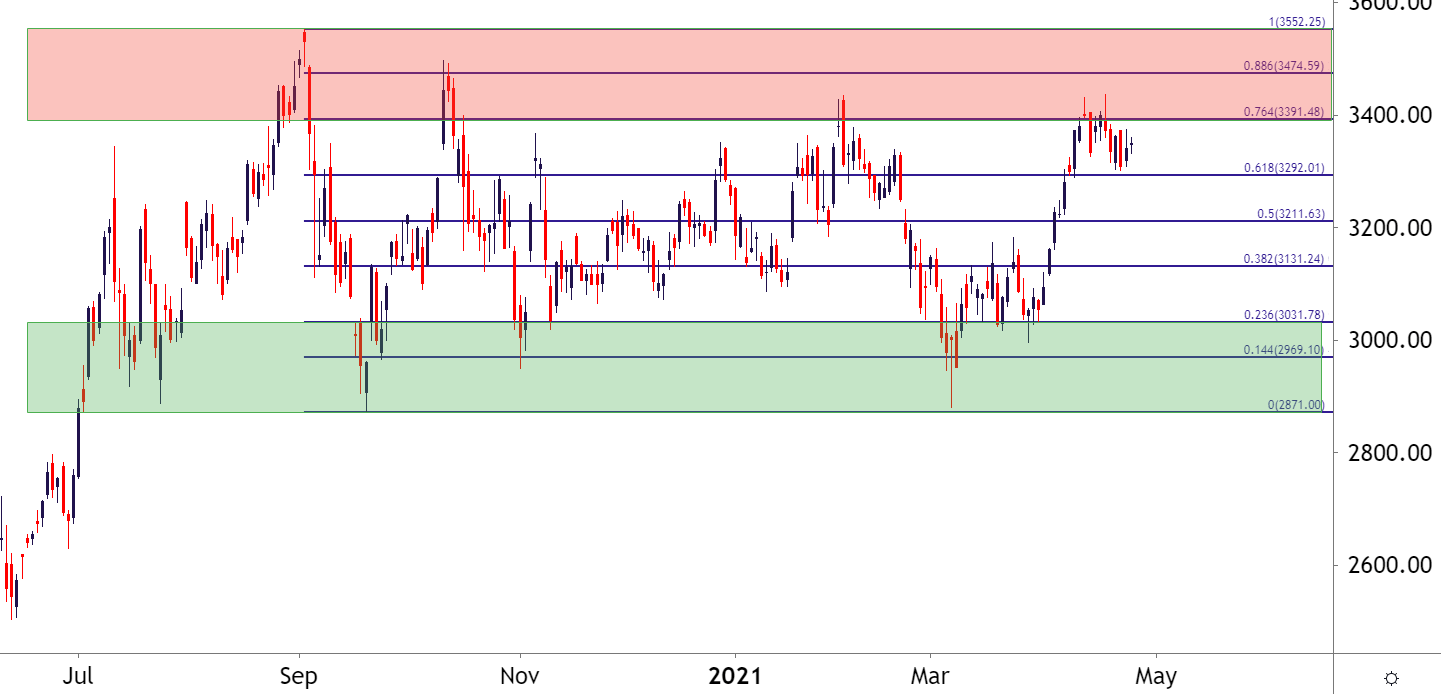
Chart prepared by James Stanley; AMZN on Tradingview
US Dollar Pre-FOMC
On the macro front, that FOMC rate decision on Wednesday sticks out. So far in Q2 USD weakness has been a very clear theme as the currency has reversed a large portion of those Q1 gains. This was what I was looking for in the Q2 technical forecast, driven by the assumption that last quarter was a counter-trend bounce from oversold conditions.

Recommended by James Stanley
Get the Q2 US Dollar Forecast
On the Daily chart of the US Dollar below, we can see where today’s bar is hanging on the 61.8% retracement of that Q1 bounce. This also highlights resistance potential around the 50% marker of that same major move, plotted around the 91.40 area on the DXY chart.
To learn more about Fibonacci, join us in DailyFX Education
US Dollar Daily Price Chart
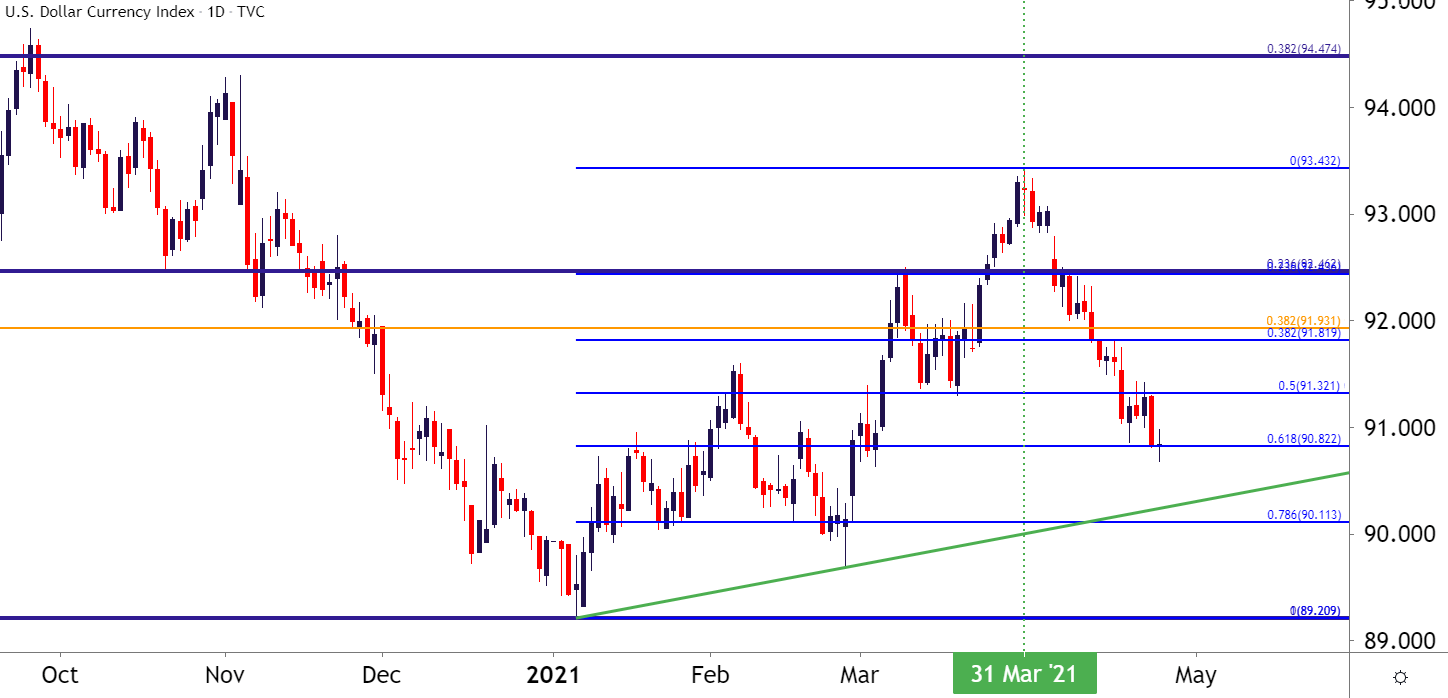
Chart prepared by James Stanley; USD, DXY on Tradingview
— Written by James Stanley, Senior Strategist for DailyFX.com
Contact and follow James on Twitter: @JStanleyFX
Be the first to comment