

Thinkhubstudio
The Nebraska Tax-Free Income Fund returned -2.94% in the third quarter compared to a -2.71% return for the Bloomberg 5Year Municipal Bond Index. Year-to-date, the Fund’s total return was -8.04% compared to a -8.06% return for the index.
Overview
The Federal Reserve continued raising short-term interest rates in the third quarter of 2022 as inflationary pressures in the U.S. economy provided little signs of easing. The Federal Open Market Committee’s (FOMC’s) monetary actions have lifted the benchmark federal funds rate from zero at the beginning of 2022 to a range of 3.00-to-3.25% as of the end of the third quarter — with historically outsized rate hikes of 0.75% at their June, July, and September meetings.
The chart below shows the unprecedented pace at which the FOMC is raising rates to get current high inflation under control.
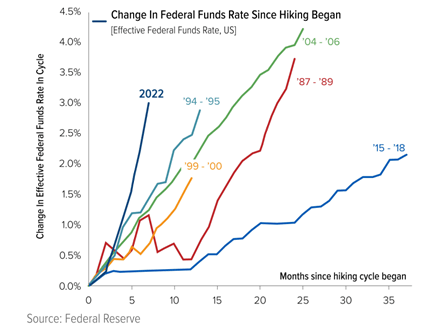
No other rate hiking cycle has begun this steeply since the 1980s (when the Fed started targeting the federal funds rate as its primary tool for conducting monetary policy). And the Fed’s newfound fondness for hiking rates appears set to continue well into 2023 with some economists predicting the benchmark federal funds rate to hit as high as 5% sometime next year.
While the steepness of the 2022 curve has negatively impacted year-to-date returns for nearly all fixed-income investors, it has also set the stage for more favorable forward returns. This can be seen in the Fund’s improved yield-to-worst (YTW) metric. As a reminder, YTW has historically been a reasonable predictor of forward returns. The Fund’s YTW increased from 2.6% on June 30, 2022, to 3.5% on September 30, 2022 — and up from 0.8% on December 31, 2021.
Municipal bonds modestly underperformed Treasuries in the third quarter as yield ratios of municipal bonds relative to comparable U.S. Treasuries moved higher. The ratio of the 5-year AAA-rated municipal bond to the 5-year Treasury, for example, increased from 75% on June 30, 2022, to 77% on September 30, 2022. This ratio, which registered a 20+ year monthly low at year-end 2021 and is now modestly below the 10-year average, remains a reasonably useful tool in measuring the relative attractiveness of tax-free municipal bonds compared to U.S. Treasury bonds.
Top Quarterly Contributors
No segment generated positive results in the quarter
Top Quarterly Detractors
- School district general obligation bonds issued by Papillion-La Vista, Nebraska, School District; Sarpy County, Nebraska,
- School District (Bellevue), Wayne County, Nebraska, School District; and Cass County School District (Weeping Water) Tax-supported lease revenue bonds issued by Omaha, Nebraska, Public Facilities Corporation; Sarpy County, Nebraska, certificates of participation; and Papillion, Nebraska, Municipal Facilities Corporation
- Combined utility revenue bonds issued by Dawson, Grand Island, Columbus, and Municipal Energy Agency of Nebraska City general obligation bonds issued by Bellevue, Columbus, and Norfolk, Nebraska
- General revenue bonds issued by Boys Town Village
- Higher education revenue bonds issued by Nebraska State College Facilities Corporation, University of Nebraska, and
- Saline County (Doane University)
- Electricity and power revenue bonds issued by Omaha Public Power District, Nebraska Public Power District, and Public
- Power Generation Agency of Nebraska (Whelan Energy Project)
- County general obligation bonds issued by Seward County, Nebraska; and Bexar County, Texas Water and sewer revenue bonds issued by Omaha Sanitary Sewer
- Hospital revenue bonds issued by Douglas County, Nebraska, Health Facilities (Nebraska Medicine)
- Airport revenue bonds issued by Austin, Texas; Lincoln, Nebraska; and San Diego County, California
- Single-family housing revenue bonds issued by Nebraska Investment Finance Authority
Turning to portfolio metrics, the average effective duration of the Fund decreased in the quarter to 3.9 years on September 30, 2022, from 4.0 years on June 30, 2022. Average effective maturity increased to 4.8 years from 4.1 years over the same time period. Overall asset quality remains high, with approximately 93% rated A or better by one or more of the nationally recognized statistical rating organizations.
While it is particularly unpleasant to report on this year’s Fund performance, we are pleased to report that the underlying fundamentals (credit quality) of most of our investments continue to perform at or better than original expectations — and we believe potential forward returns have improved dramatically as highlighted by the Fund’s improved yield-to-worst.
Yogi Berra — the famous baseball player well-known for his many Yogi-isms — is credited with saying “it’s tough to make predictions, especially about the future.” Good advice, especially in credit and equity markets. Our role as money managers, per one of the founders of Gavekal Research, is to “adapt” to market environments and not forecast.
There is no mistaking that this has been an historically challenging year for municipal bond investors — the worst on record as highlighted by the chart below of Bloomberg investment-grade and high-yield municipal indexes.
|
Year |
Muni IG Index (1Q-3Q Total Return) |
Year |
Muni HY Index (1Q-3Q Total Return) |
|
2022 |
-12% |
2022 |
-16% |
|
1981 |
-9% |
2008 |
-7% |
|
1980 |
-5% |
2013 |
-5% |
|
1994 |
-4% |
2015 |
0% |
|
2008 |
-3% |
2020 |
0% |
|
2013 |
-3% |
2007 |
1% |
|
1987 |
-3% |
2002 |
1% |
|
1999 |
-1% |
1999 |
1% |
|
2018 |
0% |
1996 |
1% |
| Source: Bloomberg Fixed Income Indices |
We believe the Fed’s tightening cycle is in the later innings, possibly near the seventh-inning stretch in baseball parlance. Timing is always uncertain, and there could still be some price declines ahead. But despite of the uncertainty as well as unsatisfactory year-to-date performance, we are increasingly encouraged by the forward return prospects of the Fund’s new and existing investments.
Following are additional details regarding the breakdown of our holdings. Our investments are broad, and they are all backed by a consistent philosophy: we strive to own only those investments we believe compensate us for the incremental credit risk. Our overall goal is to invest in a portfolio of bonds of varying maturities that we believe offer attractive risk-adjusted returns, taking into consideration the general level of interest rates and the credit quality of each investment.This material must be preceded or accompanied by a prospectusor summary prospectus.
|
Portfolio Allocation (% of Portfolio) |
||
|
Revenue |
59.5 |
|
|
Power |
14.5 |
|
|
Hospital |
9.7 |
|
|
Lease |
9.2 |
|
|
General |
6.7 |
|
|
Water/Sewer |
6.3 |
|
|
Certificates of Participation |
5.3 |
|
|
Airport/Transportation |
3.2 |
|
|
Housing |
2.6 |
|
|
Higher Education |
2.0 |
|
|
General Obligation |
25.7 |
|
|
School District |
13.2 |
|
|
County |
6.5 |
|
|
City/Subdivision |
5.3 |
|
|
State/Commonwealth |
0.7 |
|
|
Escrow/Pre-Refunded |
6.6 |
|
|
Cash Equivalent/Other |
8.2 |
|
CREDIT QUALITY (% of Portfolio) |
|
|
AAA |
6.2 |
|
AA |
61.5 |
|
A |
21.1 |
|
BBB |
0.9 |
|
BB |
0.0 |
|
B |
0.0 |
|
CCC |
0.0 |
|
Not Rated |
2.9 |
|
Cash Equivalents/Other |
7.3 |
|
RETURNS (%) |
||||||||||||
|
TOTAL RETURNS |
AVERAGE ANNUAL TOTAL RETURNS |
|||||||||||
|
QTR |
YTD |
1-YR |
3-YR |
5-YR |
10-YR |
20-YR |
30-YR |
35-YR |
Since Inception (10/1/1985) |
Net Expense | Gross Expense | |
|
WNTFX |
-2.94 |
-8.04 |
-7.66 |
-1.35 |
0.00 |
0.44 |
1.99 |
3.20 |
3.77 |
4.01 |
0.45 |
1.02 |
|
Bloomberg 5-Year Municipal Bond Index |
-2.71 |
-8.06 |
-8.03 |
-0.94 |
0.48 |
1.20 |
2.77 |
3.82 |
n/a |
n/a |
– |
– |
|
Data is for the quarter ending 09/30/2022. The opinions expressed are those of Weitz Investment Management and are not meant as investment advice or to predict or project the future performance of any investment product. The opinions are current through 10/20/2022, are subject to change at any time based on market and other current conditions, and no forecasts can be guaranteed. This commentary is being provided as a general source of information and is not intended as a recommendation to purchase, sell, or hold any specific security or to engage in any investment strategy. Investment decisions should always be made based on an investor’s specific objectives, financial needs, risk tolerance and time horizon. Data quoted is past performance and current performance may be lower or higher. Past performance is no guarantee of future results. Investment return and principal value of an investment will fluctuate, and shares, when redeemed, may be worth more or less than their original cost. Please visit weitzinvestments.com for the most recent month-end performance. Investment results reflect applicable fees and expenses and assume all distributions are reinvested but do not reflect the deduction of taxes an investor would pay on distributions or share redemptions. Net and Gross Expense Ratios are as of the Fund’s most recent prospectus. Certain Funds have entered into fee waiver and/or expense reimbursement arrangements with the Investment Advisor. In these cases, the Advisor has contractually agreed to waive a portion of the Advisor’s fee and reimburse certain expenses (excluding taxes, interest, brokerage costs, acquired fund fees and expenses and extraordinary expenses) to limit the total annual fund operating expenses of the Class’s average daily net assets through 07/31/2023. The Gross Expense Ratio reflects the total annual operating expenses of the fund before any fee waivers or reimbursements. The Net Expense Ratio reflects the total annual operating expenses of the Fund after taking into account any such fee waiver and/or expense reimbursement. The net expense ratio represents what investors are ultimately charged to be invested in a mutual fund. On 12/29/2006, the Nebraska Tax-Free Income Fund succeeded to substantially all of the assets of Weitz Income Partners Limited Partnership. The investment objectives, policies and restrictions of the Fund is materially equivalent to those of the Partnership, and the Partnership was managed at all times with full investment authority by the Investment Adviser. The performance information includes performance for the Partnership. The Partnership was not registered under the Investment Company Act of 1940 and, therefore, were not subject to certain investment or other restrictions or requirements imposed by the 1940 Act or the Internal Revenue Code. If the Partnership had been registered under the 1940 Act, the Partnership’s performance might have been adversely affected. Index performance is hypothetical and is shown for illustrative purposes only. You cannot invest directly in an index. The Bloomberg 5-Year Municipal Bond index is a capitalization weighted bond index generally representative of major municipal bonds of all quality ratings with an average maturity of approximately five years. Holdings are subject to change and may not be representative of the Fund’s current or future investments. Income from municipal securities is generally free from federal taxes and state taxes for residents of the issuing state. While the interest income is tax-free, capital gains, if any, will be subject to taxes. Income for some investors may be subject to the federal Alternative Minimum Tax (AMT) Credit ratings are assigned to underlying securities utilizing ratings from a Nationally Recognized Statistical Rating Organization (NRSRO) such as Moody’s and Fitch, or other rating agencies and applying the following hierarchy: security is determined to be Investment Grade if it has been rated at least BBB- by one credit rating agency; once determined to be Investment Grade (BBB- and above) or Non-Investment Grade (BB+ and below) where multiple ratings are available, the lowest rating is assigned. Mortgagerelated securities issued and guaranteed by government-sponsored agencies such as Fannie Mae and Freddie Mac are generally not rated by rating agencies. Securities that are not rated do not necessarily indicate low quality. Ratings are shown in the Fitch scale (e.g., AAA). Ratings and portfolio credit quality may change over time. The Fund itself has not been rated by a credit rating agency. Definitions: Average effective duration provides a measure of a fund’s interest-rate sensitivity. The longer a fund’s duration, the more sensitive the fund is to shifts in interest rates. Average effective maturity is the weighted average of the maturities of a fund’s underlying bonds. Yield to worst (YTW) is the lowest potential yield that can be received on a bond portfolio without the underlying issuers defaulting. Consider these risks before investing: All investments involve risks, including possible loss of principal. These risks include market risks, such as political, regulatory, economic, social and health risks (including the risks presented by the spread of infectious diseases). In addition, because the Fund may have a more concentrated portfolio than certain other mutual funds, the performance of each holding in the Fund has a greater impact upon the overall portfolio, which increases risk. See the Fund’s prospectus for a further discussion of risks related to the Fund. Investors should consider carefully the investment objectives, risks, and charges and expenses of a fund before investing. This and other important information is contained in the prospectus and summary prospectus, which may be obtained at weitzinvestments.com or from a financial advisor. Please read the prospectus carefully before investing. Weitz Securities, Inc. is the distributor of the Weitz Funds. |
Editor’s Note: The summary bullets for this article were chosen by Seeking Alpha editors.
Be the first to comment