

Thinkhubstudio/iStock via Getty Images
The Core Plus Income Fund’s Institutional Class returned -2.86% for the third quarter compared to a -4.75% return for the Bloomberg U.S. Aggregate Bond Index (AGG). Year to date, the Fund’s Institutional Class returned -11.11% compared to -14.61% for the index. Negative absolute results are never pleasant to report despite solid relative results. Longer-term results (3-, 5-, and 7year) continue to far outpace the index.
As has been the theme throughout the year, inflationary pressures remain stiff and showed no signs of abating in the third quarter. These pressures precipitated a large upward move in interest rates as the Federal Reserve announced its third consecutive 0.75% interest rate hike. Investor sentiment shifted again, at least momentarily, from concerns about recession back to inflation.
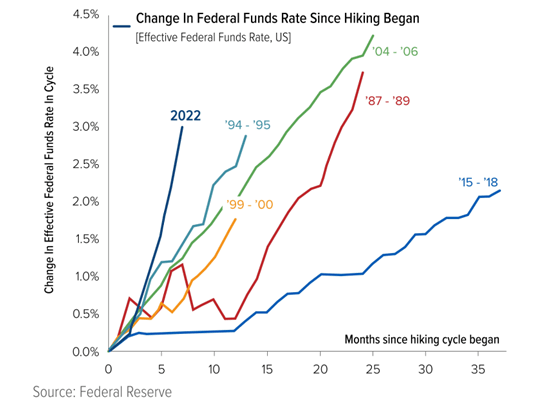
The chart below shows the unprecedented pace at which the Federal Open Markets Committee (FOMC) is raising rates to get current high inflation under control. No other rate hiking cycle has begun this steeply since the 1980s (when the Fed started targeting the federal funds rate as its primary tool for conducting monetary policy). And the Fed’s newfound fondness for hiking rates appears set to continue well into 2023 with some economists predicting the benchmark federal funds rate to hit as high as 5% sometime next year.
The repricing of interest rates and credit spreads, while unpleasant, sets the stage for more favorable forward returns. This can be seen in the Fund’s improved yield-to-worst (YTW) metric, as illustrated in the table below. As a reminder, YTW has historically been a reasonable predictor of forward returns.
On a year-over-year basis, the Fund’s YTW increased from 1.8% to 6.1% — far exceeding the Agg’s YTW of 4.8% as of September 30, 2022. This is the widest (positive) gap in YTW for the Fund versus the index since September 2020. The positive variance compared to the index is partially attributable to the Fund’s approximately 23% weight in floating-rate securities compared to no exposure in the Agg. The YTW for our floating-rate securities incorporates the market’s current expectations for higher short-term interest over the course of the next six to nine months.
|
Yield to Worst / Duration Analysis |
||||
|
9/30/2021 |
9/30/2022 |
Change |
% Change |
|
|
Yield to Worst (%) |
||||
|
Core Plus Income Fund |
1.80 |
6.09 |
4.29 |
238% |
|
U.S. Agg Index |
1.56 |
4.75 |
3.19 |
205% |
|
Average Duration (yrs) |
||||
|
Core Plus Income Fund |
4.8 |
5.2 |
0.38 |
8% |
|
U.S. Agg Index |
6.6 |
6.1 |
(0.48) |
-7% |
In terms of overall portfolio metrics, the Fund’s average effective maturity increased to 8.3 years as of September 30, 2022, from 8.0 years as of June 30, 2022, and the average effective duration remained steady at 5.2 years over the same time period.
These measures provide a guide to the Fund’s interest rate sensitivity. A higher average effective maturity and longer average effective duration increase the Fund’s price sensitivity to changes in interest rates (either up or down). As of September 30, 2022, the average effective duration of the Agg was 6.1 years.
As of September 30, our high-yield exposure as a percent of net assets was 11.1%, down from 12.1% on June 30, 2022. We had commented favorably on high yield valuations in the second-quarter Fund commentary — but a significant rally at the outset of the third quarter reduced favorable investment opportunities. Weakness in credit markets broadly near / at the end of the third quarter has increased the relative attractiveness of certain high yield credits.
Given the Fund can invest up to 25% of net assets in high yield, we are well positioned to take advantage of any further valuation discrepancies / opportunities in the high yield area. Our approach, however, will most likely be focused in what might be termed “higher-quality high yield”. That is, those companies that we believe have strong businesses and balance sheets and can weather an economic disturbance caused by a possible recession.
|
SECTOR ALLOCATION (% of net assets) |
|||||
|
9/30/2022 |
6/30/2022 |
Qtr Over Qtr Change |
9/30/2021 |
Yr Over Yr Change |
|
|
Corporate Bonds |
21.5 |
22.2 |
-0.7 |
33.0 |
-11.5 |
|
Corporate Convertible Bonds |
0.5 |
0.5 |
0.0 |
0.7 |
-0.2 |
|
Asset-Backed Securities (ABS) |
29.4 |
24.0 |
+5.4 |
18.1 |
+11.3 |
|
Corporate Collateralized Loan Obligations (CLOs)* |
12.5 |
10.7 |
+1.8 |
8.1 |
+4.4 |
|
Commercial Mortgage-Backed Securities (CMBS) |
10.3 |
10.6 |
-0.3 |
9.1 |
+1.2 |
|
Agency Mortgage-Backed (MBS) |
1.1 |
1.1 |
0.0 |
1.8 |
-0.7 |
|
Non-Agency Mortgage Backed (RMBS) |
0.4 |
0.5 |
-0.1 |
0.9 |
-0.5 |
|
Non-Convertible Preferred Stock |
0.4 |
0.5 |
-0.1 |
0.7 |
-0.3 |
|
Municipal Bonds |
0.3 |
0.6 |
-0.3 |
0.9 |
-0.6 |
|
U.S. Treasury |
34.5 |
37.5 |
-3.0 |
30.8 |
+3.7 |
|
Common Stock |
0.0 |
0.0 |
0.0 |
0.0 |
0.0 |
|
Cash & Equivalents |
1.6 |
2.5 |
-0.9 |
3.9 |
-2.3 |
|
TOTAL |
100 |
100 |
99.9 |
||
|
High Yield** |
11.1 |
12.1 |
-1.0 |
11.3 |
-0.2 |
|
Average Effective Duration |
5.2 |
5.2 |
0.0 |
4.8 |
+0.4 |
|
Average Effective Maturity |
8.3 |
8.0 |
+0.3 |
6.5 |
+1.8 |
| *Corporate CLOs are included in the ABS segment in the Fund’s schedule of investments but are additionally called out separately for the purposes of the discussion. **For the current period, high yield exposure consists of investments in the Corporate, Corporate Convertible, ABS, and CMBS sectors. |
In terms of sector allocation, we continued to increase our asset-backed securities (ABS) exposure. Credit spreads in ABS have widened materially, which we believe has greatly improved their relative value compared to investment-grade corporate bonds. We added a variety of automobile and unsecured consumer loan investments that we believe offer strong investor protections and attractive coupon income. We also added to our corporate CLO portfolio, including both static and reinvesting deals.
Top Quarterly Contributors
- Collateralized Loan Obligations (CLOs). Our portfolio of floating rate commercial real estate and corporate CLOs provided very modest positive contribution to the Fund during the third quarter. The floating rates protected against interest rate sensitivity and coupon incomes more than offset spread widening.
Top Quarterly Detractors
- U.S. Treasury Bonds: U.S. Treasury holdings were the largest detractor to performance for the third quarter in a row. With an effective maturity of over 13 years, our Treasury portfolio was negatively impacted by rising interest rates across the curve.
- Corporate Bonds: Investments in a wide variety of corporate bonds, including high yield, were the second largest detractor to performance in the quarter. High yield and longer maturity segments of our corporate bond portfolio underperformed the most.
- ABS: Our ABS detracted from performance due to rising interest rates and widening credit spreads.
Outlook
While it is particularly unpleasant to report on this year’s Fund performance, we continue to be pleased with the underlying fundamentals (credit quality) of our investments. This solid year-to-date credit quality has been recognized by rating agencies with meaningfully more upgrades to our portfolio’s credit ratings than downgrades (more than 20-to-1). Additionally, prepayments have allowed for reinvestment at meaningfully higher returns, helping to enhance our YTW of 6.1% at quarter-end.
Yogi Berra — the famous baseball player well-known for his many Yogi-isms — is credited with saying “it’s tough to make predictions, especially about the future.” Good advice, especially in credit and equity markets. Our role as money managers, per one of the founders of Gavekal Research, is to ‹adapt’ to market environments and not forecast. Widespread
worry/concerns/fears/confusion about the macro environment (further inflation, stagflation, possible recession, consumer spending slowdown, etc., etc.) often present opportunities for the fundamental investor. As a result, we are finding the best risk adjusted return opportunities for the Weitz Core Plus Income Fund since the COVID pandemic, and we believe the Fund is well positioned, as described above, to take advantage of today’s opportunities and any further valuation disparities that may develop. While there could still be some price declines ahead, as timing is always uncertain, we see greener pastures from today’s levels.
|
RETURNS (%) |
TOTAL RETURNS |
AVERAGE ANNUAL TOTAL RETURNS |
|||||||
|
QTR |
YTD |
1-YR |
3-YR |
5-YR |
7-YR |
Since Inception (7/31/2014) |
Net Expense |
Gross Expense |
|
|
WCPBX Institutional Class |
-2.86 |
-11.11 |
-11.10 |
-0.07 |
1.79 |
2.48 |
2.49 |
0.40 |
0.62 |
|
WCPNX Investor Class |
-2.78 |
-11.17 |
-11.10 |
-0.17 |
1.66 |
2.32 |
2.33 |
0.50 |
0.89 |
|
Bloomberg U.S. Agg Bond Index |
-4.75 |
-14.61 |
-14.60 |
-3.25 |
-0.27 |
0.54 |
0.87 |
– |
– |
|
This material must be preceded or accompanied by a prospectus or summary prospectus. Data is for the quarter ending 09/30/2022. The opinions expressed are those of Weitz Investment Management and are not meant as investment advice or to predict or project the future performance of any investment product. The opinions are current through 10/20/2022, are subject to change at any time based on market and other current conditions, and no forecasts can be guaranteed. This commentary is being provided as a general source of information and is not intended as a recommendation to purchase, sell, or hold any specific security or to engage in any investment strategy. Investment decisions should always be made based on an investor’s specific objectives, financial needs, risk tolerance and time horizon. Data quoted is past performance and current performance may be lower or higher. Past performance is no guarantee of future results. Investment return and principal value of an investment will fluctuate, and shares, when redeemed, may be worth more or less than their original cost. Please visit weitzinvestments.com for the most recent month-end performance. Investment results reflect applicable fees and expenses and assume all distributions are reinvested but do not reflect the deduction of taxes an investor would pay on distributions or share redemptions. Net and Gross Expense Ratios are as of the Fund’s most recent prospectus. Certain Funds have entered into fee waiver and/or expense reimbursement arrangements with the Investment Advisor. In these cases, the Advisor has contractually agreed to waive a portion of the Advisor’s fee and reimburse certain expenses (excluding taxes, interest, brokerage costs, acquired fund fees and expenses and extraordinary expenses) to limit the total annual fund operating expenses of the Class’s average daily net assets through 07/31/2023. The Gross Expense Ratio reflects the total annual operating expenses of the fund before any fee waivers or reimbursements. The Net Expense Ratio reflects the total annual operating expenses of the Fund after taking into account any such fee waiver and/or expense reimbursement. The net expense ratio represents what investors are ultimately charged to be invested in a mutual fund. Index performance is hypothetical and is shown for illustrative purposes only. You cannot invest directly in an index. The Bloomberg U.S. Aggregate Bond index is a broad-based benchmark that measures the investment grade, U.S. dollar-denominated, fixed-rate taxable bond market. Holdings are subject to change and may not be representative of the Fund’s current or future investments. Credit ratings are assigned to underlying securities utilizing ratings from a Nationally Recognized Statistical Rating Organization (NRSRO) such as Moody’s and Fitch, or other rating agencies and applying the following hierarchy: security is determined to be Investment Grade if it has been rated at least BBB- by one credit rating agency; once determined to be Investment Grade (BBB- and above) or Non-Investment Grade (BB+ and below) where multiple ratings are available, the lowest rating is assigned. Mortgage-related securities issued and guaranteed by governmentsponsored agencies such as Fannie Mae and Freddie Mac are generally not rated by rating agencies. Securities that are not rated do not necessarily indicate low quality. Ratings are shown in the Fitch scale (e.g., AAA). Ratings and portfolio credit quality may change over time. The Fund itself has not been rated by a credit rating agency. Definitions: Average effective duration provides a measure of a fund’s interest-rate sensitivity. The longer a fund’s duration, the more sensitive the fund is to shifts in interest rates. Average effective maturity is the weighted average of the maturities of a fund’s underlying bonds. CRE CLOs refer to commercial real estate collateralized loan obligations backed by a pool of commercial loans. Investment Grade Bonds are those securities rated at least BBB- by one or more credit ratings agencies. Middle market CLOs refer to collateralized loan obligations backed by loans made to smaller companies, which companies generally have earnings before interest, taxes, and amortization of less than $75 million. Non-Investment Grade Bonds are those securities (commonly referred to as “high yield” or “junk” bonds) rated BB+ and below by one or more credit ratings agencies. Yield to worst (YTW) is the lowest potential yield that can be received on a bond portfolio without the underlying issuers defaulting. Consider these risks before investing: All investments involve risks, including possible loss of principal. Market risk includes political, regulatory, economic, social and health risks (including the risks presented by the spread of infectious diseases). Changing interest rates may have sudden and unpredictable effects in the markets and on the Fund’s investments. The Fund may purchase lower-rated and unrated fixed-income securities, which involve an increased possibility that the issuers of these may not be able to make payments of interest and principal. See the Fund’s prospectus for a further discussion of risks. Investors should consider carefully the investment objectives, risks, and charges and expenses of a fund before investing. This and other important information is contained in the prospectus and summary prospectus, which may be obtained at weitzinvestments.com or from a financial advisor. Please read the prospectus carefully before investing. Weitz Securities, Inc. is the distributor of the Weitz Funds. |
Editor’s Note: The summary bullets for this article were chosen by Seeking Alpha editors.
Be the first to comment