

JuSun
Purpose
I look at the high frequency weekly indicators because, while they can be very noisy, they provide a good nowcast of the economy, and will telegraph the maintenance or change in the economy well before monthly or quarterly data is available. They are also an excellent way to “mark your beliefs to market.” In general, I go in order of long leading indicators, then short leading indicators, then coincident indicators.
A Note on Methodology
Data is presented in a “just the facts, ma’am” format with a minimum of commentary so that bias is minimized.
Where relevant, I include 12-month highs and lows in the data in parentheses to the right. All data taken from St. Louis FRED unless otherwise linked.
A few items (e.g., Financial Conditions indexes, regional Fed indexes, stock prices, the yield curve) have their own metrics based on long-term studies of their behavior.
Where data is seasonally adjusted, generally it is scored positively if it is within the top 1/3 of that range, negative in the bottom 1/3, and neutral in between. Where it is not seasonally adjusted, and there are seasonal issues, waiting for the YoY change to change sign will lag the turning point. Thus I make use of a convention: data is scored neutral if it is less than 1/2 as positive/negative as at its 12-month extreme.
With long leading indicators, which by definition turn at least 12 months before a turning point in the economy as a whole, there is an additional rule: data is automatically negative if, during an expansion, it has not made a new peak in the past year, with the sole exception that it is scored neutral if it is moving in the right direction and is close to making a new high.
For all series where a graph is available, I have provided a link to where the relevant graph can be found.
Recap of monthly reports
October data started out with another positive employment report, but both the unemployment and underemployment rates ticked up. The ISM manufacturing index declined slightly, and is just barely positive, while the more leading new orders index increased, but remains slightly negative. The ISM non-manufacturing index also declined, but remains positive.
September factory orders were positive, as was construction spending, although the more leading residential construction spending was flat.
In the rear view mirror, Q3 unit labor costs increased sharply again, and productivity decreased.
Long leading indicators
Interest rates and credit spreads
Rates
- BAA corporate bond index 6.33%, up +0.03 w/w (1-yr range: 3.13-6.59)
- 10-year Treasury bonds 4.17%, up +0.17 w/w (1.08-4.22) (12 year high)
- Credit spread 2.16%, down -0.14 w/w (1.65-4.31)
(Graph at Moody’s Seasoned Baa Corporate Bond Yield | FRED | St. Louis Fed.)
Yield curve 4.17 – 4.12
- 10 year minus 2 year: -0.49%, up +0.08% w/w (-0.52 – 1.59)
- 10 year minus 3 month: +0.09%, up +0.14% w/w (-0.01 – 2.04)
- 2 year minus Fed funds: +0.83%, down -0.50% w/w
(Graph at 10-Year Treasury Constant Maturity Minus 2-Year Treasury Constant Maturity | FRED | St. Louis Fed.)
30-Year conventional mortgage rate (from Mortgage News Daily) (graph at link).
- 7.29%, up +0.25% w/w (2.75-7.38).
Corporate bonds are at the top of their 10 year range, so negative. Treasury bonds and mortgage rates are also at 10 year peaks, so their rating is also negative.
The spread between corporate bonds and Treasuries remains positive. The yield curve at the important 2 to 10 year level remains inverted, at one of the worst levels since 2000. The 3 month-10 year spread, which inverted last week, reverted to normal this week. Still, only the very short end of the curve between the Fed Funds rate and 1 year Treasury has not truly inverted.
Housing
Mortgage applications (from the Mortgage Bankers Association)
- Purchase apps down -1% w/w to 158 (158-349) (SA) (new 8 year low)
- Purchase apps 4 wk avg. down -8 to 168 (SA) (341 high Jan 29, low 168 this week)
- Purchase apps YoY -41% (NSA)
- Purchase apps YoY 4 wk avg. -40% (NSA)
- Refi apps down -0.2% w/w (SA)
- Refi apps YoY down -85% (SA) (lowest since 2000)
*(SA) = seasonally adjusted, (NSA) = not seasonally adjusted
(Graph at Yardeni.com)
Real Estate Loans (from the FRB)
- Up +0.2% w/w
- Up +9.8% YoY (-0.9 – 9.8)
(Graph at Real Estate Loans, All Commercial Banks | FRED | St. Louis Fed )
The highest mortgage rates in 12 years have killed both purchase and refinance mortgage applications, the four-week averages of which continue at or close to 8 and 20 year lows, respectively. We have seen this feed into all of the monthly housing sales and construction reports, and in the past several months, into prices – although notably, housing under construction has not.
From 2018 until late in 2020 real estate loans with few brief exceptions stayed positive. Earlier last year they varied between neutral and negative, but for the past several months have been very positive. This is being helped by inflation in house prices; thus the turn in the indicator will be when that cools.
Money supply
The Federal Reserve has discontinued this weekly series. Data is now only released monthly. September data was released 1 week ago:
- M1 m/m down -0.9%, YoY Real M1 down -6.2% (20 year low)
- M2 m/m down -0.6%, YoY Real M2 down -5.7% (40 year low)
No recession has happened without a YoY real M1 negative, or YoY real M2 below +2.5%. Real M2 fell below that threshold in March. Real M1 also turned negative as of May.
Corporate profits (Q2 actual and Q3 actual + estimated S&P 500 earnings from I/B/E/S via FactSet at p. 30).
- Q3 85% actual +15% estimated up +0.95 to 55.59, down -2.3% q/q
FactSet estimates earnings, which are replaced by actual earnings as they are reported, and are updated weekly. The “neutral” band is +/-3%. I also average the previous two quarters together, until at least 100 companies have actually reported. For Q3, earnings, which had been negative, have now improved into the neutral range.
Credit conditions (from the Chicago Fed) (graph at link)
- Financial Conditions Index up +.01 (less loose) to -0.10 (-0.09 – -0.72)
- Adjusted Index (removing background economic conditions) down -0.01 (looser ) to -0.04 (+0.19 – -0.75)
- Leverage subindex unchanged (tight) at +0.23 (+0.81 – -0.39)
In these indexes, lower = better for the economy. The Chicago Fed’s Adjusted Index’s real break-even point is roughly -0.25. In the leverage index, a negative number is good, a positive poor. The historical breakeven point has been -0.5 for the unadjusted Index. Leverage is near its highest since the Great Recession, obviously very negative.
Short leading indicators
Economic Indicators from the late Jeff Miller’s “Weighing the Week Ahead”
- Miller Score (formerly “C-Score”): up +32 w/w to 319, +79 m/m (125 6/24/22 – 374 on 2/25/22)
- St. Louis Fed Financial Stress Index: up +0.1496 to -1.7057 (-2.1880 8/5/22 – -0.0609 12/3/21)
- BCIp from Georg Vrba: down -11.6 to 75.1 iM’s Business Cycle Index (100 is max value, below 25 is recession signal averaging 20 weeks ahead)
The Miller Score is designed to look 52 weeks ahead for whether or not a recession is possible. Any score over 500 means no recession. This number fell below that threshold at the beginning of August 2021, so not only is it negative, but we are now in the “recession eligible” time period.
Two weeks ago a reader requested a graph of the historical values of the Miller Score. Courtesy of Robert Dieli of the No Spin Forecast, the custodian of this metric, here it is:
Miller Score (Robert Dieli)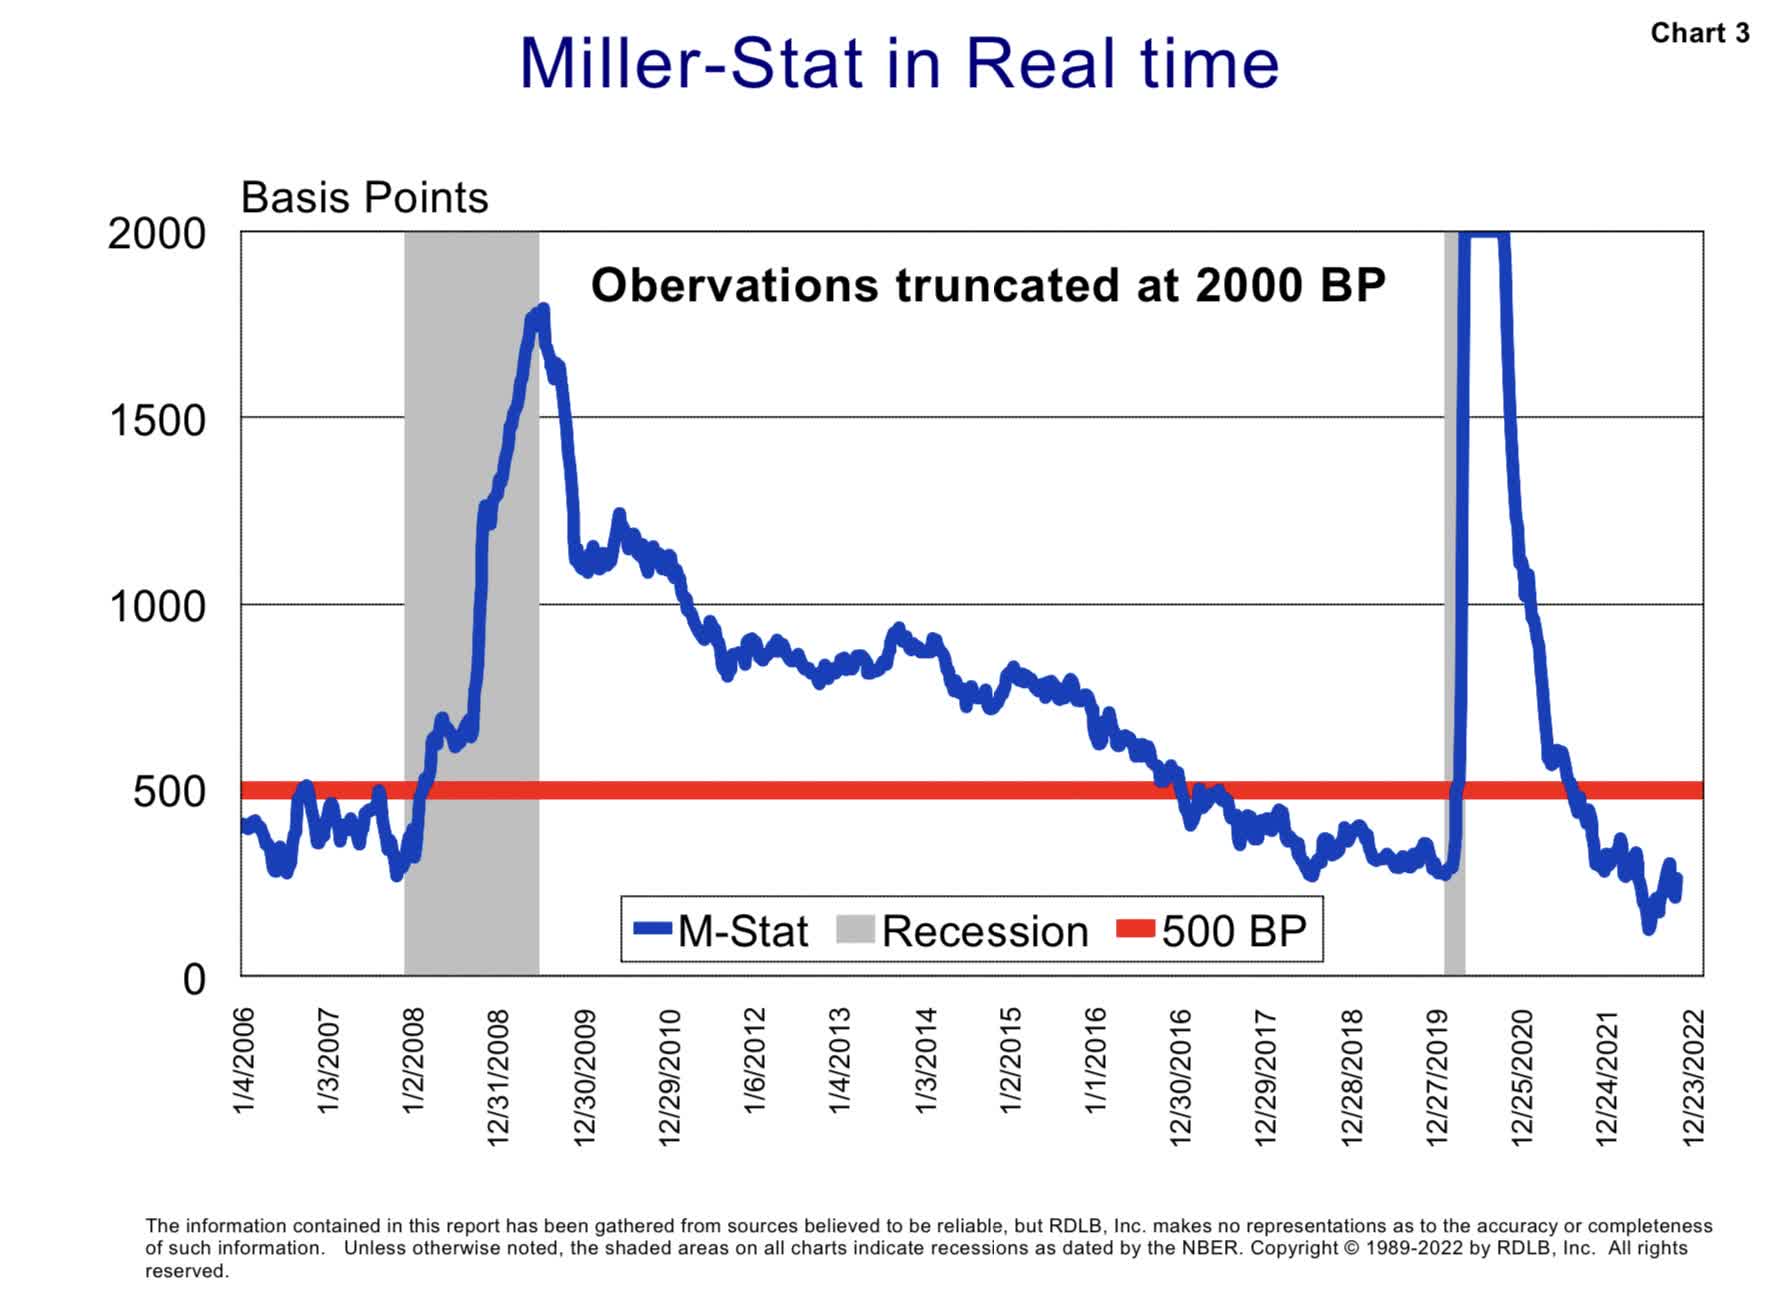
The St. Louis Financial Stress index is one where a negative score is a positive for the economy, and during its limited existence, has risen above zero before a recession by less than one year. Thus the present reading is also a strong positive for the economy.
Trade weighted US$
- Down -0.67 to 127.83 w/w, +12.6% YoY (last week) (broad) (113.63 – 128.58) (Graph at Nominal Broad U.S. Dollar Index)
- Down -1.15 to 110.68 w/w, up +17.6% YoY (major currencies) (graph at link) (93.28-114.78)
In early 2021, both the broad rating and the USD against major currencies turned higher YoY, and so changed to neutral. With both measures now well above +5% YoY, these ratings are negative.
Commodity prices
Bloomberg Commodity Index
- Up +6.22 to 117.49 (79.11-135.43)
- Up +14.4% YoY (Best: +52.3% June 4)
(Graph at BCOM | Bloomberg Commodity Index Overview | MarketWatch )
Bloomberg Industrial metals ETF (from Bloomberg) (graph at link)
- 153.40, up +8.92 w/w (131.43-230.32)
- Down -11.2% YoY (Best +69.0% May 7)
During the Boom last year, commodity prices soared, and total commodities were very positive. Total commodities (which include oil) remain in the middle 1/3rd of their range for the 2nd week, so are neutral again. The decline in industrial metals has put that indicator in the bottom 1/3rd of its 52 week range, so a negative.
Stock prices S&P 500 (from CNBC) (graph at link)
Since January 3 of this year, there have been ongoing new 3 month and even 1 year lows, and no 3 month highs until 11 weeks ago. Since in the past 3 months we have had both, this indicator is neutral.
Regional Fed New Orders Indexes
(*indicates report this week) (no reports this week)
- Empire State unchanged at +3.7
- Philly up +1.7 to -15.9
- Richmond down -11 to -22
- Kansas City down -7 to -16
- *Dallas down -2.4 to -8.8
- Month-over-month rolling average: down -1 to -13
The regional average is more volatile than the ISM manufacturing index, but usually correctly forecasts its month-over-month direction. These had usually been extremely positive ever since June 2020, but in the last several months have fallen, and precipitously so in the past three months. The indicator having fallen below -5, it turned negative.
Employment metrics
Initial jobless claims
- 217,000, down -1,000 w/w
- 4-week average 218,750, down -500 w/w
(Graph at St. Louis FRED)
New claims made new all-time lows on a 4 week average in April. Once this metric failed to make a new 3 month low, its rating changed to neutral. It will not turn negative unless and until the 4 week average is higher YoY. It declined for 6 weeks before reversing higher, and sideways for the last 3 weeks.
Temporary staffing index (from the American Staffing Association) (graph at link)
- Unchanged at 108 w/w
- Up +3.0% YoY (18 month low).
This gradually improved to neutral at the beginning of 2021, and has been positive since then. There is a great deal of seasonality in the numbers, which typically rise slowly throughout the year except for certain holiday periods. This index is still rising slowly for this year, but the comparisons are now much more weakly positive. If it falls below +3.0% YoY – it’s exact value this week – it will decline to neutral.
Tax Withholding (from the Dept. of the Treasury)
- $247.2 B for the month of October vs. $220.3 B last year, +$26.9 B or +12.2%
- $233.0 B for the last 20 reporting days this year vs. $223.1 B one year ago, +$9.9 B or +4.4%.
YoY comparisons turned positive in the beginning of 2021, and have remained that way almost every week since. The YoY% change fell below 5% several times in the past several months, making it a neutral, but then it once again rebounded. For three weeks it was negative YoY, but returned to neutral, then positive for a week, but is neutral again.
Oil prices and usage (from the E.I.A.)
- Oil up +$4.50 to $92.57 w/w, up +32.0% YoY ($62.32 – $123.70)
- Gas prices down -$.03 to $3.74 w/w, up $0.35 YoY
- Usage 4-week average down -8.3% YoY.
(Graphs at This Week In Petroleum Gasoline Section – U.S. Energy Information Administration (EIA))
Gas prices are in the middle 1/3rd of their 3-year range, and so have returned to neutral. Oil has also rebounded in the past several weeks, but is in the middle of its 3-year range, and so it remains neutral.
Mileage driven had improved, but has faded again.
Note: With gas and oil prices so volatile in the past 12 months, I believe the best measure is against their 3-year average. Measuring by 1 year, both are also neutral.
Bank lending rates
- 0.507 TED spread up +0.022 w/w (0.02 -.685)
- 3.85 LIBOR up +0.10 w/w (0.0753- 3.750) (graph at link) (new multi-year high).
TED was above 0.50 before both the 2001 and 2008 recessions. Since early 2019 the TED spread had remained positive, except the worst of the coronavirus downturn, until earlier this spring. It has been very choppy recently, varying between neutral and negative. This week it was negative again.
LIBOR has been increasing consistently well into its negative range.
Coincident indicators
St. Louis FRED Weekly Economic Index
- Up +0.06 to +2.23 w/w (+1.74 10/21/22 – +6.47 10/16/21).
In the 5 years before the onset of the pandemic, this Index varied between +.67 and roughly +3.00. Just after the Great Recession, its best comparison was +4.63. After a very positive 2021, it declined to less than half its best YoY level, thus changing to neutral.
Restaurant reservations YoY (from Open Table)
- October 28 seven day average +5% YoY (Best +31% Oct 21)
- November 4 seven day average -10% YoY (Worst -29% Jan 13).
The comparison year for this metric is 2019 and not 2021. This year the metric gradually improved to neutral, and for one week, positive. But it has since changed back to neutral, and this week negative again.
Note I am now measuring its 7-day average to avoid daily whipsaws.
Consumer spending
- Johnson Redbook up +9.7% YoY (high 21.4% on Dec 28, 2021; low 8.0% Oct 21) United States Redbook Index – 2022 Data – 2005-2021 Historical – 2023 Forecast
In April 2020 the bottom fell out in the Redbook index. It has remained positive almost without exception since the beginning of 2021. The past two weeks have been the lowest YoY comparison in many months; further, it is over 50% below its high reading in the past year. The new link I have added above goes to a 5 year graph to best show the comparison.
Therefore, for the first time in several years, I have downgraded this metric to neutral. If it falls below 5%, I will downgrade it to negative.
Transport
Railroads (from the AAR)
- Carloads up +2.6% YoY
- Intermodal units down -0.7% YoY
- Total loads up +0.8% YoY (Best +34.0% April 23, 2021)
(Graph at Railfax Report – North American Rail Freight Traffic Carloading Report.)
Shipping transport
- Harpex down -18 to 1387 (1479 – 4586) (18-month low)
- Baltic Dry Index down -322 to 1290 (1002-5650) (graph at link).
Rail carloads turned positive early in 2021, before gradually fading to negative from August through the end of the year and the beginning of this year. The total loads index has been consistently negative for the past four months. In the past two months, comparisons have hovered near the zero line, varying between neutral and negative. This week they were neutral.
Harpex increased to near record highs again earlier this year, but has since backed off all the way to new lows. BDI has traced a similar trajectory, warranting a change to negative.
I am wary of reading too much into price indexes like this, since they are heavily influenced by supply (as in, a huge overbuilding of ships in the last decade) as well as demand.
Steel production ( American Iron and Steel Institute)
- Down -0.4% w/w
- Down -9.4% YoY.
Since the end of March 2021, against terrible comparisons, this metric had been positive, typically running at a double digits higher YoY percentage growth. This spring, after almost continuous deterioration, it turned negative, and has remained so. This week so the poorest YoY reading yet.
Summary And Conclusion
Below are this week’s spreadsheets of the long leading, short leading, and coincident readings. Check marks indicate the present reading. If there has been a change this week, the prior reading is marked with an X:
| Long leading Indicators | Positive | Neutral | Negative | |
|---|---|---|---|---|
| Corporate bonds | ✓ | |||
| 10 year Treasury | ✓ | |||
| 10 yr-2 yr Treasury | ✓ | |||
| 10 yr-3mo Treasury | ✓ | X | ||
| ✓ | ||||
| Mortgage rates | ✓ | |||
| Purchase Mtg. Apps. | ✓ | |||
| Refi Mtg Apps. | ✓ | |||
| Real Estate Loans | ✓ | |||
| Real M1 | ✓ | |||
| Real M2 | ✓ | |||
| Corporate Profits | ✓ | x | ||
| Adj. Fin. Conditions Index | ✓ | |||
| Leverage Index | ✓ | |||
| Totals: | 2 | 2 | 10 | |
| Short Leading Indicators | Positive | Neutral | Negative | |
|---|---|---|---|---|
| Credit Spread | ✓ | |||
| Miller Score | ✓ | |||
| St. L. Fin. Stress Index | ✓ | |||
| US$ Broad | ✓ | |||
| US$ Major currencies | ✓ | |||
| Total commodities | ✓ | |||
| Industrial commodities | ✓ | |||
| Stock prices | ✓ | |||
| Regional Fed New Orders | ✓ | |||
| Initial jobless claims | ✓ | |||
| Temporary staffing | ✓ | |||
| Gas prices | ✓ | |||
| Oil prices | ✓ | |||
| Gas Usage | ✓ | |||
| Totals: | 3 | 5 | 6 | |
| Coincident Indicators | Positive | Neutral | Negative | |
|---|---|---|---|---|
| Weekly Econ. Index | ✓ | |||
| Open Table | X | ✓ | ||
| Redbook | ✓ | |||
| Rail | ✓ | X | ||
| Harpex | ✓ | |||
| BDI | ✓ | |||
| Steel | ✓ | |||
| Tax Withholding | ✓ | |||
| TED | X | ✓ | ||
| LIBOR | ✓ | |||
| Financial Cond. Index | ✓ | |||
| Totals: | 1 | 4 | 6 | |
All three timeframes of indicators remain negative. But this week, there was some improvement in several of them. I’m not reading too much in to this; just a contratend move.
I think it is more significant that consumer spending as measured by Redbook has not significantly recovered, and temporary staffing is on the very cusp of turning neutral. Any further weakening in spending and employment will put us on the very doorstep of recession.
With the Fed sounding even more hawkish than earlier this year, it appears that Powell is determined to follow in the footsteps of Paul Volcker. In the 1970s, Fed overtightening resulted in two 18 month severe recessions – and this is my template now. This is a shame, as YoY pressures in housing prices, wages, and gas prices, while strong in absolute terms, are all decelerating in response to tightening already in the system – which has not yet been fully absorbed. At this point, I believe the only question is not whether there will be a recession very soon – but just *how* soon.
Be the first to comment