

Justin Sullivan/Getty Images News
Thesis
The tech sector is currently suffering the worst correction in a decade, as you can see from the following chart. Using the Invesco QQQ Trust (QQQ) as a representation, the sector has suffered a correction of 35.1% off its recent peak, the worst correction in more than 10 years as seen. The last time that the sector suffered a larger correction needs to date back to the 2008 great recession. As such, we see now as a good time for long-term investors to start building a position in the tech sector after the sector has been in an overvaluation regime for a long bull-run. As to be elaborated on later, we see the sector now offers prospects for almost double-digit annual returns (say 8.5% or above) in the long term.
Source: Author based on Seeking Alpha data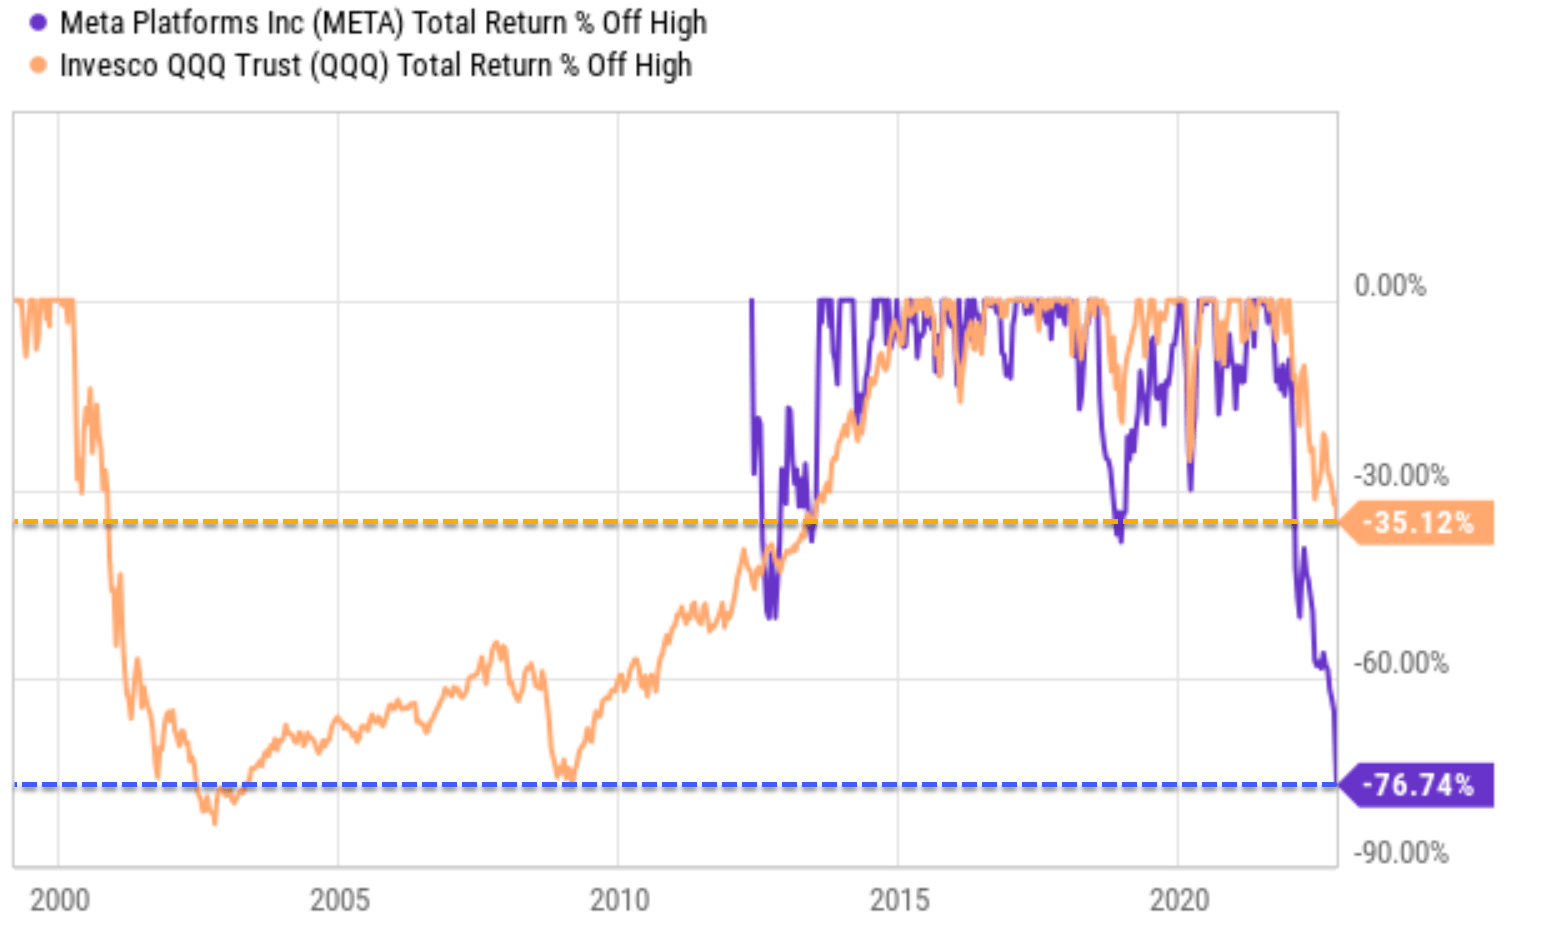
However, readers familiar with us know that our investment style looks for more concentrated bets. And we often use sector-level analysis only as a starting point to identify individual stocks. And this leads me to the main topic for today, Meta Platforms (NASDAQ:META). As seen, META has suffered a much larger loss of 76.7% off its recent peak (which, BTW, would take a 329% rally to break even – if it ever does). You can also see that such a correction is by far the worst one in its entire history, far larger than the second-worst one that occurred back in 2013.
And the thesis is that such correction has been severely overblown. The remainder of the article is to argue that META now represents a far better choice within the tech sector than the sector itself. Its valuation compression, combined with its leading position and growth potential, offers annual return potentials that are about 2x higher than the sector average (14%~17% vs ~8.5%).
Single-digit PE is unjustifiably cheap
META’s single-digit PE (~9x) is simply unjustifiably cheap considering its leading position in the social media space and superior profitability over the tech sector average.
As seen from the chart below, META is currently priced at 8.58x PE only. Admittedly, it just reported unfavorable results for the past quarter. It suffered a top-line decline in Q3 on a year-to-year basis. User growth continued to slow. It experienced weak advertising demand throughout the past few quarters. Management warned of near-term sales challenges in its Q3 earnings report and anticipated macroeconomic difficulties to persist. All told, it lowered guidance for the remainder of the year, and hence its FW PE is a bit higher at 9.9x.
But then we need to consider the cash position on its balance sheet. It ended the quarter with a Total Cash position of $41.7B and a Total Debt of only $26.5B, leading to a net cash position of more than $15.3B. Its PE is only 6.9x on a TTM basis after its cash position is adjusted and would be only about 9x on an FW basis.
Such single-digit PE is not only cheap when compared to its own entire history, but also when compared to other peers or the overall tech sector. Among the FAANG stocks, its valuation is about half of Google’s (GOOG) (GOOGL) and less than ½ than Apple’s (AAPL) or Netflix’s (NFLX).
It is up for debate whether META should trade at the same multiples as the rest of the FAANG stocks. But my view is that META should trade at least at comparable valuation multiples as the tech sector average. Yet, as seen, QQQ’s current PE ratio is about 21.89x, and the price/cash flow ratio is about 22.87x (both taken from Yahoo!), more than 2.4x higher than META.
And next, I will argue that META’s profitability and growth potential are stronger, not weaker, than the average stocks in the QQQ fund.
Source: Author based on Seeking Alpha data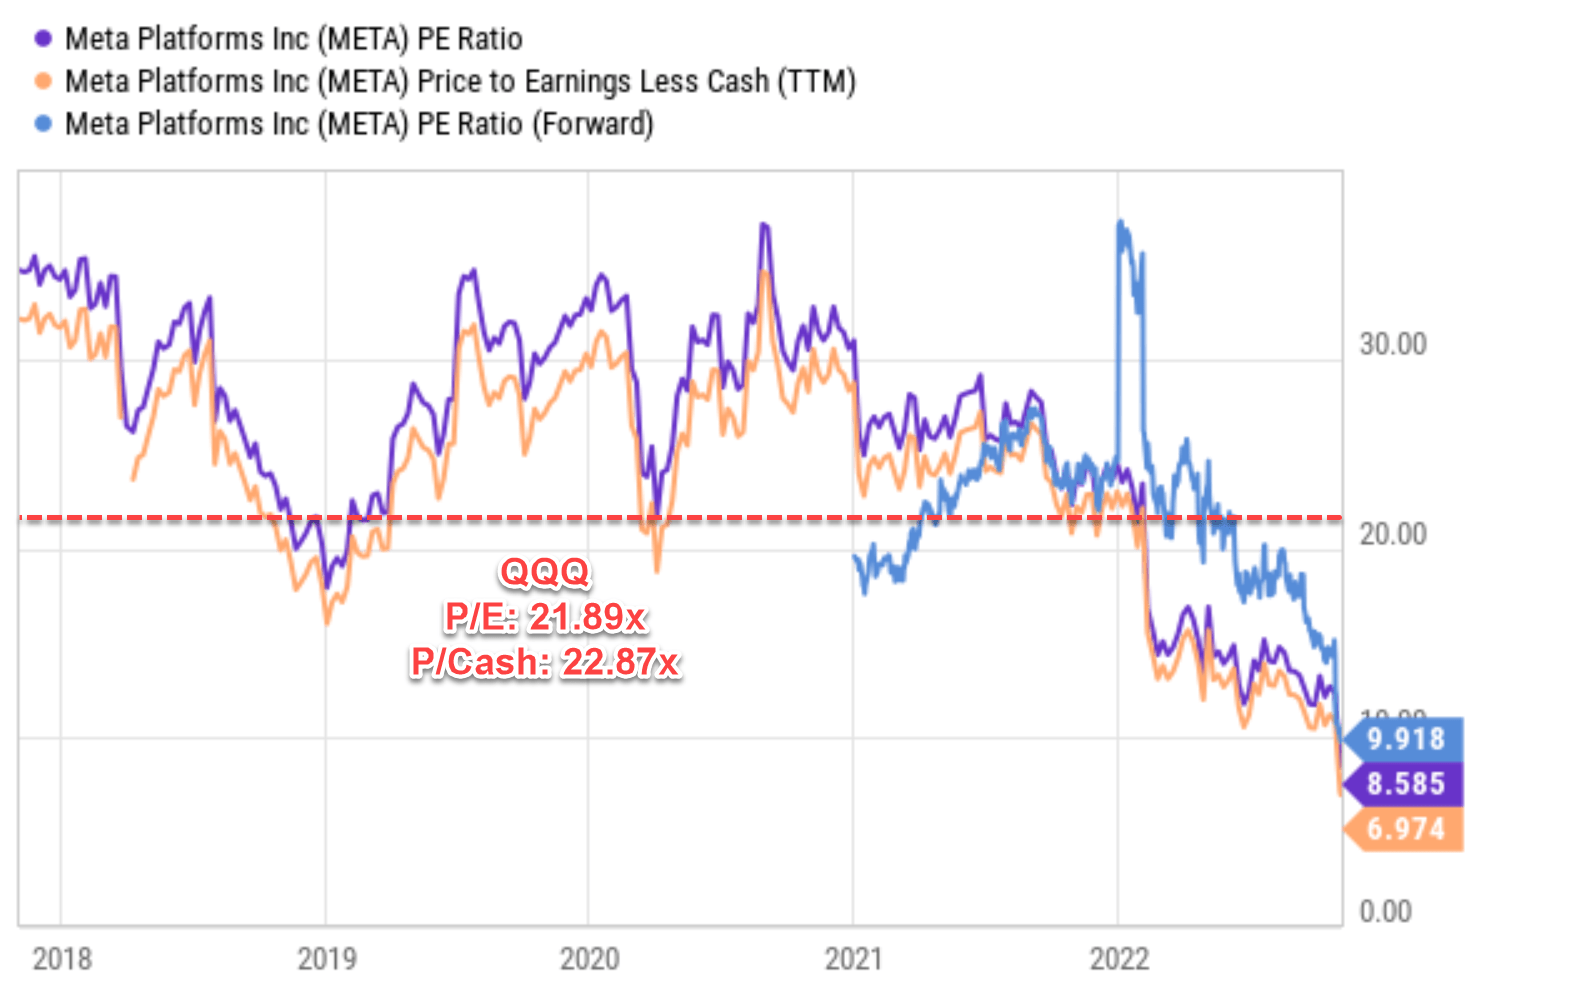
META’s profitability and growth potential contextualized
The following chart shows META’s profitability in terms of ROCE (return on capital employed). As seen, the ROCE of META is 43.5% on average in recent years, the 4th highest one in the FAAMG group. Its ROCE is lower than AAPL, MSFT, and GOOG by a good margin. Therefore, PART of its valuation discounts as aforementioned is justifiable. But the current discount is too simply too overblown. And also note that the ROCE of QQQ is about 40.2% (approximated by the fund’s ROE as detailed in my blog article), which is lower than META’s 43.5% by about 8% in relative terms. And next, you will see that such superior ROCE, combined with META’s leading positions and growth initiative, enables far better growth prospects than the average tech sector.
Source: Author based on Seeking Alpha data
As seen in the chart below, its current bread-and-butter business is its Web-Based Data and Services, which are contributing more than 98% of its total revenues. Looking ahead, I see META remains well positioned in the social media space and digital ad world. Its existing platforms are highly sticky. In addition to its existing revenue streams, I also expect mobile advertising to be an important driver of growth too.
Source: FactSet and ETF.com data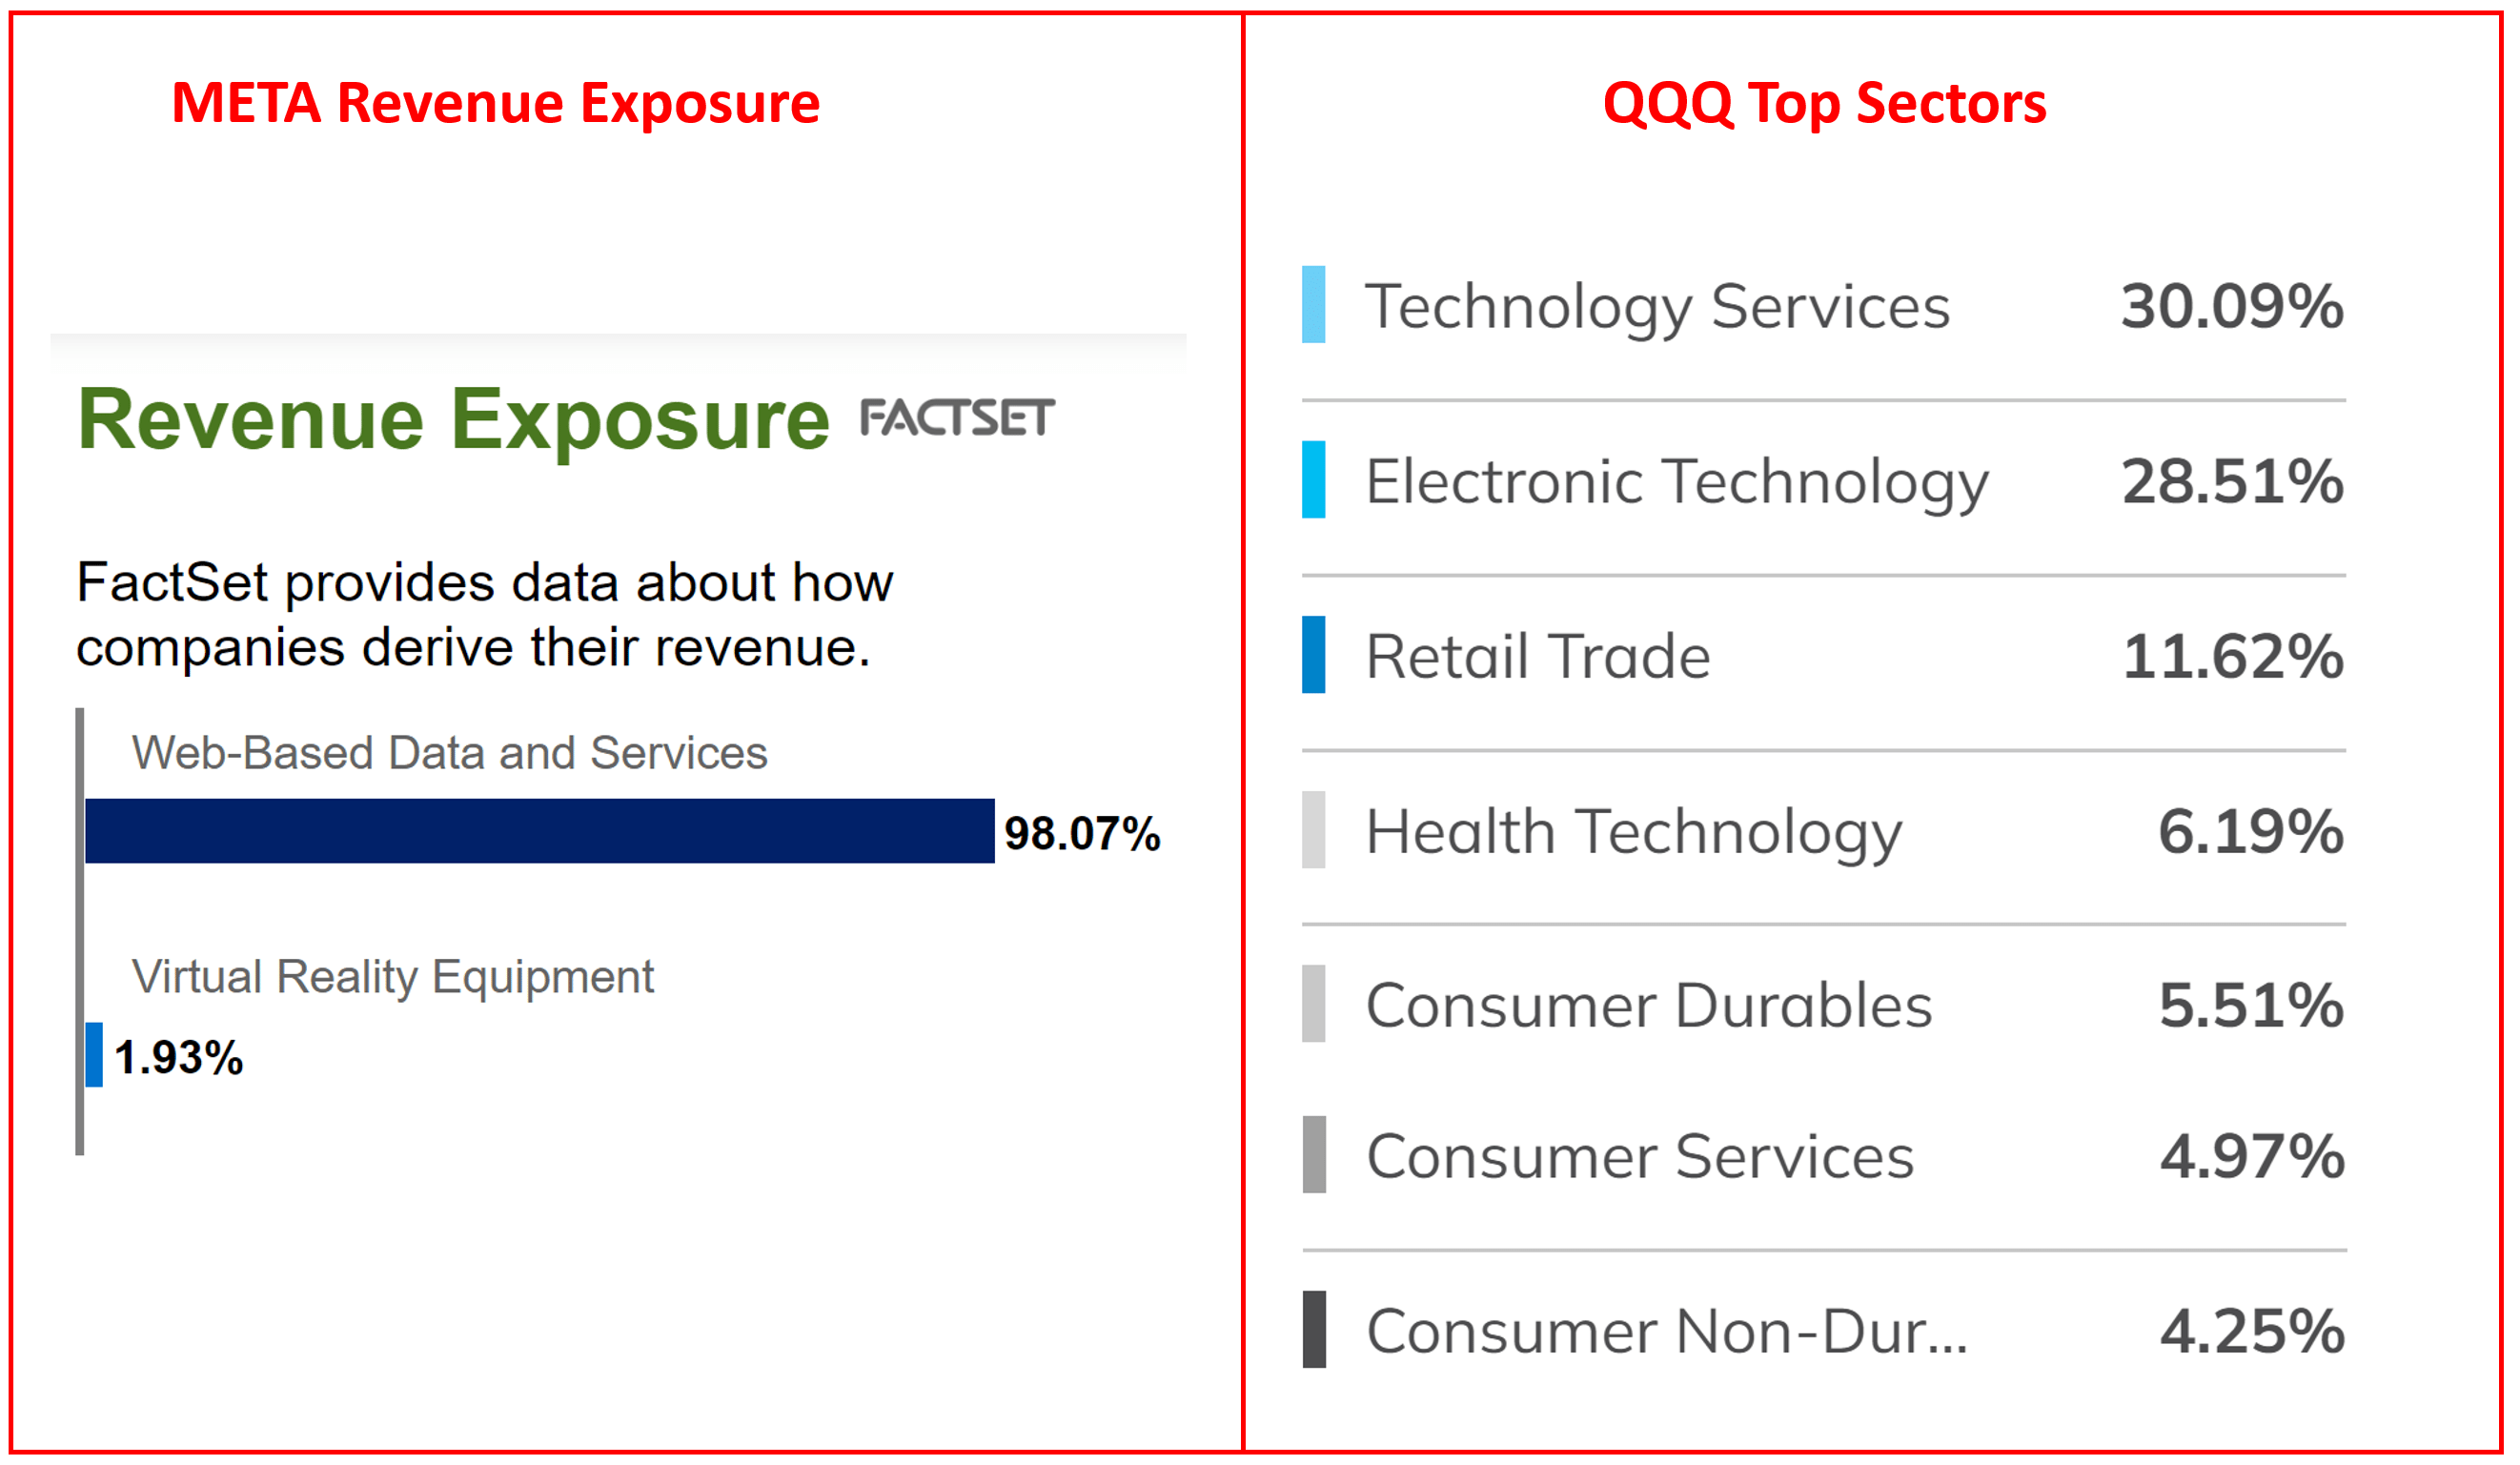
At the same time, it’s also betting heavily on the Virtual Reality (“VR”) space, which currently makes up only 1.93% of its current total sales. But the VR or metaverse potential is simply too big for investors to ignore. According to the following McKinsey report,
By 2030, the impact of the metaverse is projected to generate up to $5 trillion in value. To wit, the impact on the game market will be $108 billion to $125 billion, the impact on the advertising market will be $144 billion to $206 billion, and the impact on the virtual learning market is expected to be $180 billion to $270 billion. The bulk of the impact will come from the e-commerce sector may reach a scale between 2 trillion to 2.6 trillion US dollars.
In contrast, QQQ’s exposure is more diversified (which is not a bad thing by itself). QQQ’s technology exposure mostly comes from tech services (30.1%) and electronics (28.5%) with a combined weight of 58.6%. The remainder of its exposure is largely beside the tech sector and includes healthcare (6.29%), staples (5.5%), et al. Again, a more diversified exposure is not a negative at all in itself. But if our goal is to look for high-growth and high-margin areas, I see META at a far better spot given its current dominance in the digital ad space and its potential in the VR world.
Source: McKinsey report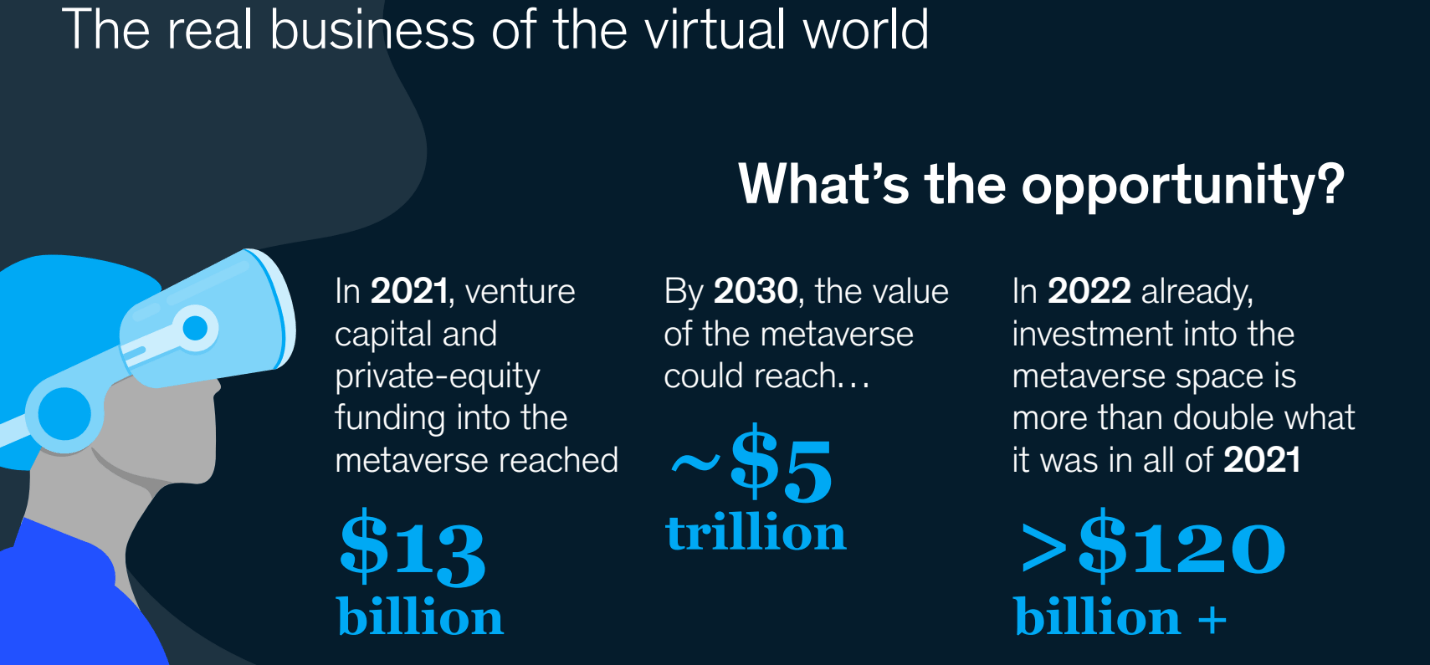
META’s projected return potential
The next chart shows my projected return for META. As you can see, META is projected to provide an annual return (“ROI”) in the range of 14% to about 17% depending on what PE you exactly assigned to it (somewhere between 8x to 10x). This projection also assumed a 10% reinvestment rate and an average ROCE in the range of 40% to 45%. In contrast, the average tech sector is projected to return about 8.5% at its current PE of 22x and a ROCE of 40%.
The method used to generate these projections have been detailed in our earlier article. In short,
- The long-term ROI for a business owner is simply the summation of two things: A) the price paid to buy the business and B) the long-term growth rate of the business. More specifically, part A is determined by the owner’s earning yield (“OEY”) when we purchased the business.
- Part B, the long-term growth rate, is governed by ROCE and the Reinvestment Rate. These are the two most important growth engines, and they mutually enhance each other.
- Longer-Term ROI = valuation + quality = OEY + Growth Rate = OEY + ROCE*Reinvestment Rate.
And specifically for META, its growth rate is projected to be about 4.35% assuming a conservative 10% reinvestment rate (43.5% ROCE * 10% reinvestment rate = 4.35%). And at its current price level, the OEY is somewhere between ~10% (based on a 10x PE) to 12.5% (based on an 8x PE). As a result, the total return is in the mid to upper teens, consisting of a balanced OEY and future growth. In contrast, QQQ’s lower ROI of 8.5% is caused both by its higher valuation of 22x (and thus an OEY of around 4.5%) and slightly lower growth rates due to its lower ROCE.
Source: Author based on Seeking Alpha data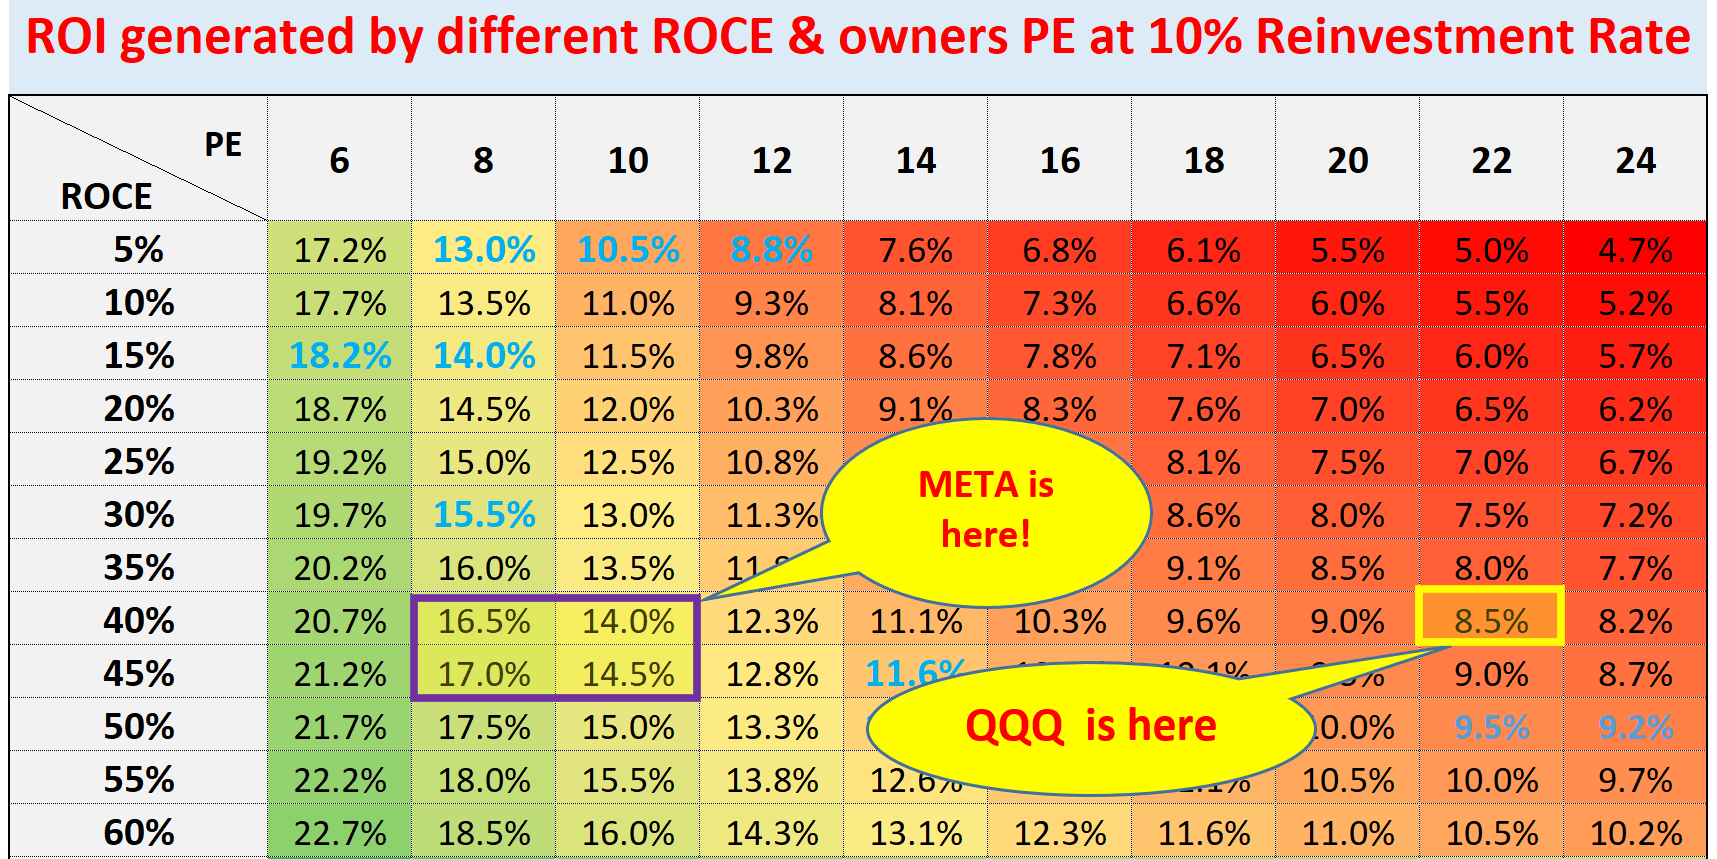
Risks and final thoughts
Finally, risks. As mentioned above, I anticipate near-term sales challenges and macroeconomic difficulties to persist. These difficulties include high inflation, geopolitical unrest in its target markets, and also strong currency headwinds created by the record strengthening of the dollar. Since these issues have already been covered by other Seeking Alpha articles reviewing its Q3 results, I won’t add on anymore. In particular, I anticipate weak advertising demand in the remainder of the year, resulting in a difficult operating climate for its core operating segments. I also feel that the revenue at its Reality Labs unit probably would decline on a sequential basis in the near future given the macroeconomic condition.
To conclude, the tech sector represented is suffering its worst correction in a decade. In my view, now is a good time for long-term investors to start building a position in the tech sector. The sector has been overvalued for years and now it offers solid return potential (about 8.5% per annum) in the long term. However, for investors looking for more concentrated bets on individual stocks, META is a strong candidate. Its single-digit PE (8x~9x) is simply unjustifiably cheap given its leading position in the digital ad space, its superior profitability, and also its growth potential. These shares are projected to deliver annual returns that are about 2x higher than the average tech sector (14%~17% vs ~8.5%) under current conditions.
Be the first to comment