

Weekly Fundamental US Stocks Forecast: Neutral
- Seasonality studies going back 20-years show August is generally positive, with the second half of the month producing the majority of gains during the month.
- US equity markets can continue to trade higher in the short-term – at least until the Federal Reserve’s Jackson Hole Economic Policy Symposium later this month.
- The IG Client Sentiment Index suggests thatUS stocks have a mixed bias in the near-term.
US Stocks Week in Review
It was another strong week for US equity markets, as decelerating price pressures, per the July US inflation report, eased concerns about the Federal Reserve continuing along its aggressive rate hike path. The US S&P 500 added +3.24%, the tech-heavy US Nasdaq 100 gained +2.64%, and the small-cap focused US Russell 2000 added an impressive +4.95%. The combined pullback in short-end US Treasury yields and volatility measures remain instrumental in the rebound transpiring across US equity markets – which has officially entered bull market territory (>+20% off the lows).
Seasonality Favors Gains in US Equity Markets
The first two weeks of August have clocked gains for US equity markets, in line with historical tendencies. Seasonality studies going back 20-years show August is generally positive, with the second half of the month producing the majority of gains during the month, per data gathered from EquityClock.com.
US S&P 500 Seasonality: DAILY TIMEFRAME (20-year average) (CHART 1)
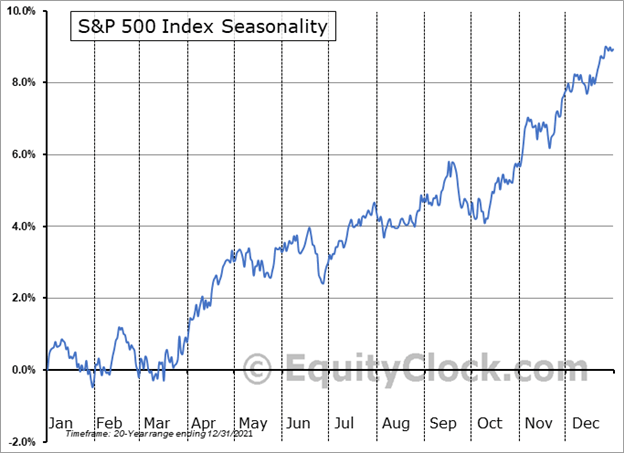
Source: EquityClock.com
US Nasdaq 100 Seasonality: DAILY TIMEFRAME (20-year average) (CHART 2)
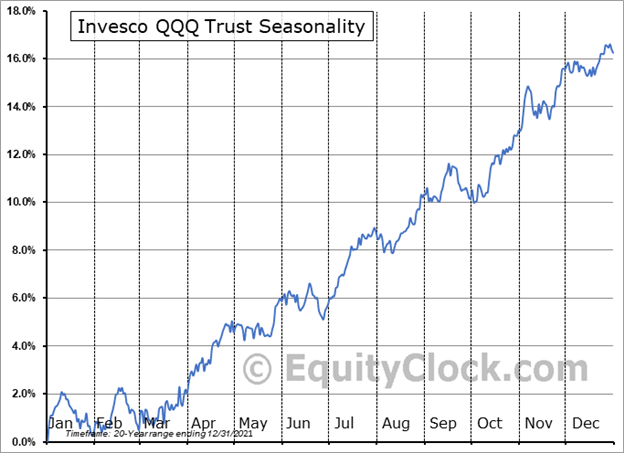
Source: EquityClock.com
US Russell 2000 Seasonality: DAILY TIMEFRAME (20-year average) (CHART 3)
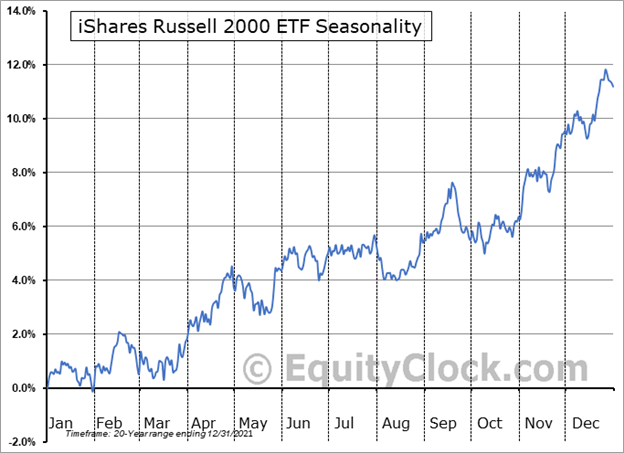
Source: EquityClock.com
With US real GDP tracking at +2.5% annualized in 3Q’22 per the Atlanta Fed GDPNow growth tracker, coupled with generally positive earnings (75% of S&P 500 companies have reported a positive EPS surprise and 70% have reported a positive revenue surprise, per FactSet), there is reason to believe that US equity markets can continue to trade higher in the short-term – at least until the Federal Reserve’s Jackson Hole Economic Policy Symposium later this month.
Economic Calendar Week Ahead
The turn through the middle of August promises a busy US economic calendar, if not in magnitude of significant data releases but in frequency of data and events. There are only two ‘high’ rated releases in the coming days, but the calendar sees a steady flow of information Monday through Thursday nevertheless.
– On Monday, August 15, the August US NAHB housing market index will be released 30 minutes after US cash equity markets open. June US net long-term TIC flows will be reported at 20 GMT.
– On Tuesday, August 16, July US building permits and housing starts will be published at 12:30 GMT. July US industrial production figures are due at 13:15 GMT.
– On Wednesday, August 17, weekly US mortgage applications data will be released at 11 GMT. The July US retail sales report will be reported at 12:30 GMT. June US business inventories are scheduled to come out at 14 GMT. The July FOMC minutes are due at 18 GMT. Fed Governor Bowman will give remarks at 13:30 GMT and 18:20 GMT.
– On Thursday, August 18, weekly US jobless claim will be released at 12:30 GMT, as will the August US Philadelphia Fed manufacturing index. July US existing home sales data and the July US Conference Board leading index are due at 14 GMT. Kansas City Fed President George will give a speech at 17:20 GMT.
US S&P 500 PRICE VERSUS COT NET NON-COMMERCIAL POSITIONING: DAILY TIMEFRAME (August 2020 to August 2022) (CHART 4)
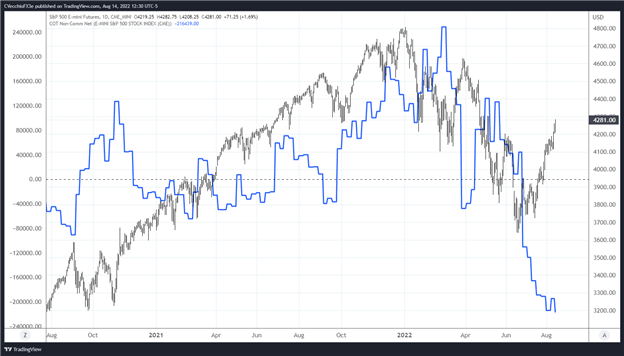
Next, a look at positioning in the futures market. According to the CFTC’s COT data, for the week ended August 9, speculators increased their net-short US S&P 500 futures positions to 216,439 contracts, up from the 194,685 net-short contracts held in the week prior. Positioning is the most net-short it has been over the past 52-weeks, and the most net-short since the third week of June 2020.
IG CLIENT SENTIMENT INDEX: US S&P 500 PRICE FORECAST (August 12, 2022) (CHART 5)
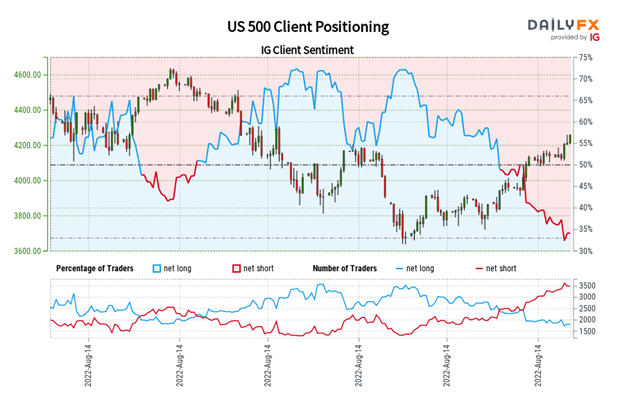
US 500: Retail trader data shows 35.34% of traders are net-long with the ratio of traders short to long at 1.83 to 1. The number of traders net-long is 1.02% higher than yesterday and 3.28% lower from last week, while the number of traders net-short is 0.73% higher than yesterday and 10.66% higher from last week.
We typically take a contrarian view to crowd sentiment, and the fact traders are net-short suggests US 500 prices may continue to rise.
Positioning is less net-short than yesterday but more net-short from last week. The combination of current sentiment and recent changes gives us a further mixed US 500 trading bias.
— Written by Christopher Vecchio, CFA, Senior Strategist
Be the first to comment