

ismagilov
Author’s note: This article was released to CEF/ETF Income Laboratory members on September 7th, 2022. Please check latest data before investing.
The Weekly Closed-End Fund Roundup will be put out at the start of each week to summarize recent price movements in closed-end fund [CEF] sectors in the last week, as well as to highlight recently concluded or upcoming corporate actions on CEFs, such as tender offers. Data is taken from the close of Friday, September 2nd, 2022.
Weekly performance roundup
0 out of 23 sectors were positive on price (down from 1 last week) and the average price return was -2.25% (up from -2.26% last week). The lead gainer was Multisector Income (-1.21%) while U.S Equity lagged (-3.80%).
Income Lab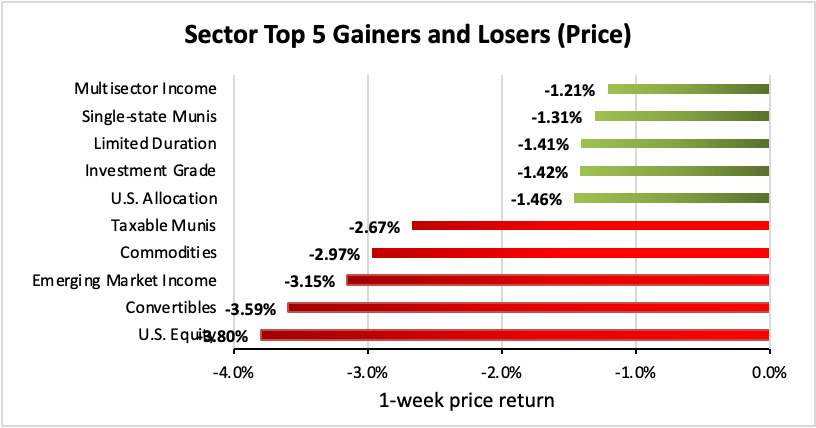
0 out of 23 sectors were positive on NAV (down from 1 last week), while the average NAV return was -2.84% (down from -1.50% last week). The top sector by NAV was Senior Loans (-1.05%) while the weakest sector by NAV was U.S Equity (-5.58%).
Income Lab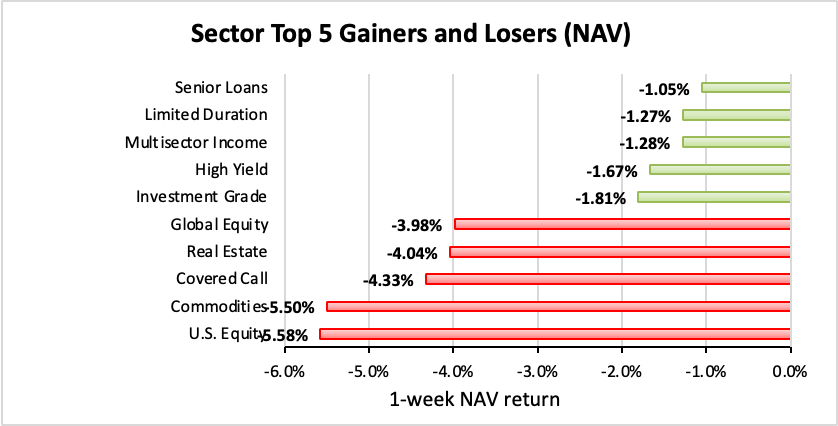
The sector with the highest premium was Limited Duration (+1.77%), while the sector with the widest discount is MLPs (-13.81%). The average sector discount is -3.96% (up from -4.07% last week).
Income Lab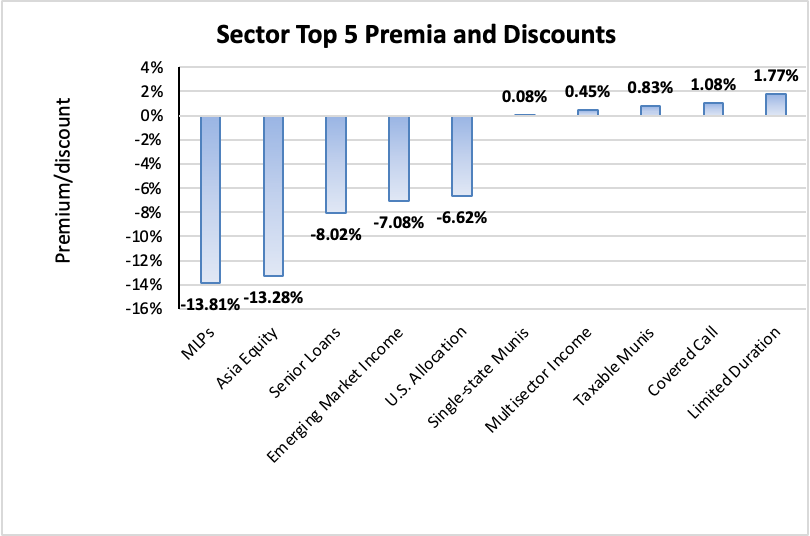
The sector with the highest premium/discount increase was Real Estate (+1.56%), while Emerging Market Income (-1.15%) showed the lowest premium/discount decline. The average change in premium/discount was +0.30% (up from -0.70% last week).
Income Lab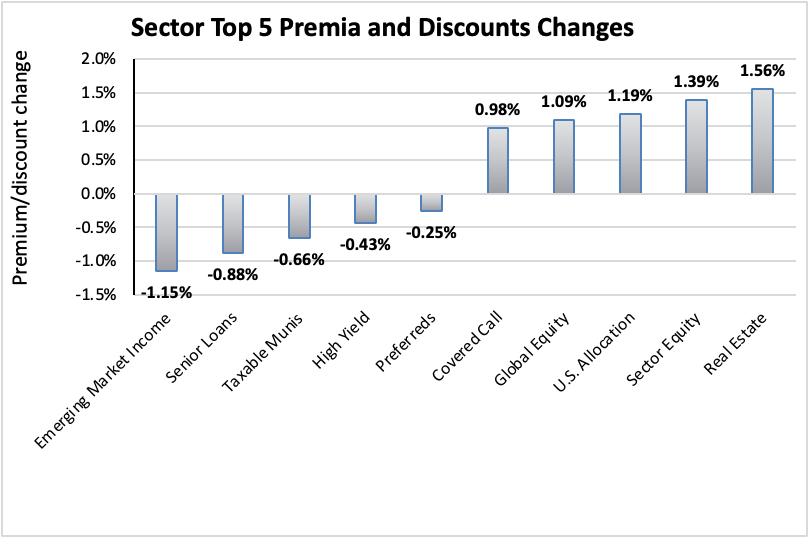
The sector with the highest average 1-year z-score is Real Estate (+1.22), while the sector with the lowest average 1-year z-score is Senior Loans (-0.92). The average z-score is +0.06 (up from -0.05 last week).
Income Lab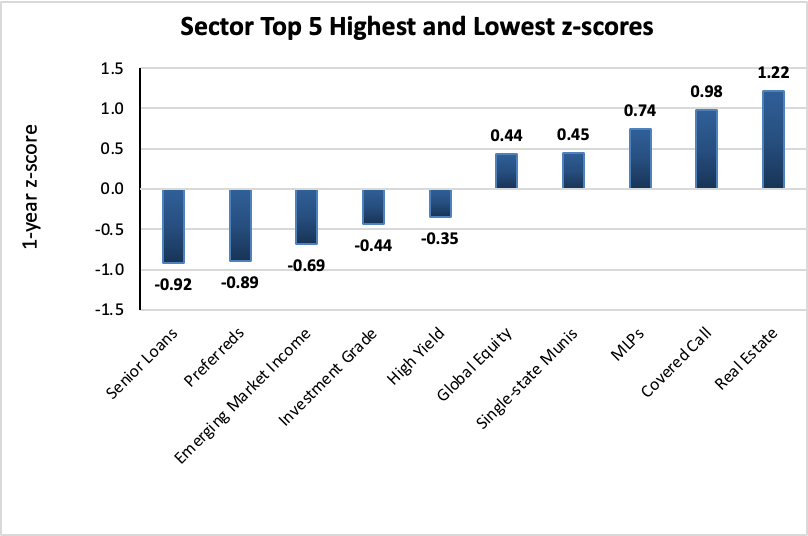
The sectors with the highest yields are Asia Equity (13.93%), Global Equity (11.97%), and Emerging Market Income (10.53%). Discounts are included for comparison. The average sector yield is +8.26% (up from +7.92% last week).
Income Lab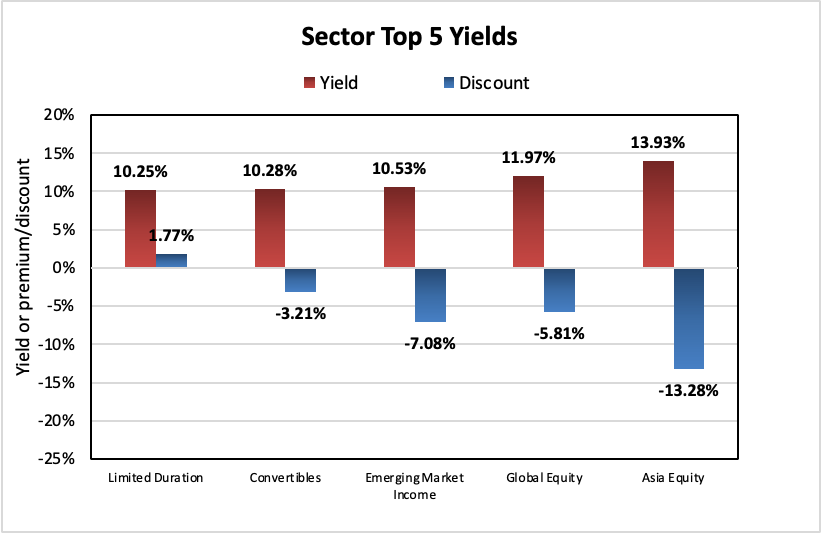
Individual CEFs that have undergone a significant decrease in premium/discount value over the past week, coupled optionally with an increasing NAV trend, a negative z-score, and/or are trading at a discount, are potential buy candidates.
| Fund | Ticker | P/D decrease | Yield | P/D | z-score | Price change | NAV change |
| Putnam Muni Opportunities | (PMO) | -7.42% | 5.65% | 0.63% | 0.3 | -8.60% | -1.84% |
| Virtus Stone Harbor Emerging Markets Inc | (EDF) | -5.95% | 16.67% | 6.14% | -0.6 | -8.67% | -3.55% |
| RiverNorth Opp Muni Income Fund Inc | (RMI) | -5.61% | 7.36% | -4.13% | 0.0 | -7.42% | -1.55% |
| Neuberger Berman Municipal | (NBH) | -4.48% | 5.49% | -9.33% | -1.3 | -6.87% | -2.26% |
| Eaton Vance Municipal Income | (EVN) | -4.09% | 5.27% | -6.06% | -0.5 | -5.65% | -1.53% |
| Barings Corporate Investors | (MCI) | -4.06% | 7.15% | -16.89% | -1.4 | -1.90% | 0.00% |
| Oxford Lane Capital Corp | (OXLC) | -3.89% | 15.33% | -5.37% | -1.8 | -2.17% | 0.00% |
| RiverNorth Specialty Finance | (RSF) | -3.65% | 11.22% | -0.78% | 0.3 | -3.95% | -0.39% |
| Invesco Municipal Inc Opp I | (OIA) | -3.62% | 5.30% | -0.61% | -0.1 | -4.99% | -1.51% |
| Eagle Point Credit Company LLC | (ECC) | -3.36% | 15.00% | 4.67% | -0.1 | -2.78% | 0.00% |
Income Lab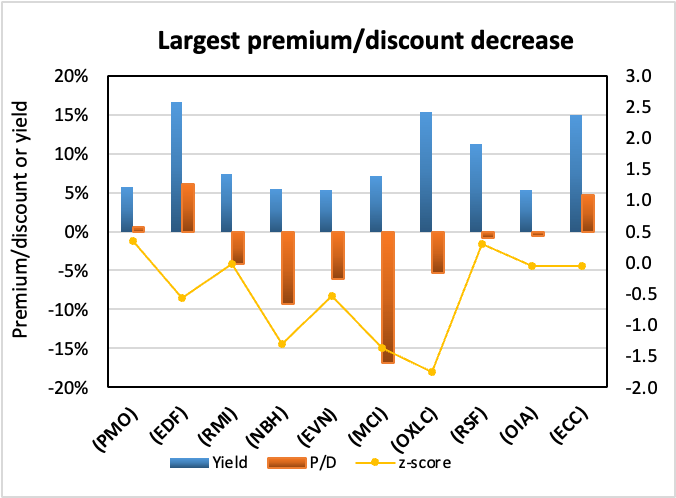
Conversely, individual CEFs that have undergone a significant increase in premium/discount value in the past week, coupled optionally with a decreasing NAV trend, a positive z-score, and/or are trading at a premium, are potential sell candidates.
| Fund | Ticker | P/D increase | Yield | P/D | z-score | Price change | NAV change |
| Gabelli Multi-Media | (GGT) | 13.64% | 12.04% | 53.25% | 2.1 | 0.83% | -10.00% |
| Gabelli Equity | (GAB) | 6.73% | 9.65% | 22.20% | 1.1 | -0.96% | -7.29% |
| Gabelli Utility Trust | (GUT) | 6.68% | 7.64% | 99.24% | 1.2 | 0.90% | -2.48% |
| Cushing® MLP & Infras Total Return | (SRV) | 6.60% | 15.35% | -16.71% | 0.7 | 4.11% | -4.09% |
| Calamos Global Total Return | (CGO) | 6.47% | 10.35% | 14.75% | 2.9 | 2.02% | -3.72% |
| Nuveen VA Quality Muni Inc | (NPV) | 6.38% | 4.28% | 12.97% | 2.0 | 3.39% | -2.44% |
| RENN Global Entrepreneurs Fund | (RCG) | 5.99% | % | -0.44% | 0.2 | 0.88% | -2.58% |
| Eaton Vance Tax-Mgd Glb Divrs Equity Inc | (EXG) | 4.86% | 9.64% | 6.72% | 2.7 | -1.04% | -5.96% |
| Nuveen MO Quality Muni Inc | (NOM) | 4.37% | 3.69% | 11.68% | 1.3 | 1.96% | -2.02% |
| First Trust Energy Income And Growth | (FEN) | 4.15% | 7.78% | -1.15% | -0.5 | 1.11% | -3.11% |
Income Lab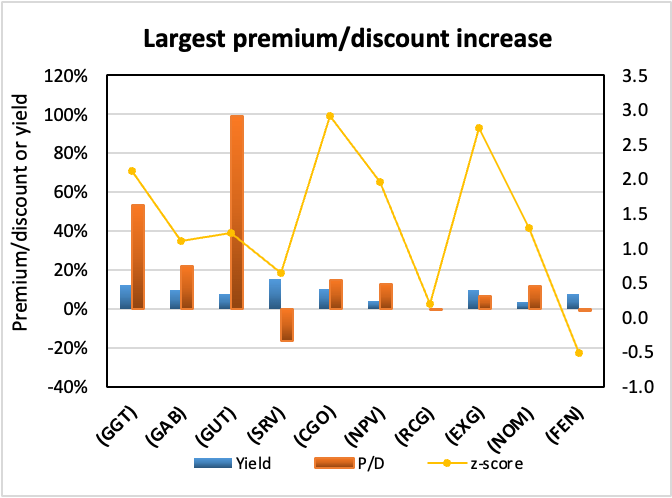
Recent corporate actions
These are from the past month. Any new news in the past week has a bolded date:
August 1, 2022 | Angel Oak Capital Advisors Announces the Completion of the Reorganization of Angel Oak Dynamic Financial Strategies Income Term Trust with and into Angel Oak Financial Strategies Income Term Trust.
Upcoming corporate actions
These are from the past month. Any new news in the past week has a bolded date:
September 1, 2022 | SALIENT MIDSTREAM & MLP FUND ANNOUNCES SHAREHOLDER APPROVAL OF REORGANIZATION WITH SALIENT MLP & ENERGY INFRASTRUCTURE FUND.
August 11, 2022 | Abrdn’s U.S. Closed-End Funds Announce Special Shareholder Meetings Relating to Proposed Acquisition of Assets of Four Delaware Management Company-Advised Closed-End Funds.
August 11, 2022 | RiverNorth/DoubleLine Strategic Opportunity Fund, Inc. Announces Transferable Rights Offering.
August 10, 2022 | Tortoise Announces Tender Offers for its Closed-End Funds.
August 4, 2022 | Saba Capital Reaches Agreement Regarding Salient Midstream & MLP Fund.
August 1, 2022 | Virtus Total Return Fund Inc. Rights Offering Declared Effective.
Recent activist or other CEF news
These are from the past month. Any new news in the past week has a bolded date:
August 4, 2022 | Saba Capital Reaches Agreement Regarding Salient Midstream & MLP Fund.
Strategy statement
Our goal at the CEF/ETF Income Laboratory is to provide consistent income with enhanced total returns. We achieve this by:
- (1) Identifying the most profitable CEF and ETF opportunities.
- (2) Avoiding mismanaged or overpriced funds that can sink your portfolio.
- (3) Employing our unique CEF rotation strategy to “double compound“ your income.
It’s the combination of these factors that has allowed our Income Generator portfolio to massively outperform our fund-of-CEFs benchmark ETF (YYY) whilst providing growing income, too (approx. 10% CAGR).
Income Lab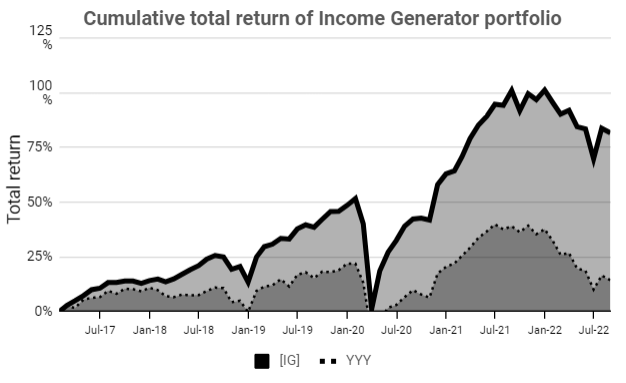
Remember, it’s really easy to put together a high-yielding CEF portfolio, but to do so profitably is another matter!
Be the first to comment